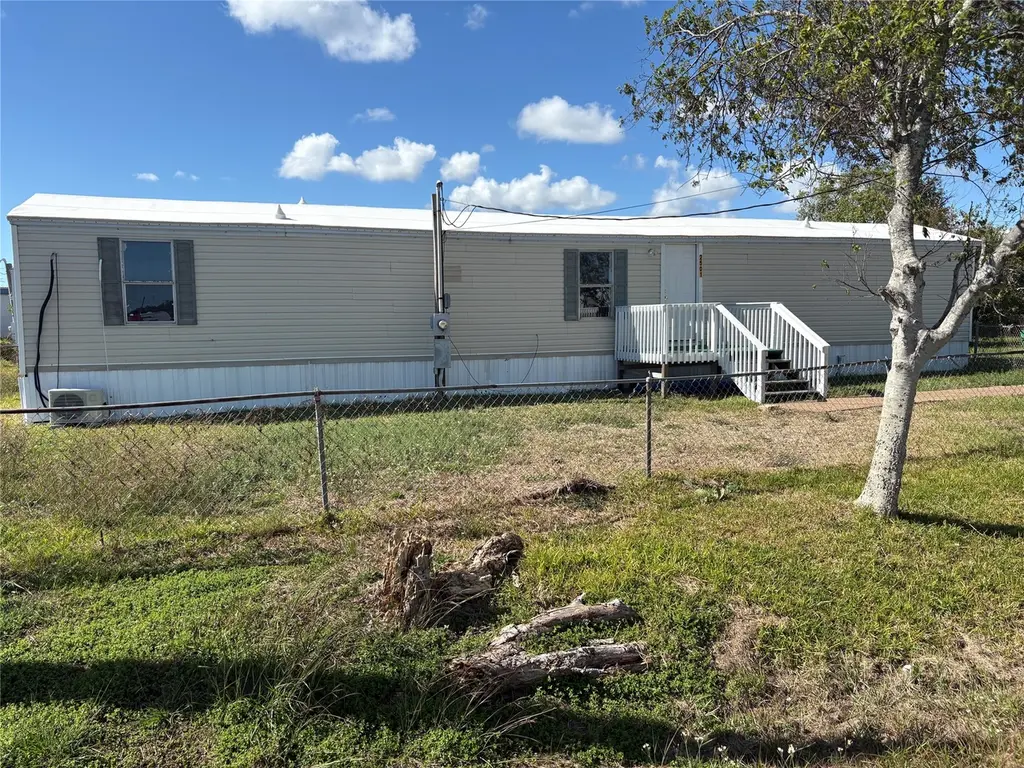
2501 Mcdonald Rd · Oyster Creek, TX
Flood risk 8/10 · Major
- FEMA flood zone
- X (unshaded)
- Chance of flooding over 30 yrs
- 0.6%
- Est. flood insurance / yr
- $507 – $1,088
Fire risk 3/10 · Minor
- Est. fire insurance / yr
- $1,222 – $2,270
Heat risk 10/10 · Severe
- Hot days now (above 112°F)
- 7 days/yr
- Hot days in 30 yrs
- 27 days/yr
Wind risk 9/10 · Severe
- Chance of severe wind over 30 yrs
- 99.0%
Air-quality risk 2/10 · Minimal
- Unhealthy air days now
- 1 days/yr
- Unhealthy air days in 30 yrs
- 1 days/yr
Risk factors via First Street. Map © Google.
Why this score? — see what drove the B- grade
The composite is a weighted blend of 9 inputs, each scored 0–100. Each bar is that input's sub-score; the figure is the points it added to the 100-point composite (weight × sub-score).
- Cash flow +30.0/30.0
- DSCR +10.0/10.0
- ARV discount +9.7/15.0
- 1% rule +8.2/10.0
- Schools +3.7/10.0
- Livability +2.6/5.0
- Rent growth +2.5/5.0
- Condition / age +2.5/5.0
- Appreciation +0.0/10.0
$109,500
🖨 Deal sheet 📄 Offer letter ✓ Due diligence
Listing remarks
This lovely three-bedroom and two-bath, fenced-in mobile home is located in rural Oyster Creek. With a population of less than 1200, you have found an affordable home in a great small community. Located less than ten minutes from the beach, shopping, and work. Laminate wood floors cover the high-traffic areas of the home, while carpeting makes the bedrooms comfortable and cozy. The kitchen is open to the large open living space for easy living and great gatherings. Come take a look at the cultured tiny community of Oyster Creek.
Key facts
- Laminate wood floors
- Open living space
- Parking
Tags
Neighborhood map
What this means for you Summary
Snapshot
- This is a 3-bed/2.0-bath manufactured listed at $110k.
Deal economics
- At list price, monthly cash flow is $439 ($5k/yr) — positive.
- The deal already cash-flows at list — no discount required.
- Meets the 1% rule at list price ($1k rent vs $110k).
- Recommended offer: $108k (1.5% below list) — sets the bar for market timing.
- Cap rate 11.8% vs local median 0.7% in Oyster Creek — top-decile yield for the area; either an underpriced asset or a hidden risk that comps aren't pricing in. Stress-test before assuming the spread holds.
Location & tenants
- Location reads 51/100 on livability (#1,483 in TX) — a working-class tenant base; expect higher turnover. Strengths: cost of living A+, crime A; Watch: schools F, amenities F, commute F.
- Brazosport ISD (suburban): math 43% / reading 41% proficiency, ranked #305 of 826 in TX (top 37%) — families likely to look elsewhere, expect single-tenant / working-renter base with shorter leases.
- Market conditions: 590 active listings in the ZIP; 3,960 units permitted in Brazoria County in 2024 (593 in 5+ unit buildings).
Forward outlook
- Local home prices are declining (-3.0%/yr); year-one equity from $757 of loan paydown is wiped out by about $3k of value loss. Plan a longer hold.
- Brazoria County population projected at +44% by 2050 — long-run rental-demand tailwind backs the buy-and-hold thesis.
- At projected returns (-3.0% appreciation + 3.0% rent growth), your $31k cash investment doubles in ~7 years — after that, you're playing with house money.
Negotiation context
- It's been on market 16 days — a 2% lower offer ($108k) is reasonable based on typical stale-listing flexibility.
- 2 sale attempts since 15y ago with the ask held roughly flat each time — persistent listings suggest the price (not the market) is what's stuck; bring a comps-based counter.
Risks & watch-outs
- Watch-outs: flood insurance adds $66/mo.
- Climate carrying-cost: severe flood risk; severe wind risk, 99% chance of damaging wind over 30y; extreme-heat days projected 7→27/yr by 2055 (HVAC capex compounding) — expect insurance premiums to compound above CPI over the hold.
Questions for the listing agent
- What's the actual annual flood-insurance premium (NFIP or private), and is the property in a SFHA with mandatory coverage?
- Is there a deadline driving the sale (1031 exchange, divorce, estate, relocation)? That informs how much negotiation room exists.
- Schools are F-rated, which usually means shorter tenancies and higher turnover. Who's the typical renter profile here, and what's been the actual vacancy rate?
- What's the average days-on-market for RENTAL listings here right now (not sales)? A rising rental-DOM trend means longer vacancies and softer asking-rent achievability than the comps imply.
- What's the recent tenant-quality profile in this submarket — average credit score on applications, eviction rate, late-payment / NSF rate, and stable-employment percentage? A property-management company in the area should have these aggregated.
- How much new for-sale + rental construction is in the pipeline within 1–3 miles? Heavy new supply typically softens prices + rents 12–24 months out; constrained supply supports both.
Investment metrics
- 1% rule
- 1.32% ✓
- Cap rate
- 11.84%
- Cash-on-cash
- 19.80%
- DSCR
- 1.88
- GRM
- 6.3
CMA / ARV
- ARV (median comp)
- $115,000
- List price
- $109,500
- Delta
- -4.78%
- Verdict
- FAIR
- Comps
- 3 within 1.0 mi
Projected returns pro-forma
-3.0% appreciation · 3.0% rent growth · sell at horizon
- IRR
- 8.5%
- Equity multiple
- 1.33×
- Total profit
- $10,235
- Equity at exit
- $16,327
- IRR
- 17.7%
- Equity multiple
- 2.46×
- Total profit
- $44,911
- Equity at exit
- $9,468
Cash invested: $30,660 (down + closing). Projections, not guarantees.
Landlord ↔ Tenant lean methodology
- Overall (STATE)
- 87 Strongly Landlord-Friendly
- State Texas
- 87 Strongly Landlord-Friendly · R+5
- County
- — inherits STATE
- City
- — inherits STATE
ZIP-level market 77541
- Home prices YoY
- -29.3%
- Active inventory
- 590
- Price-to-rent
- 6.3×
Monthly cashflow live
- Estimated rent
- $1,449 medium interval (Pro) →
- Mortgage (P&I)
- −$574
- Tax from tax record
- −$19 /mo · $223/yr
- Insurance
- −$46
- Flood insurance flood zone
- −$66 /mo · $798/yr
- HOA
- −$0
- Vacancy / Maint / Mgmt
- −$304
- Net cashflow
- $439
Break-even live
UW: 25.0% down · 7.5% · 30yr · 1.5% tax · 5.0% vac · 8.0% maint · 8.0% mgmt
Financing live
Cash to close
- Down payment
- $27,375
- Closing costs
- $3,285
- Reserves months
- —
- Total cash needed
- —
Loan-product check · same deal, 3 products live
Conventional
25% down · 7.5% · 30yr
- Down + closing
- —
- Monthly P&I
- —
- Monthly cashflow
- —
- DSCR
- —
- Eligible?
- —
Personal DTI + credit; lowest rate.
DSCR
20% down · 8.5% · 30yr
- Down + closing
- —
- Monthly P&I
- —
- Monthly cashflow
- —
- DSCR
- —
- Eligible?
- —
No personal income docs; deal must DSCR.
Hard money
10% down · 12.0% · 12mo
- Down + closing
- —
- Monthly P&I
- —
- Monthly cashflow
- —
- DSCR
- —
- Eligible?
- —
Short-term bridge; refi at stabilization.
Listing history 15 events
-
2026-06-18days on market $109,500 Active 16 DOM
-
2026-06-17days on market $109,500 Active 15 DOM
-
2026-06-16days on market $109,500 Active 14 DOM
-
2026-06-15days on market $109,500 Active 13 DOM
-
2026-06-13days on market $109,500 Active 11 DOM
-
2026-06-09days on market $109,500 Active 7 DOM
-
2026-06-08days on market $109,500 Active 6 DOM
-
2026-06-07days on market $109,500 Active 5 DOM
-
2026-06-04days on market $109,500 Active 2 DOM
-
2026-06-03remarks 535-char remark
-
2026-06-03statusdays on market $109,500 Active 1 DOM
-
2026-05-17historical
-
2025-11-20$109,500 Active
-
2013-01-01historical
-
2011-11-28$100,000
ⓘ Source: listings_history table (triggers on properties + properties_extension) + one-shot
backfill from property_details.listing_events for pre-trigger history.
Tax reassessment forecast TX · Resets to sale price
- Current annual tax
- $223 · $19/mo
- Projected year-2 tax
- $2,004 · $167/mo
- Expected delta
- +$1,781/yr (+$148/mo · 798.3%)
ⓘ Screening estimate from a state-policy table — verify with the county assessor before closing.
Climate risk First Street
- Flood 8/10 Severe FEMA zone X (unshaded) · 60% chance over 30 yrs
- Wildfire 3/10 Moderate
- Heat 10/10 Extreme 7 d/yr ≥112°F today · 27 d/yr by 30 yrs out
- Wind 9/10 Extreme 99% chance of damaging wind over 30 yrs
- Air quality 2/10 Low 1 unhealthy d/yr today · 1 by 30 yrs out
Nearby sold comps map
Loading sold comps map…
Walkable amenities ~0.75 mi
Loading nearby amenities…
Taxation est. · year 1
- Rental income
- $17,382
- − Mortgage interest
- −$6,134
- − Property taxes
- −$223
- − Insurance
- −$1,345
- − Repairs & maintenance
- −$1,391
- − Management
- −$1,391
- − Depreciation
- −$3,185
- Taxable income
- $3,714
- Est. tax owed @ 24.0%
- −$891
- After-tax cash flow
- $4,382/yr
For passive investors: Depreciation is non-cash, so a rental often shows a tax loss while cash-flowing — sheltering income. Rental losses are passive: they offset passive income freely, and up to $25,000/yr can offset ordinary (W-2) income if you actively participate and your MAGI is under $100k (phasing out to $0 by $150k); unused losses carry forward. On sale, claimed depreciation is recaptured at up to 25%, and gains may owe capital-gains tax (a 1031 exchange can defer both). Figures are a year-1 estimate at your 24.0% rate — not tax advice; consult a CPA.
Schools (NCES district)
- District
- Brazosport ISD
- NCES district ID
- 4811190
- Math proficiency
- 43% ▼ -6.00%
- Reading proficiency
- 41% ▼ -2.00%
- Median HH income
- $57,024
- Composite
- 36.84/100
- National rank
- #4557
- State rank
- #305 of 826 in TX
Livability — Oyster Creek
- Score
- 51/100
- State rank
- #1483
- US rank
- #25420
Category grades
Schools grade is shown separately in the Schools card above.
Census & demographics
- Census place
- Oyster Creek, TX
- County
- Brazoria County · 374,982 people
- Metro
- Houston-The Woodlands-Sugar Land, TX
- Population (ZIP)
- 16,996
- Household income
- $66,507
- Rent vs Own
- Severe rent burden
- 354.0
Population outlook (Brazoria County) Hauer SSP2
- Today (2025)
- 420,414 people
- By 2030
- 457,585 · +8.8%
- By 2040
- 532,232 · +26.6%
- By 2050
- 605,399 · +44.0%
- By 2075
- 779,358 · +85.4%
- By 2100
- 883,759 · +110.2%
Race, ethnicity, and origin ACS 2023
- Neighborhood character
- Diverse neighborhood (Simpson 0.62)
- Race & ethnicity
- Hispanic / Latino 47% White 38% Two or more races 23% Black 12%
- Hispanic origin (detail)
- Mexican 42%
- Common ancestry
- Romanian 1% Italian 1% Lithuanian 1%
- Foreign-born
- 12% · Canada
- Languages at home
- 71% English-only · Spanish 29%
Political lean MEDSL · Brazoria
- 2024 margin
- R (+19.7) · D 39.5% · R 59.2% · Other 1.3%
- 2008→2024 swing
- +9.9pp toward D · 2008: -29.6pp · 2024: -19.7pp
- All cycles
- 2024: R+19.7 2020: R+18.2 2016: R+24.6 2012: R+34.2 2008: R+29.6
Not yet ingested
- Civics
- —
Market trends
- HPI YoY
- ▼ -110.12%
- Current HPI
- 265.9301
- Rent YoY
- —
- Metro
- Houston-The Woodlands-Sugar Land, TX
- State GDP YoY
- ▲ 3.95%
- F500 in state
- 110
Industry mix (Fortune 500 HQ in TX)
| Industry | F500 HQs | Revenue |
|---|---|---|
| Energy | 16 | $1,198B |
|
||
| Technology | 5 | $198B |
|
||
| Engineering / Construction | 4 | $72B |
|
||
| Energy Services | 3 | $60B |
|
||
| Utilities | 3 | $41B |
|
||
| Healthcare | 2 | $330B |
|
||
Price history
+9.5% since first listed4 events — show timeline
- 2026-05-17 Listing Removed — HARMLS
- 2025-11-20 Listed $109,500 HARMLS
- 2013-01-01 Listing Removed — HARMLS
- 2011-11-28 Listed $100,000 HARMLS
Property tax history
-2.2%/yrLatest (2025): $223 · -2.0% YoY. Source: county tax records.
Cash-flow waterfall
monthlySold comps — $/sqft
last 12 mo · ≤1 miLoading sold comps…