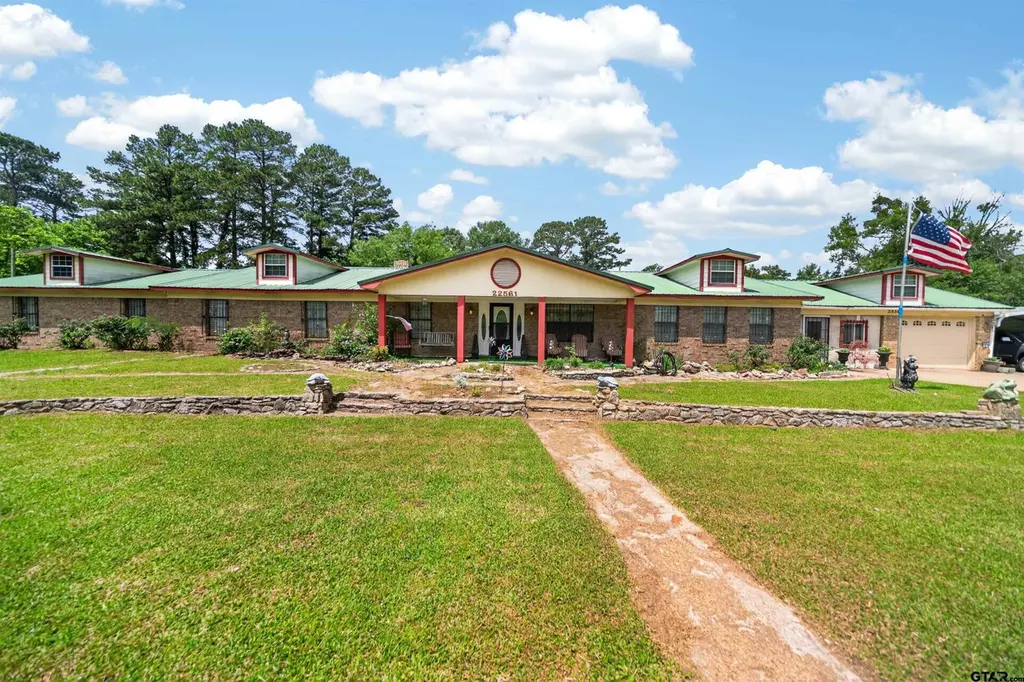
22561 Brierwood Dr · Coffee City, TX
Flood risk No data
- FEMA flood zone
- —
- Chance of flooding over 30 yrs
- —
- Est. flood insurance / yr
- —
Fire risk No data
- Est. fire insurance / yr
- —
Heat risk No data
- Hot days now (above threshold)
- —
- Hot days in 30 yrs
- —
Wind risk No data
- Chance of severe wind over 30 yrs
- —
Air-quality risk No data
- Unhealthy air days now
- —
- Unhealthy air days in 30 yrs
- —
Risk factors via First Street. Map © Google.
Why this score? — see what drove the F grade
The composite is a weighted blend of 9 inputs, each scored 0–100. Each bar is that input's sub-score; the figure is the points it added to the 100-point composite (weight × sub-score).
- Appreciation +10.0/10.0
- ARV discount +7.5/15.0
- Cash flow +4.9/30.0
- Schools +3.7/10.0
- Livability +3.2/5.0
- Rent growth +2.5/5.0
- Condition / age +2.5/5.0
- 1% rule +0.4/10.0
- DSCR +0.0/10.0
$319,000
🖨 Deal sheet (PDF) 📄 Offer letter ✓ Due diligence
Listing remarks
Nestled in the charming community of Frankston, Texas, this magnificent six-bedroom, three-bathroom residence offers a perfect blend of space and functionality. Spanning an impressive footprint across six generous lots, this brick home provides ample room for comfort and entertaining, making it a rare find in today’s market. Step inside to discover an updated kitchen that boasts Stainless appliances, sleek countertops, and ample cabinetry, a spacious pantry designed for cooking enthusiasts and entertainers alike. A nice-sized formal dining room is right across from the kitchen, ideal for hosting family dinners or intimate gatherings with friends. Beyond the kitchen, the home's invitin
Key facts
- Expansive game room
- Spacious pantry
- Formal dining room
Tags
Property features AI
Finance
- HOA & community: Homeowners association with an annual fee of $180 (approx. $15/month)
Exterior
- Parking: 2-car garage with garage door opener
- Security: Security system; Smoke detectors
- Utilities: Public water; Septic tank; Cable available
- Home design: Single family detached residence; One story; Home warranty included
- Construction: Brick and wood siding exterior; Composition roof
- Exterior features: Porch; Chain link fence; Lakefront access (Lake Palestine)
Interior
- Kitchen: Electric oven; Electric range
- Bedrooms: Bedrooms with walk-in closet(s)
- Flooring: Tile flooring
- Bathrooms: 3 full bathrooms
- Heating & cooling: Central heating; Electric heating; Wood stove; Central air conditioning; Ceiling fans; Window unit(s)
- Interior features: Walk-in closets; In-law floorplan; Pantry; Two fireplaces (one in the master bedroom)
- Laundry & utility: Electric water heater
Neighborhood map
What this means for you Summary
Snapshot
- This is a 6-bed/3.0-bath single-family listed at $319k.
Deal economics
- At list price, monthly cash flow is $-765 ($-9k/yr) — negative.
- To cash-flow at today's rent, offer at most $184k (42.4% below list).
- To meet the 1% rule (rent ≥ 1% of price), the offer needs to be $171k (46.3% below list).
- Recommended offer: $171k (46.3% below list) — sets the bar for 1% rule.
Location & tenants
- Location reads 63/100 on livability (#845 in TX) — a middle-class / working-renter tenant base. Strengths: cost of living A+, housing A+; Watch: amenities F, commute F, health & safety D-.
- Brownsboro ISD (rural): math 42% / reading 46% proficiency, ranked #290 of 826 in TX (top 35%) — families likely to look elsewhere, expect single-tenant / working-renter base with shorter leases.
- Zoned schools: Chandler El (math 42% / reading 37%, grade F, #1,545 of 4,322 statewide, top 38%, 450 students, 74% FRL); Brownsboro J H (math 48% / reading 49%, grade C-, #392 of 1,662 statewide, top 24%, 405 students, 60% FRL); Brownsboro H S (math 31% / reading 63%, grade D-, #591 of 1,632 statewide, top 38%, 757 students, 50% FRL).
- Market conditions: 191 active listings in the ZIP; 263 units permitted in Henderson County in 2024 (0 in 5+ unit buildings).
Forward outlook
- In year one you build about $34k of equity ($2k loan paydown + $32k appreciation (10.0% local appreciation)).
- By year 2, paydown + projected appreciation supports a ~$55k cash-out refi (75% LTV) — recoverable capital for the next deal without selling this one.
Negotiation context
- It's been on market 46 days — a 3% lower offer ($309k) is reasonable based on typical stale-listing flexibility.
Questions for the listing agent
- What do current leases actually rent for vs. the listed asking? Can we see a recent rent roll and the last 12 months of T-12 income?
- It's been on market 46 days. Have you received any prior offers? Is the seller open to a 46% concession, seller financing, or rate buy-down credit?
- What does the HOA fee cover, when was the last increase, and are there any pending special assessments or reserve-fund shortfalls?
- Is there a deadline driving the sale (1031 exchange, divorce, estate, relocation)? That informs how much negotiation room exists.
- Schools are F-rated, which usually means shorter tenancies and higher turnover. Who's the typical renter profile here, and what's been the actual vacancy rate?
- The area grade is low — what's the realistic commute time and amenity access for the typical tenant pool here? Any planned neighborhood developments (good or bad) we should know about?
- What's the average days-on-market for RENTAL listings here right now (not sales)? A rising rental-DOM trend means longer vacancies and softer asking-rent achievability than the comps imply.
- What's the recent tenant-quality profile in this submarket — average credit score on applications, eviction rate, late-payment / NSF rate, and stable-employment percentage? A property-management company in the area should have these aggregated.
- How much new for-sale + rental construction is in the pipeline within 1–3 miles? Heavy new supply typically softens prices + rents 12–24 months out; constrained supply supports both.
Investment metrics
- 1% rule
- 0.54% ✗
- Cap rate
- 3.42%
- Cash-on-cash
- -10.27%
- DSCR
- 0.54
- GRM
- 15.5
CMA / ARV
- ARV (median comp)
- $775,752
- List price
- $319,000
- Delta
- -58.88%
- Verdict
- UNDERPRICED
- Comps
- 2 within 1.0 mi
Show comp detail 1 sale within ~0.75 mi
| Address | Dist | Beds/Ba | Sqft | Sold | Price | $/sf | Match |
|---|---|---|---|---|---|---|---|
| 22551 Pine St | 0.35mi | 5/4.0 (-1) | 3,560 (-13%) | 8mo | $930,000 | $261 | 46 |
Match score weights: distance 35% · size 25% · config 20% · recency 20%. Top-matched comps best support the ARV.
Projected returns pro-forma
10.0% appreciation · 3.0% rent growth · sell at horizon
- IRR
- 17.1%
- Equity multiple
- 2.40×
- Total profit
- $125,000
- Equity at exit
- $287,380
- IRR
- 16.2%
- Equity multiple
- 5.55×
- Total profit
- $406,356
- Equity at exit
- $619,747
Cash invested: $89,320 (down + closing). Projections, not guarantees.
Landlord ↔ Tenant lean methodology
- Overall (STATE)
- 87 Strongly Landlord-Friendly
- State Texas
- 87 Strongly Landlord-Friendly · R+5
- County
- — inherits STATE
- City
- — inherits STATE
ZIP-level market 75763
- Home prices YoY
- 22.2%
- Active inventory
- 191
- Price-to-rent
- 15.5×
Monthly cashflow live
- Estimated rent
- $1,714 medium interval (Pro) →
- Mortgage (P&I)
- −$1,673
- Tax from tax record
- −$298 /mo · $3,581/yr
- Insurance
- −$133
- HOA
- −$15
- Vacancy / Maint / Mgmt
- −$360
- Net cashflow
- $-765
Break-even live
Sensitivity live
| Price | -10% $-584 | -5% $-674 | +0% $-765 | +5% $-855 | +10% $-945 |
|---|---|---|---|---|---|
| Rent | -10% $-900 | -5% $-833 | +0% $-765 | +5% $-697 | +10% $-629 |
| Rate | -1.0pp $-604 | -0.5pp $-684 | base $-765 | +0.5pp $-847 | +1.0pp $-932 |
UW: 25.0% down · 7.5% · 30yr · 1.5% tax · 5.0% vac · 8.0% maint · 8.0% mgmt
Financing live
Cash to close
- Down payment
- $79,750
- Closing costs
- $9,570
- Reserves months
- —
- Total cash needed
- —
Loan-product check · same deal, 3 products live
Conventional
25% down · 7.5% · 30yr
- Down + closing
- —
- Monthly P&I
- —
- Monthly cashflow
- —
- DSCR
- —
- Eligible?
- —
Personal DTI + credit; lowest rate.
DSCR
20% down · 8.5% · 30yr
- Down + closing
- —
- Monthly P&I
- —
- Monthly cashflow
- —
- DSCR
- —
- Eligible?
- —
No personal income docs; deal must DSCR.
Hard money
10% down · 12.0% · 12mo
- Down + closing
- —
- Monthly P&I
- —
- Monthly cashflow
- —
- DSCR
- —
- Eligible?
- —
Short-term bridge; refi at stabilization.
HOA detail
- Monthly dues
- $15 · $180/yr
Listing history 18 events
-
2026-06-21days on market $319,000 Active 46 DOM
-
2026-06-19days on market $319,000 Active 44 DOM
-
2026-06-18days on market $319,000 Active 43 DOM
-
2026-06-17days on market $319,000 Active 42 DOM
-
2026-06-16days on market $319,000 Active 41 DOM
-
2026-06-15days on market $319,000 Active 40 DOM
-
2026-06-14days on market $319,000 Active 38 DOM
-
2026-06-13days on market $319,000 Active 37 DOM
-
2026-06-10days on market $319,000 Active 35 DOM
-
2026-06-09days on market $319,000 Active 34 DOM
-
2026-06-08days on market $319,000 Active 33 DOM
-
2026-06-07days on market $319,000 Active 32 DOM
-
2026-06-02days on market $319,000 Active 27 DOM
-
2026-06-01days on market $319,000 Active 26 DOM
-
2026-05-31days on market $319,000 Active 25 DOM
-
2026-05-30days on market $319,000 Active 24 DOM
-
2026-05-06$319,000 Active 1710-char remark
-
1991-01-16soldstatus
ⓘ Source: listings_history table (triggers on properties + properties_extension) + one-shot
backfill from property_details.listing_events for pre-trigger history.
Tax reassessment forecast TX · Resets to sale price
- Current annual tax
- $3,581 · $298/mo
- Projected year-2 tax
- $5,838 · $486/mo
- Expected delta
- +$2,257/yr (+$188/mo · 63.0%)
ⓘ Screening estimate from a state-policy table — verify with the county assessor before closing.
Nearby sold comps map
Loading sold comps map…
Walkable amenities ~0.75 mi
Loading nearby amenities…
Taxation est. · year 1
- Rental income
- $20,574
- − Mortgage interest
- −$17,869
- − Property taxes
- −$3,581
- − Insurance
- −$1,595
- − Repairs & maintenance
- −$1,646
- − Management
- −$1,646
- − HOA
- −$180
- − Depreciation
- −$9,280
- Taxable loss
- −$15,223
- Est. tax savings @ 24.0%
- +$3,654
- After-tax cash flow
- $-5,524/yr
For passive investors: Depreciation is non-cash, so a rental often shows a tax loss while cash-flowing — sheltering income. Rental losses are passive: they offset passive income freely, and up to $25,000/yr can offset ordinary (W-2) income if you actively participate and your MAGI is under $100k (phasing out to $0 by $150k); unused losses carry forward. On sale, claimed depreciation is recaptured at up to 25%, and gains may owe capital-gains tax (a 1031 exchange can defer both). Figures are a year-1 estimate at your 24.0% rate — not tax advice; consult a CPA.
Schools (NCES district)
- District
- Brownsboro ISD
- NCES district ID
- 4811640
- Math proficiency
- 42% ▼ -5.00%
- Reading proficiency
- 46% ▬ 0.00%
- Median HH income
- $45,624
- Composite
- 37.38/100
- National rank
- #4429
- State rank
- #290 of 826 in TX
Livability — Coffee City
- Score
- 63/100
- State rank
- #845
- US rank
- #15290
Category grades
Schools grade is shown separately in the Schools card above.
Census & demographics
- Population (ZIP)
- 6,319
Population outlook (Henderson County) Hauer SSP2
- Today (2025)
- 80,471 people
- By 2030
- 80,608 · +0.2%
- By 2040
- 80,087 · -0.5%
- By 2050
- 78,208 · -2.8%
- By 2075
- 72,423 · -10.0%
- By 2100
- 61,012 · -24.2%
Race, ethnicity, and origin ACS 2023
- Neighborhood character
- Predominantly White (79%)
- Race & ethnicity
- White 79% Two or more races 10% Hispanic / Latino 8% Black 5%
- Hispanic origin (detail)
- Mexican 7%
- Common ancestry
- Lithuanian 3% Iranian 2% Slovak 1%
- Foreign-born
- 3% · Canada
- Languages at home
- 94% English-only · Spanish 6%
Political lean MEDSL · Henderson
- 2024 margin
- Solid R (+63.5) · D 18.0% · R 81.4%
- 2008→2024 swing
- -18.8pp toward R · 2008: -44.6pp · 2024: -63.5pp
- All cycles
- 2024: R+63.5 2020: R+60.2 2016: R+60.0 2012: R+54.8 2008: R+44.6
Not yet ingested
- Civics
- —
Market trends
- HPI YoY
- ▲ 53.53%
- Current HPI
- 295.14
- Rent YoY
- —
- Metro
- —
- State GDP YoY
- ▲ 3.95%
- F500 in state
- 110
Industry mix (Fortune 500 HQ in TX)
| Industry | F500 HQs | Revenue |
|---|---|---|
| Energy | 16 | $1,198B |
|
||
| Technology | 5 | $198B |
|
||
| Engineering / Construction | 4 | $72B |
|
||
| Energy Services | 3 | $60B |
|
||
| Utilities | 3 | $41B |
|
||
| Healthcare | 2 | $330B |
|
||
Price history
2 events — show timeline
- 2026-05-06 Listed $319,000 GTAR
- 1991-01-16 Sold (Public Records) — Public Records
Property tax history
+1.6%/yrLatest (2025): $3,581 · +8.0% YoY. Source: county tax records.
Cash-flow waterfall
monthlySold comps — $/sqft
last 12 mo · ≤1 miLoading sold comps…