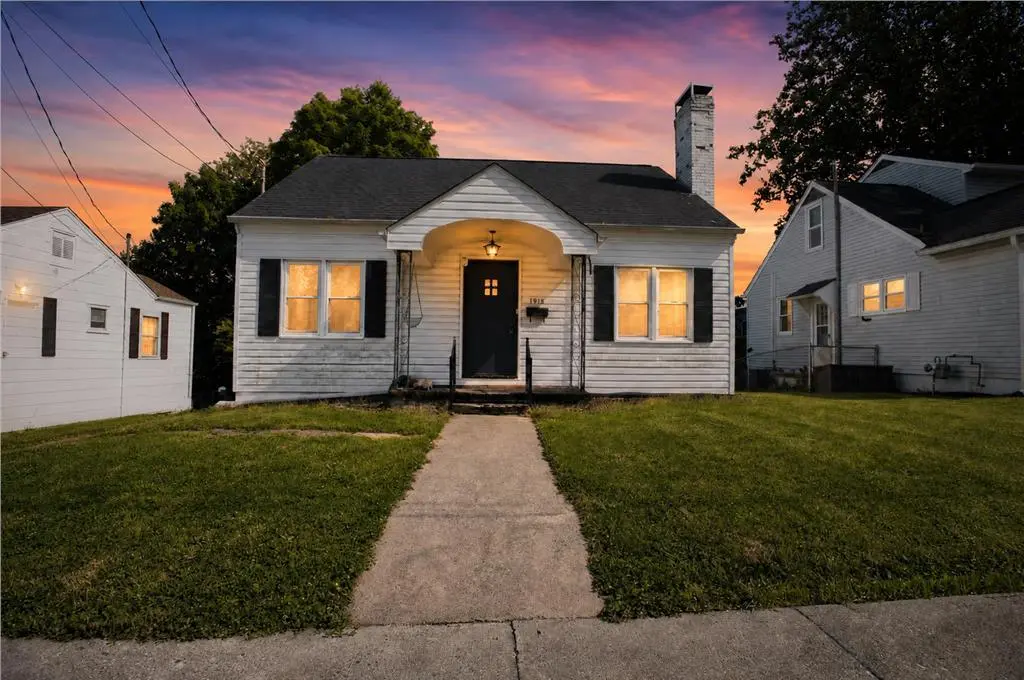
1918 Norway St · Bristol, VA
Flood risk 1/10 · Minimal
- FEMA flood zone
- X (unshaded)
- Chance of flooding over 30 yrs
- 0.0%
- Est. flood insurance / yr
- $473 – $860
Fire risk 4/10 · Minor
- Est. fire insurance / yr
- $666 – $1,236
Heat risk 4/10 · Minor
- Hot days now (above 98°F)
- 8 days/yr
- Hot days in 30 yrs
- 23 days/yr
Wind risk 2/10 · Minimal
- Chance of severe wind over 30 yrs
- —
Air-quality risk 2/10 · Minimal
- Unhealthy air days now
- 1 days/yr
- Unhealthy air days in 30 yrs
- 2 days/yr
Risk factors via First Street. Map © Google.
Why this score? — see what drove the B+ grade
The composite is a weighted blend of 9 inputs, each scored 0–100. Each bar is that input's sub-score; the figure is the points it added to the 100-point composite (weight × sub-score).
- Cash flow +30.0/30.0
- ARV discount +15.0/15.0
- DSCR +10.0/10.0
- 1% rule +8.2/10.0
- Schools +5.2/10.0
- Livability +3.7/5.0
- Rent growth +2.5/5.0
- Condition / age +2.5/5.0
- Appreciation +0.0/10.0
$139,900
🖨 Deal sheet (PDF) 📄 Offer letter ✓ Due diligence
Listing remarks MLS
This cozy home is located in downtown Bristol, VA. The home offers 3 bedrooms, 1.5 baths; through out the home you will find hardwood floors and an abudance of storage space. Home also offers more living space in the basement and more storage. This would make a great family home. Cute as can be.
Key facts
- Large back deck
- Downstairs den
- Updated kitchen
Tags
Property features AI
Exterior
- Utilities: Public water; Public sewer
- Home design: Single family residence; One and one half stories; Residential property (R1 zoning)
- Construction: Frame construction with vinyl siding; Shingle roof
- Exterior features: Deck; Wooded lot
Interior
- Kitchen: Refrigerator
- Flooring: Wood
- Bathrooms: 1 full bathroom; 1 half bathroom
- Heating & cooling: Central heating; Central air conditioning; Ceiling fans
- Interior features: Refrigerator included; Wood flooring; Basement present
Neighborhood map
What this means for you Summary
Snapshot
- This is a 3-bed/1.5-bath single-family listed at $140k.
Deal economics
- At list price, monthly cash flow is $617 ($7k/yr) — positive.
- The deal already cash-flows at list — no discount required.
- Meets the 1% rule at list price ($2k rent vs $140k).
- Recommended offer: $138k (1.5% below list) — sets the bar for market timing.
- Cap rate 11.6% vs local median 4.9% in Bristol — top-decile yield for the area; either an underpriced asset or a hidden risk that comps aren't pricing in. Stress-test before assuming the spread holds.
Location & tenants
- Location reads 74/100 on livability (#140 in VA, #4,544 nationally) — a middle-class / working-renter tenant base. Strengths: cost of living A+, housing A+, health & safety A+; Watch: crime F, commute F, employment F.
- Bristol City Public School District (urban): math 57% / reading 70% proficiency, ranked #53 of 131 in VA (top 40%) — acceptable for families but not a draw, mixed tenant base, ~2y average lease.
- Zoned schools: Stonewall Jackson Elementary (math 47% / reading 67%, grade C+, #597 of 1,108 statewide, top 57%, 254 students, 102% FRL); Virginia Middle (math 56% / reading 71%, grade B+, #128 of 342 statewide, top 39%, 487 students, 101% FRL); Virginia High (math 62% / reading 77%, grade B, #159 of 319 statewide, top 53%, 637 students, 100% FRL) — zoned schools average 101% FRL vs 58% district-wide (43 pts higher); higher-poverty schools than district average — tighter screening recommended.
- Market conditions: 157 active listings in the ZIP; 10 comparable units currently listed for rent nearby; rentals at typical pace (median 15d on market — plan ~3-4 weeks tenant-placement turnaround); 15 units permitted in Bristol city in 2024 (5 in 5+ unit buildings).
Forward outlook
- Local home prices are declining (-3.0%/yr); year-one equity from $967 of loan paydown is wiped out by about $4k of value loss. Plan a longer hold.
- Bristol County population projected at -20% by 2050 — secular population decline; favor cash flow + early exit over multi-decade hold.
- At projected returns (-3.0% appreciation + 3.0% rent growth), your $39k cash investment doubles in ~7 years — after that, you're playing with house money.
Negotiation context
- It's been on market 15 days — a 2% lower offer ($138k) is reasonable based on typical stale-listing flexibility.
- 4 sale attempts since 11y ago with the ask held roughly flat each time — persistent listings suggest the price (not the market) is what's stuck; bring a comps-based counter.
- Current owner paid $94k; 49% above their basis — modest negotiation headroom, anchor on the comps not their cost.
Risks & watch-outs
- Watch-outs: built in 1942 — expect roof / HVAC / electrical / plumbing capex.
Questions for the listing agent
- Built in 1942 — when were the roof, HVAC, electrical panel, plumbing, and water heater last replaced?
- Is there a deadline driving the sale (1031 exchange, divorce, estate, relocation)? That informs how much negotiation room exists.
- Schools are A-rated — typically a magnet for longer-tenancy family renters. What's the average tenant stay here, and is there a school-zone premium baked into asking?
- Crime grade is F in this area — have there been break-ins, vandalism, or insurance claims at this property in the last 3 years? What carrier currently insures it and at what premium?
- What's the average days-on-market for RENTAL listings here right now (not sales)? A rising rental-DOM trend means longer vacancies and softer asking-rent achievability than the comps imply.
- What's the recent tenant-quality profile in this submarket — average credit score on applications, eviction rate, late-payment / NSF rate, and stable-employment percentage? A property-management company in the area should have these aggregated.
- How much new for-sale + rental construction is in the pipeline within 1–3 miles? Heavy new supply typically softens prices + rents 12–24 months out; constrained supply supports both.
Investment metrics
- 1% rule
- 1.32% ✓
- Cap rate
- 11.59%
- Cash-on-cash
- 18.91%
- DSCR
- 1.84
- GRM
- 6.3
CMA / ARV
- ARV (on-the-fly)
- $204,288
- Comps found
- 12
Show comp detail 12 sales within ~0.75 mi
| Address | Dist | Beds/Ba | Sqft | Sold | Price | $/sf | Match |
|---|---|---|---|---|---|---|---|
| 420 Douglas St | 0.34mi | 3/1.0 | 1,588 (-0%) | 8mo | $227,000 | $143 | 75 |
| 1712 Broad St | 0.29mi | 3/2.0 | 1,612 (+1%) | 10mo | $85,000 | $53 | 75 |
| 1600 Norway St | 0.22mi | 3/1.5 | 1,478 (-7%) | 14mo | $186,500 | $126 | 66 |
| 664 Page St | 0.49mi | 3/1.0 | 1,446 (-9%) | 0mo | $168,500 | $117 | 59 |
| 1836 Anderson St | 0.39mi | 3/2.0 | 1,425 (-11%) | 4mo | $235,000 | $165 | 58 |
| 2549 Bay St | 0.68mi | 3/2.0 | 1,700 (+6%) | 1mo | $290,000 | $171 | 54 |
| 461 Douglas St | 0.37mi | 4/2.0 (+1) | 1,418 (-11%) | 5mo | $193,500 | $136 | 53 |
| 1116 Shelby St | 0.59mi | 3/1.5 | 1,490 (-7%) | 10mo | $70,000 | $47 | 53 |
| 1133 Hill St | 0.67mi | 4/2.0 (+1) | 1,582 (-1%) | 10mo | $191,500 | $121 | 52 |
| 1149 Moorland Ave | 0.16mi | 4/2.5 (+1) | 1,833 (+15%) | 10mo | $165,000 | $90 | 50 |
| 1412 Anderson St | 0.41mi | 2/2.0 (-1) | 1,382 (-13%) | 2mo | $235,000 | $170 | 49 |
| 2021 Windsor Ave | 0.54mi | 2/2.0 (-1) | 1,372 (-14%) | 11mo | $175,000 | $128 | 35 |
Match score weights: distance 35% · size 25% · config 20% · recency 20%. Top-matched comps best support the ARV.
Projected returns pro-forma
-3.0% appreciation · 3.0% rent growth · sell at horizon
- IRR
- 10.7%
- Equity multiple
- 1.42×
- Total profit
- $16,593
- Equity at exit
- $20,860
- IRR
- 19.8%
- Equity multiple
- 2.66×
- Total profit
- $64,877
- Equity at exit
- $12,096
Cash invested: $39,172 (down + closing). Projections, not guarantees.
Landlord ↔ Tenant lean methodology
- Overall (STATE)
- 55 Moderately Landlord-Leaning
- State Virginia
- 55 Moderately Landlord-Leaning · D+2
- County
- — inherits STATE
- City
- — inherits STATE
ZIP-level market 24201
- Active inventory
- 157
- Price-to-rent
- 6.3×
Monthly cashflow live
- Estimated rent
- $1,851 high interval (Pro) →
- Mortgage (P&I)
- −$734
- Tax from tax record
- −$53 /mo · $641/yr
- Insurance
- −$58
- HOA
- −$0
- Vacancy / Maint / Mgmt
- −$389
- Net cashflow
- $617
Break-even live
Sensitivity live
| Price | -10% $696 | -5% $657 | +0% $617 | +5% $578 | +10% $538 |
|---|---|---|---|---|---|
| Rent | -10% $471 | -5% $544 | +0% $617 | +5% $690 | +10% $763 |
| Rate | -1.0pp $688 | -0.5pp $653 | base $617 | +0.5pp $581 | +1.0pp $544 |
UW: 25.0% down · 7.5% · 30yr · 1.5% tax · 5.0% vac · 8.0% maint · 8.0% mgmt
Financing live
Cash to close
- Down payment
- $34,975
- Closing costs
- $4,197
- Reserves months
- —
- Total cash needed
- —
Loan-product check · same deal, 3 products live
Conventional
25% down · 7.5% · 30yr
- Down + closing
- —
- Monthly P&I
- —
- Monthly cashflow
- —
- DSCR
- —
- Eligible?
- —
Personal DTI + credit; lowest rate.
DSCR
20% down · 8.5% · 30yr
- Down + closing
- —
- Monthly P&I
- —
- Monthly cashflow
- —
- DSCR
- —
- Eligible?
- —
No personal income docs; deal must DSCR.
Hard money
10% down · 12.0% · 12mo
- Down + closing
- —
- Monthly P&I
- —
- Monthly cashflow
- —
- DSCR
- —
- Eligible?
- —
Short-term bridge; refi at stabilization.
Rent comps 10 comps
| Address | Beds | Baths | Sqft | Rent | $/sqft | DOM | Units | Dist |
|---|---|---|---|---|---|---|---|---|
| 1405 Newton St Bristol, VA | 3.0 | 1.0 | 1200 | $1,600 | $1.33 | 15d | 1 | 0.32mi |
| 1216 Norway St Unit 102 Bristol, VA | 2.0 | 1.0 | 1215 | $1,600 | $1.32 | 15d | 1 | 0.44mi |
| 1216 Norway St Unit 101 Bristol, VA | 4.0 | 2.0 | 1615 | $2,100 | $1.30 | 15d | 1 | 0.44mi |
| 1718 Clifton Rd Bristol, TN | 3.0 | 1.5 | 1672 | $1,900 | $1.14 | 45d | 1 | 0.51mi |
| 145 Midway St Unit 1397968P Bristol, VA | 3.0 | 2.0 | 1388 | $5,335 | $3.84 | 22d | 1 | 0.53mi |
| 2510 Catherine St Bristol, VA | 3.0 | 2.0 | 1418 | $2,500 | $1.76 | 15d | 1 | 0.58mi |
| 203 Opal Ln Unit 4 Bristol, VA | 2.0 | 1.5 | 1200 | $1,500 | $1.25 | 22d | 1 | 0.71mi |
| 1156 Bristol View Dr Bristol, VA | 2.0 | 2.5 | 1152 | $1,650 | $1.43 | 15d | 2 | 0.76mi |
| 712 Haynes St Bristol, TN | 3.0 | 2.0 | 2228 | $2,100 | $0.94 | 15d | 1 | 1.20mi |
| 2931 Broad St #124 Bristol, TN | 3.0 | 2.5 | 1248 | $1,500 | $1.20 | 22d | 1 | 1.35mi |
Listing history 11 events
-
2026-06-18days on market $139,900 Active 15 DOM
-
2026-06-17days on market $139,900 Active 14 DOM
-
2026-06-16days on market $139,900 Active 13 DOM
-
2026-06-15days on market $139,900 Active 12 DOM
-
2026-06-14days on market $139,900 Active 10 DOM
-
2026-06-13days on market $139,900 Active 9 DOM
-
2026-06-10days on market $139,900 Active 7 DOM
-
2026-06-09days on market $139,900 Active 6 DOM
-
2026-06-08days on market $139,900 Active 5 DOM
-
2026-06-07remarks 544-char remark
-
2026-06-07$139,900 Active 4 DOM
ⓘ Source: listings_history table (triggers on properties + properties_extension) + one-shot
backfill from property_details.listing_events for pre-trigger history.
Tax reassessment forecast VA · Resets to sale price
- Current annual tax
- $641 · $53/mo
- Projected year-2 tax
- $1,147 · $96/mo
- Expected delta
- +$506/yr (+$42/mo · 78.9%)
ⓘ Screening estimate from a state-policy table — verify with the county assessor before closing.
Climate risk First Street
- Flood 1/10 Low FEMA zone X (unshaded) · 0% chance over 30 yrs
- Wildfire 4/10 Moderate
- Heat 4/10 Moderate 8 d/yr ≥98°F today · 23 d/yr by 30 yrs out
- Wind 2/10 Low
- Air quality 2/10 Low 1 unhealthy d/yr today · 2 by 30 yrs out
Nearby sold comps map
Loading sold comps map…
Walkable amenities ~0.75 mi
Loading nearby amenities…
Taxation est. · year 1
- Rental income
- $22,216
- − Mortgage interest
- −$7,837
- − Property taxes
- −$641
- − Insurance
- −$700
- − Repairs & maintenance
- −$1,777
- − Management
- −$1,777
- − Depreciation
- −$4,070
- Taxable income
- $5,415
- Est. tax owed @ 24.0%
- −$1,300
- After-tax cash flow
- $6,107/yr
For passive investors: Depreciation is non-cash, so a rental often shows a tax loss while cash-flowing — sheltering income. Rental losses are passive: they offset passive income freely, and up to $25,000/yr can offset ordinary (W-2) income if you actively participate and your MAGI is under $100k (phasing out to $0 by $150k); unused losses carry forward. On sale, claimed depreciation is recaptured at up to 25%, and gains may owe capital-gains tax (a 1031 exchange can defer both). Figures are a year-1 estimate at your 24.0% rate — not tax advice; consult a CPA.
Schools (NCES district)
- District
- Bristol City Public School District
- NCES district ID
- 5100450
- Math proficiency
- 57% ▼ -24.00%
- Reading proficiency
- 70% ▼ -6.00%
- Median HH income
- $33,978
- Composite
- 52.4/100
- National rank
- #1579
- State rank
- #53 of 131 in VA
Livability — Bristol
- Score
- 74/100
- State rank
- #140
- US rank
- #4544
Category grades
Schools grade is shown separately in the Schools card above.
Census & demographics
- Census place
- Bristol, VA
- City population
- 16,039
- Population (ZIP)
- 16,039
Population outlook (Bristol County) Hauer SSP2
- Today (2025)
- 16,113 people
- By 2030
- 15,510 · -3.7%
- By 2040
- 14,121 · -12.4%
- By 2050
- 12,847 · -20.3%
- By 2075
- 9,870 · -38.7%
- By 2100
- 7,883 · -51.1%
Race, ethnicity, and origin ACS 2023
- Neighborhood character
- Predominantly White (85%)
- Race & ethnicity
- White 85% Black 7% Two or more races 6% Hispanic / Latino 3%
- Common ancestry
- Slovak 4% Serbian 1% Iranian 0%
- Foreign-born
- 1% · Canada
- Languages at home
- 98% English-only · Spanish 2%
Political lean MEDSL · Bristol
- 2024 margin
- Solid R (+39.7) · D 29.8% · R 69.5%
- 2008→2024 swing
- -13.6pp toward R · 2008: -26.0pp · 2024: -39.7pp
- All cycles
- 2024: R+39.7 2020: R+38.9 2016: R+43.8 2012: R+31.1 2008: R+26.0
Not yet ingested
- Civics
- —
Market trends
- HPI YoY
- ▼ -206.40%
- Current HPI
- 196.2099
- Rent YoY
- —
- Metro
- —
- State GDP YoY
- ▲ 2.40%
- F500 in state
- 50
Industry mix (Fortune 500 HQ in VA)
| Industry | F500 HQs | Revenue |
|---|---|---|
| Aerospace / Defense | 4 | $236B |
|
||
| Technology / Defense | 3 | $32B |
|
||
| Financial Services | 2 | $176B |
|
||
| Utilities | 2 | $27B |
|
||
| Insurance | 2 | $25B |
|
||
| Technology | 2 | $15B |
|
||
Price history
+49.6% since first listed9 events — show timeline
- 2026-06-02 Listed $139,900 SWVAR
- 2019-11-12 Sold (Public Records) $94,000 Public Records
- 2019-11-12 Sold (MLS) $94,000 TVRMLS
- 2019-11-12 Sold (MLS) $94,000 SWVAR
- 2019-09-23 Listed $94,985 TVRMLS
- 2019-09-03 Listed $94,985 SWVAR
- 2015-05-04 Sold (Public Records) $88,000 Public Records
- 2015-05-01 Sold (MLS) $88,000 TVRMLS
- 2015-03-02 Listed $93,500 TVRMLS
Cash-flow waterfall
monthlySold comps — $/sqft
last 12 mo · ≤1 miLoading sold comps…