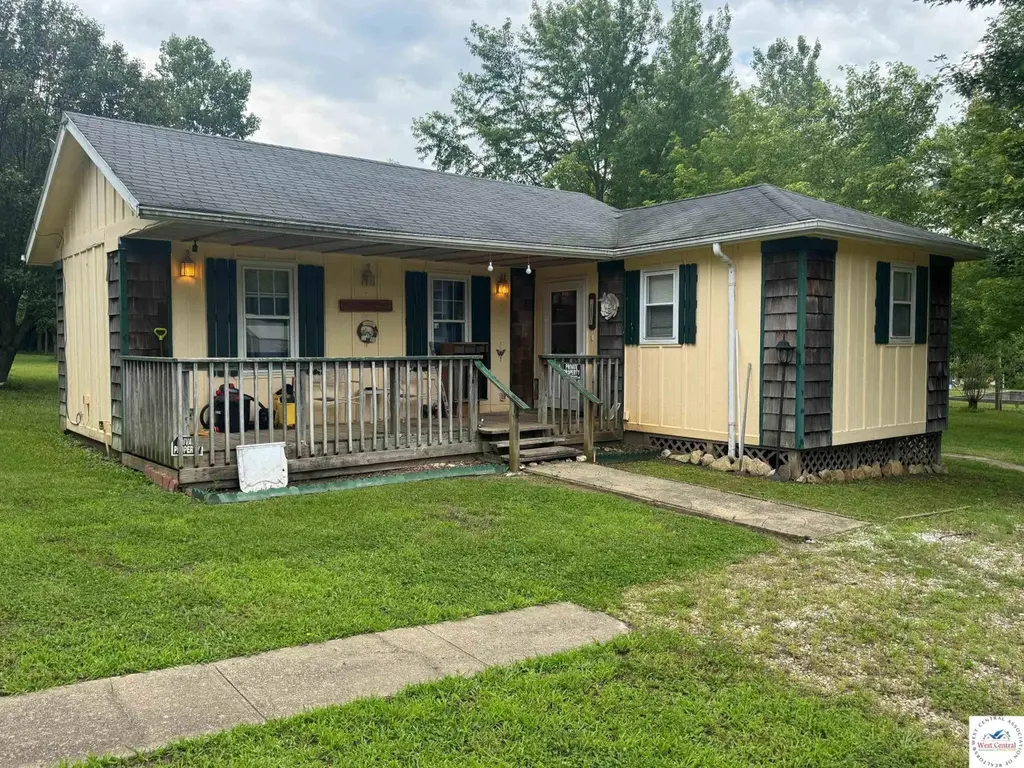
25437 Ondolando Rd · Hermitage, MO
Flood risk 1/10 · Minimal
- FEMA flood zone
- —
- Chance of flooding over 30 yrs
- 0.0%
- Est. flood insurance / yr
- —
Fire risk 3/10 · Minor
- Est. fire insurance / yr
- $1,054 – $1,958
Heat risk 5/10 · Moderate
- Hot days now (above 108°F)
- 7 days/yr
- Hot days in 30 yrs
- 19 days/yr
Wind risk 2/10 · Minimal
- Chance of severe wind over 30 yrs
- —
Air-quality risk 2/10 · Minimal
- Unhealthy air days now
- 0 days/yr
- Unhealthy air days in 30 yrs
- 1 days/yr
Risk factors via First Street. Map © Google.
Why this score? — see what drove the D+ grade
The composite is a weighted blend of 9 inputs, each scored 0–100. Each bar is that input's sub-score; the figure is the points it added to the 100-point composite (weight × sub-score).
- Cash flow +10.6/30.0
- Appreciation +10.0/10.0
- ARV discount +7.5/15.0
- Schools +4.1/10.0
- DSCR +3.1/10.0
- Livability +2.7/5.0
- Rent growth +2.5/5.0
- Condition / age +2.5/5.0
- 1% rule +2.3/10.0
$120,000
🖨 Deal sheet (PDF) 📄 Offer letter ✓ Due diligence
Listing remarks
Cute 2 BR, 1 BA home on nearly 2 acres with a lot of potential. Property has 4 outbuildings including 2 garages with living quarters above and 2 single car garages. There is also a concrete foundation that has not been built on. The property is conveniently located just off the highway and a very short distance to Pomme De Terre lake. The residences and garages do need work however, once completed it would make a great family lake getaway.
Key facts
- Outbuildings
- Concrete foundation
- 1.91 acre lot
Tags
Property features AI
Exterior
- Parking: Detached garage with 6 covered/garage parking spaces (6 total spaces)
- Home design: Single-family residence; Residential property
- Exterior features: Corner lot on County Rd. 296 and Ondolando Rd.; Approximately 1.91-acre lot
Interior
- Bathrooms: 1 full bathroom
- Interior features: One full bathroom
Neighborhood map
What this means for you Summary
Snapshot
- This is a 2-bed/1.0-bath other listed at $120k.
Deal economics
- At list price, monthly cash flow is $-59 ($-706/yr) — negative.
- To cash-flow at today's rent, offer at most $110k (8.7% below list).
- To meet the 1% rule (rent ≥ 1% of price), the offer needs to be $88k (26.6% below list).
- Recommended offer: $88k (26.6% below list) — sets the bar for 1% rule.
- Cap rate 5.7% vs local median 3.3% in Hermitage — top-decile yield for the area; either an underpriced asset or a hidden risk that comps aren't pricing in. Stress-test before assuming the spread holds.
Location & tenants
- Location reads 54/100 on livability (#788 in MO) — a working-class tenant base; expect higher turnover. Strengths: cost of living A+, housing B; Watch: crime F, amenities F, commute F.
- Hermitage R-IV (rural): math 45% / reading 50% proficiency, ranked #185 of 535 in MO (top 35%) — families likely to look elsewhere, expect single-tenant / working-renter base with shorter leases.
- Zoned schools: Hermitage Elem. (math 47% / reading 47%, grade D-, #347 of 1,115 statewide, top 35%, 138 students, 58% FRL); Hermitage Middle (math 24% / reading 44%, grade F, #243 of 391 statewide, top 65%, 50 students, 44% FRL); Hermitage High (math 10% / reading 50%, grade F, #377 of 521 statewide, top 73%, 81 students, 51% FRL).
- Market conditions: 45 active listings in the ZIP.
Forward outlook
- In year one you build about $13k of equity ($830 loan paydown + $12k appreciation (10.0% local appreciation)).
- Hickory County population projected at -26% by 2050 — secular population decline; favor cash flow + early exit over multi-decade hold.
- At projected returns (10.0% appreciation + 3.0% rent growth), your $34k cash investment doubles in ~3 years — after that, you're playing with house money.
- By year 3, paydown + projected appreciation supports a ~$32k cash-out refi (75% LTV) — recoverable capital for the next deal without selling this one.
Negotiation context
- Only 13 days on market — expect competitive offers; lowballing is unlikely to land.
Risks & watch-outs
- Climate carrying-cost: extreme-heat days projected 7→19/yr by 2055 (HVAC capex compounding) — expect insurance premiums to compound above CPI over the hold.
Questions for the listing agent
- What do current leases actually rent for vs. the listed asking? Can we see a recent rent roll and the last 12 months of T-12 income?
- Is there a deadline driving the sale (1031 exchange, divorce, estate, relocation)? That informs how much negotiation room exists.
- Schools are D-rated, which usually means shorter tenancies and higher turnover. Who's the typical renter profile here, and what's been the actual vacancy rate?
- Crime grade is F in this area — have there been break-ins, vandalism, or insurance claims at this property in the last 3 years? What carrier currently insures it and at what premium?
- The area grade is low — what's the realistic commute time and amenity access for the typical tenant pool here? Any planned neighborhood developments (good or bad) we should know about?
- What's the average days-on-market for RENTAL listings here right now (not sales)? A rising rental-DOM trend means longer vacancies and softer asking-rent achievability than the comps imply.
- What's the recent tenant-quality profile in this submarket — average credit score on applications, eviction rate, late-payment / NSF rate, and stable-employment percentage? A property-management company in the area should have these aggregated.
- How much new for-sale + rental construction is in the pipeline within 1–3 miles? Heavy new supply typically softens prices + rents 12–24 months out; constrained supply supports both.
Investment metrics
- 1% rule
- 0.73% ✗
- Cap rate
- 5.70%
- Cash-on-cash
- -2.10%
- DSCR
- 0.91
- GRM
- 11.3
CMA / ARV
No comps found within radius.
Projected returns pro-forma
10.0% appreciation · 3.0% rent growth · sell at horizon
- IRR
- 22.8%
- Equity multiple
- 2.83×
- Total profit
- $61,577
- Equity at exit
- $108,106
- IRR
- 20.4%
- Equity multiple
- 6.48×
- Total profit
- $184,216
- Equity at exit
- $233,134
Cash invested: $33,600 (down + closing). Projections, not guarantees.
Landlord ↔ Tenant lean methodology
- Overall (STATE)
- 81 Strongly Landlord-Friendly
- State Missouri
- 81 Strongly Landlord-Friendly · R+10
- County
- — inherits STATE
- City
- — inherits STATE
ZIP-level market 65724
- Home prices YoY
- 5.4%
- Active inventory
- 45
- Price-to-rent
- 11.3×
Monthly cashflow live
- Estimated rent
- $881 medium interval (Pro) →
- Mortgage (P&I)
- −$629
- Tax from tax record
- −$76 /mo · $909/yr
- Insurance
- −$50
- HOA
- −$0
- Vacancy / Maint / Mgmt
- −$185
- Net cashflow
- $-59
Break-even live
Sensitivity live
| Price | -10% $9 | -5% $-25 | +0% $-59 | +5% $-93 | +10% $-127 |
|---|---|---|---|---|---|
| Rent | -10% $-128 | -5% $-94 | +0% $-59 | +5% $-24 | +10% $11 |
| Rate | -1.0pp $2 | -0.5pp $-28 | base $-59 | +0.5pp $-90 | +1.0pp $-122 |
UW: 25.0% down · 7.5% · 30yr · 1.5% tax · 5.0% vac · 8.0% maint · 8.0% mgmt
Financing live
Cash to close
- Down payment
- $30,000
- Closing costs
- $3,600
- Reserves months
- —
- Total cash needed
- —
Loan-product check · same deal, 3 products live
Conventional
25% down · 7.5% · 30yr
- Down + closing
- —
- Monthly P&I
- —
- Monthly cashflow
- —
- DSCR
- —
- Eligible?
- —
Personal DTI + credit; lowest rate.
DSCR
20% down · 8.5% · 30yr
- Down + closing
- —
- Monthly P&I
- —
- Monthly cashflow
- —
- DSCR
- —
- Eligible?
- —
No personal income docs; deal must DSCR.
Hard money
10% down · 12.0% · 12mo
- Down + closing
- —
- Monthly P&I
- —
- Monthly cashflow
- —
- DSCR
- —
- Eligible?
- —
Short-term bridge; refi at stabilization.
Listing history 10 events
-
2026-06-21days on market $120,000 Active 13 DOM
-
2026-06-21days on market $120,000 Active 12 DOM
-
2026-06-18days on market $120,000 Active 10 DOM
-
2026-06-17days on market $120,000 Active 9 DOM
-
2026-06-16days on market $120,000 Active 8 DOM
-
2026-06-15days on market $120,000 Active 7 DOM
-
2026-06-13days on market $120,000 Active 5 DOM
-
2026-06-12days on market $120,000 Active 4 DOM
-
2026-06-09remarks 443-char remark
-
2026-06-09$120,000 Active 1 DOM
ⓘ Source: listings_history table (triggers on properties + properties_extension) + one-shot
backfill from property_details.listing_events for pre-trigger history.
Tax reassessment forecast MO · Resets to sale price
- Current annual tax
- $909 · $76/mo
- Projected year-2 tax
- $1,164 · $97/mo
- Expected delta
- +$255/yr (+$21/mo · 28.0%)
ⓘ Screening estimate from a state-policy table — verify with the county assessor before closing.
Climate risk First Street
- Flood 1/10 Low 0% chance over 30 yrs
- Wildfire 3/10 Moderate
- Heat 5/10 Major 7 d/yr ≥108°F today · 19 d/yr by 30 yrs out
- Wind 2/10 Low
- Air quality 2/10 Low 0 unhealthy d/yr today · 1 by 30 yrs out
Nearby sold comps map
Loading sold comps map…
Walkable amenities ~0.75 mi
Loading nearby amenities…
Taxation est. · year 1
- Rental income
- $10,576
- − Mortgage interest
- −$6,722
- − Property taxes
- −$909
- − Insurance
- −$600
- − Repairs & maintenance
- −$846
- − Management
- −$846
- − Depreciation
- −$3,491
- Taxable loss
- −$2,838
- Est. tax savings @ 24.0%
- +$681
- After-tax cash flow
- $-25/yr
For passive investors: Depreciation is non-cash, so a rental often shows a tax loss while cash-flowing — sheltering income. Rental losses are passive: they offset passive income freely, and up to $25,000/yr can offset ordinary (W-2) income if you actively participate and your MAGI is under $100k (phasing out to $0 by $150k); unused losses carry forward. On sale, claimed depreciation is recaptured at up to 25%, and gains may owe capital-gains tax (a 1031 exchange can defer both). Figures are a year-1 estimate at your 24.0% rate — not tax advice; consult a CPA.
Schools (NCES district)
- District
- Hermitage R-IV
- NCES district ID
- 2914310
- Math proficiency
- 45% ▬ 0.00%
- Reading proficiency
- 50% ▲ 5.00%
- Median HH income
- $30,066
- Composite
- 40.92/100
- National rank
- #7513
- State rank
- #185 of 535 in MO
Livability — Hermitage
- Score
- 54/100
- State rank
- #788
- US rank
- #23974
Category grades
Schools grade is shown separately in the Schools card above.
Census & demographics
- Population (ZIP)
- 1,728
Population outlook (Hickory County) Hauer SSP2
- Today (2025)
- 8,206 people
- By 2030
- 7,690 · -6.3%
- By 2040
- 6,780 · -17.4%
- By 2050
- 6,076 · -26.0%
- By 2075
- 5,088 · -38.0%
- By 2100
- 4,489 · -45.3%
Race, ethnicity, and origin ACS 2023
- Neighborhood character
- Predominantly White (98%)
- Race & ethnicity
- White 98%
- Common ancestry
- Italian 17% Lithuanian 4% Iranian 1%
- Languages at home
- 97% English-only · German/W. Germanic 3%
Political lean MEDSL · Hickory
- 2024 margin
- Solid R (+61.1) · D 19.1% · R 80.2%
- 2008→2024 swing
- -47.9pp toward R · 2008: -13.3pp · 2024: -61.1pp
- All cycles
- 2024: R+61.1 2020: R+57.3 2016: R+53.5 2012: R+23.6 2008: R+13.3
Not yet ingested
- Civics
- —
Market trends
- HPI YoY
- ▲ 11.14%
- Current HPI
- 216.4684
- Rent YoY
- —
- Metro
- —
- State GDP YoY
- ▲ 1.84%
- F500 in state
- 20
Industry mix (Fortune 500 HQ in MO)
| Industry | F500 HQs | Revenue |
|---|---|---|
| Healthcare | 1 | $163B |
|
||
| Insurance | 1 | $21B |
|
||
| Industrial Technology | 1 | $17B |
|
||
| Retail | 1 | $16B |
|
||
| Industrial Distribution | 1 | $10B |
|
||
| Utilities | 1 | $9B |
|
||
Price history
4 events — show timeline
- 2026-06-08 Listed $120,000 WCAR
- 2025-04-03 Sold (Public Records) — Public Records
- 2022-10-13 Sold (Public Records) — Public Records
- 2019-01-01 Sold (Public Records) — Public Records
Property tax history
+1.9%/yrLatest (2025): $909 · +7.9% YoY. Source: county tax records.
Cash-flow waterfall
monthlySold comps — $/sqft
last 12 mo · ≤1 miLoading sold comps…