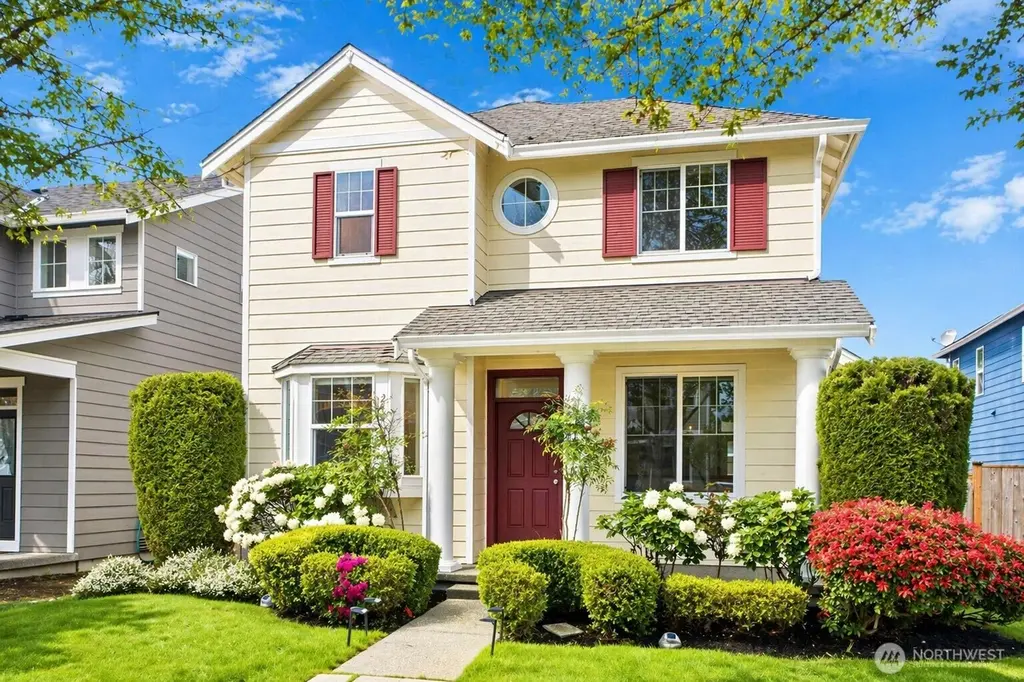
24713 233rd Pl SE · Maple Valley, WA
Flood risk 1/10 · Minimal
- FEMA flood zone
- X (unshaded)
- Chance of flooding over 30 yrs
- 0.0%
- Est. flood insurance / yr
- $507 – $1,088
Fire risk 1/10 · Minimal
- Est. fire insurance / yr
- $604 – $1,122
Heat risk 2/10 · Minimal
- Hot days now (above 87°F)
- 7 days/yr
- Hot days in 30 yrs
- 15 days/yr
Wind risk 1/10 · Minimal
- Chance of severe wind over 30 yrs
- —
Air-quality risk 7/10 · Major
- Unhealthy air days now
- 11 days/yr
- Unhealthy air days in 30 yrs
- 16 days/yr
Risk factors via First Street. Map © Google.
Why this score? — see what drove the D grade
The composite is a weighted blend of 9 inputs, each scored 0–100. Each bar is that input's sub-score; the figure is the points it added to the 100-point composite (weight × sub-score).
- ARV discount +13.3/15.0
- Cash flow +7.2/30.0
- Schools +6.6/10.0
- Livability +4.2/5.0
- Rent growth +3.2/5.0
- Condition / age +2.5/5.0
- 1% rule +1.7/10.0
- DSCR +1.4/10.0
- Appreciation +0.0/10.0
$688,500
🖨 Deal sheet (PDF) 📄 Offer letter ✓ Due diligence
Listing remarks
Welcome to the Mews at Lake Wilderness—a charming community just minutes from top dining, shopping, parks, trails, and easy freeway access. Step inside to a warm, inviting main floor with a cozy gas fireplace and stunning kitchen featuring quartz counters and stainless steel appliances (all included!). Slide open the dining room doors to your private, fully fenced backyard and spacious deck—your personal retreat for spring and summer entertaining. Upstairs, the luxurious primary suite impresses with a 5-piece en-suite and deep soaking tub. Two additional bedrooms, a full guest bath, and a versatile bonus room—perfect for a home office or flex space—complete the upper
Key facts
- Cozy gas fireplace
- Quartz counters
- Spacious deck
Tags
Property features AI
Finance
- Financial info: Financing accepted: Cash, Conventional, FHA, VA
- HOA & community: HOA with semi-annual fee of $330; HOA covers common area maintenance; Community governed by CCRs
Exterior
- Parking: Attached garage; Covered parking for 2 vehicles
- Security: Fully fenced; Security system
- Utilities: Public water; Sewer connected (public); Power by PSE; Internet: Xfinity; Water & sewer: local districts
- Home design: Single family residence; Two-story house; Entry on main level; Has a view
- Construction: Cement and cement plank construction; Composition roof; Poured concrete foundation; Built on lot
- Exterior features: Cement/Concrete exterior; Cement plank siding; Deck; Fully fenced yard; Garden space; Brush vegetation; Cable TV available; High-speed internet available; Gas available
Interior
- Kitchen: Dishwasher; Garbage disposal; Microwave; Refrigerator; Stove/Range
- Bedrooms: 3 bedrooms (all on the upper level); Primary bedroom (upper level); Additional bedrooms on upper level
- Flooring: Hardwood; Vinyl; Carpet
- Bathrooms: 2 full bathrooms (upper level); 1 half bathroom (main level); Two bathtubs; Two showers
- Heating & cooling: Forced air heating; Forced air cooling; Natural gas energy source
- Interior features: Ceiling fans; Security system; Walk-in closet(s); Gas fireplace
- Laundry & utility: Washer; Dryer; Utility room on main level
Neighborhood map
What this means for you Summary
Snapshot
- This is a 3-bed/2.5-bath single-family listed at $688k.
Deal economics
- At list price, monthly cash flow is $-955 ($-11k/yr) — negative.
- To cash-flow at today's rent, offer at most $520k (24.5% below list).
- To meet the 1% rule (rent ≥ 1% of price), the offer needs to be $459k (33.3% below list).
- Recommended offer: $459k (33.3% below list) — sets the bar for 1% rule.
- Cap rate 4.6% vs local median 3.2% in Maple Valley — top-decile yield for the area; either an underpriced asset or a hidden risk that comps aren't pricing in. Stress-test before assuming the spread holds.
Location & tenants
- Location reads 85/100 on livability (#24 in WA, #461 nationally) — a professional / high-income tenant draw. Strengths: employment A+, housing A+, health & safety A+; Watch: cost of living F.
- Tahoma School District (suburban): math 68% / reading 76% proficiency, ranked #10 of 291 in WA (top 3%) — strong family-tenant draw, lease renewals of 3-5y typical; only 11% free/reduced lunch — higher-income household profile.
- Zoned schools: Cedar River Elementary (601 students, 12% FRL); Summit Trail Middle School (1,098 students, 15% FRL); Tahoma Senior High School (2,790 students, 19% FRL) — zoned schools at 15% FRL track the district average.
- Market conditions: Rents rising (+2.8%/yr); 226 active listings in the ZIP; 4 comparable units currently listed for rent nearby; rentals lingering (median 46d on market — plan ~5-8 weeks vacancy on turnover, expect pricing pressure); 75% of comp listings sitting > 30 days — soft ceiling on asking rent; high-income renter base; 10,555 units permitted in King County in 2024 (7,119 in 5+ unit buildings).
- This rent runs 36% of the median local income ($152k/yr) — at the standard rent-burdened threshold; future hikes will face affordability resistance.
Forward outlook
- Local home prices are declining (-3.0%/yr); year-one equity from $5k of loan paydown is wiped out by about $21k of value loss. Plan a longer hold.
- King County population projected at +44% by 2050 — long-run rental-demand tailwind backs the buy-and-hold thesis.
Negotiation context
- It's been on market 55 days — a 3% lower offer ($668k) is reasonable based on typical stale-listing flexibility.
- 5 sale attempts since 24y ago with the ask held roughly flat each time — persistent listings suggest the price (not the market) is what's stuck; bring a comps-based counter.
Questions for the listing agent
- What do current leases actually rent for vs. the listed asking? Can we see a recent rent roll and the last 12 months of T-12 income?
- It's been on market 55 days. Have you received any prior offers? Is the seller open to a 33% concession, seller financing, or rate buy-down credit?
- What does the HOA fee cover, when was the last increase, and are there any pending special assessments or reserve-fund shortfalls?
- Is there a deadline driving the sale (1031 exchange, divorce, estate, relocation)? That informs how much negotiation room exists.
- Schools are A-rated — typically a magnet for longer-tenancy family renters. What's the average tenant stay here, and is there a school-zone premium baked into asking?
- The area grade is low — what's the realistic commute time and amenity access for the typical tenant pool here? Any planned neighborhood developments (good or bad) we should know about?
- What's the average days-on-market for RENTAL listings here right now (not sales)? A rising rental-DOM trend means longer vacancies and softer asking-rent achievability than the comps imply.
- What's the recent tenant-quality profile in this submarket — average credit score on applications, eviction rate, late-payment / NSF rate, and stable-employment percentage? A property-management company in the area should have these aggregated.
- How much new for-sale + rental construction is in the pipeline within 1–3 miles? Heavy new supply typically softens prices + rents 12–24 months out; constrained supply supports both.
Investment metrics
- 1% rule
- 0.67% ✗
- Cap rate
- 4.63%
- Cash-on-cash
- -5.94%
- DSCR
- 0.74
- GRM
- 12.5
CMA / ARV
- ARV (median comp)
- $791,141
- List price
- $688,500
- Delta
- -12.97%
- Verdict
- UNDERPRICED
- Comps
- 20 within 1.0 mi
Show comp detail 12 sales within ~0.75 mi
| Address | Dist | Beds/Ba | Sqft | Sold | Price | $/sf | Match |
|---|---|---|---|---|---|---|---|
| 23312 SE 239th St | 0.52mi | 3/2.5 | 1,860 (+2%) | 2mo | $739,000 | $397 | 71 |
| 22335 SE 244th Pl | 0.59mi | 3/2.5 | 1,800 (-1%) | 3mo | $860,000 | $478 | 68 |
| 24720 233rd Pl SE | 0.03mi | 4/2.5 (+1) | 2,040 (+12%) | 7mo | $770,000 | $377 | 68 |
| 23803 SE 247th Pl | 0.35mi | 3/2.5 | 1,660 (-9%) | 2mo | $682,000 | $411 | 67 |
| 22419 SE 244th St | 0.55mi | 3/2.5 | 1,890 (+4%) | 1mo | $735,000 | $389 | 67 |
| 24028 235th Ave SE | 0.43mi | 3/2.5 | 1,700 (-7%) | 5mo | $650,000 | $382 | 65 |
| 22329 SE 244th Pl | 0.60mi | 3/2.5 | 1,730 (-5%) | 0mo | $860,000 | $497 | 63 |
| 23617 SE 243rd Pl | 0.31mi | 3/2.5 | 1,560 (-14%) | 0mo | $650,000 | $417 | 62 |
| 23712 SE 243rd Pl | 0.37mi | 3/2.5 | 1,560 (-14%) | 3mo | $639,000 | $410 | 57 |
| 22305 SE 244th Pl | 0.65mi | 3/2.5 | 2,000 (+10%) | 2mo | $775,000 | $388 | 51 |
| 24404 222nd Ave SE | 0.66mi | 4/2.5 (+1) | 1,980 (+9%) | 1mo | $799,950 | $404 | 49 |
| 25242 Lake Wilderness Country Club Dr SE | 0.70mi | 3/2.0 | 2,040 (+12%) | 0mo | $860,000 | $422 | 45 |
Match score weights: distance 35% · size 25% · config 20% · recency 20%. Top-matched comps best support the ARV.
Projected returns pro-forma
-3.0% appreciation · 2.76% rent growth · sell at horizon
- IRR
- -26.8%
- Equity multiple
- 0.10×
- Total profit
- $-173,508
- Equity at exit
- $102,658
- IRR
- -25.1%
- Equity multiple
- -0.21×
- Total profit
- $-234,049
- Equity at exit
- $59,529
Cash invested: $192,780 (down + closing). Projections, not guarantees.
Landlord ↔ Tenant lean methodology
- Overall (STATE)
- 28 Tenant-Leaning
- State Washington
- 28 Tenant-Leaning · D+8
- County
- — inherits STATE
- City
- — inherits STATE
ZIP-level market 98038
- Rents YoY
- 2.8%
- Active inventory
- 226
- Price-to-rent
- 12.5×
Monthly cashflow live
- Estimated rent
- $4,592 medium interval (Pro) →
- Mortgage (P&I)
- −$3,611
- Tax from tax record
- −$629 /mo · $7,554/yr
- Insurance
- −$287
- HOA
- −$55
- Vacancy / Maint / Mgmt
- −$964
- Net cashflow
- $-955
Break-even live
Sensitivity live
| Price | -10% $-565 | -5% $-760 | +0% $-955 | +5% $-1,149 | +10% $-1,344 |
|---|---|---|---|---|---|
| Rent | -10% $-1,317 | -5% $-1,136 | +0% $-955 | +5% $-773 | +10% $-592 |
| Rate | -1.0pp $-608 | -0.5pp $-779 | base $-955 | +0.5pp $-1,133 | +1.0pp $-1,314 |
UW: 25.0% down · 7.5% · 30yr · 1.5% tax · 5.0% vac · 8.0% maint · 8.0% mgmt
Financing live
Cash to close
- Down payment
- $172,125
- Closing costs
- $20,655
- Reserves months
- —
- Total cash needed
- —
Loan-product check · same deal, 3 products live
Conventional
25% down · 7.5% · 30yr
- Down + closing
- —
- Monthly P&I
- —
- Monthly cashflow
- —
- DSCR
- —
- Eligible?
- —
Personal DTI + credit; lowest rate.
DSCR
20% down · 8.5% · 30yr
- Down + closing
- —
- Monthly P&I
- —
- Monthly cashflow
- —
- DSCR
- —
- Eligible?
- —
No personal income docs; deal must DSCR.
Hard money
10% down · 12.0% · 12mo
- Down + closing
- —
- Monthly P&I
- —
- Monthly cashflow
- —
- DSCR
- —
- Eligible?
- —
Short-term bridge; refi at stabilization.
Rent comps 4 comps
| Address | Beds | Baths | Sqft | Rent | $/sqft | DOM | Units | Dist |
|---|---|---|---|---|---|---|---|---|
| 24116 235th Ave SE Maple Valley, WA | 3.0 | 3.0 | 1680 | $3,272 | $1.95 | 26d | 1 | 0.42mi |
| 24212 224th Ave SE Unit 4 Maple Valley, WA | 2.0 | 2.0 | 1320 | $5,400 | $4.09 | 46d | 1 | 0.69mi |
| 24202 224th Ave SE Unit 3 Maple Valley, WA | 2.0 | 2.0 | 1320 | $5,400 | $4.09 | 46d | 1 | 0.71mi |
| 23223 SE 262nd Ct Maple Valley, WA | 4.0 | 2.5 | 2610 | $4,400 | $1.69 | 46d | 1 | 0.98mi |
HOA detail
- Monthly dues
- $55 · $660/yr
- Likely covers
- gas
Listing history 29 events
-
2026-06-22days on market $688,500 Active 55 DOM
-
2026-06-21days on market $688,500 Active 54 DOM
-
2026-06-18days on market $688,500 Active 51 DOM
-
2026-06-17days on market $688,500 Active 50 DOM
-
2026-06-16days on market $688,500 Active 49 DOM
-
2026-06-15days on market $688,500 Active 48 DOM
-
2026-06-13days on market $688,500 Active 46 DOM
-
2026-06-09pricedays on market $688,500 Active 42 DOM
-
2026-06-08days on market $698,500 Active 41 DOM
-
2026-06-07days on market $698,500 Active 40 DOM
-
2026-06-04days on market $698,500 Active 37 DOM
-
2026-06-03days on market $698,500 Active 36 DOM
-
2026-06-02days on market $698,500 Active 35 DOM
-
2026-06-01days on market $698,500 Active 34 DOM
-
2026-05-31days on market $698,500 Active 33 DOM
-
2026-04-28$698,500 Active
-
2023-05-04soldstatus $680,000 Closed
-
2023-05-04soldstatus $680,000
-
2023-04-09status Pending
-
2023-04-06$675,000 Active
-
2008-01-25soldstatus $325,000 Sold
-
2008-01-15soldstatus $325,000
-
2008-01-14historical
-
2007-12-11status
-
2007-12-10historical
-
2007-11-27price $339,950
-
2007-08-31$341,750
-
2002-12-20soldstatus $220,053
-
2002-07-17$216,470
ⓘ Source: listings_history table (triggers on properties + properties_extension) + one-shot
backfill from property_details.listing_events for pre-trigger history.
Tax reassessment forecast WA · Resets to sale price
- Current annual tax
- $7,554 · $629/mo
- Projected year-2 tax
- $7,554 · $629/mo
- Expected delta
- $0/yr ($0/mo · 0.0%)
ⓘ Screening estimate from a state-policy table — verify with the county assessor before closing.
Climate risk First Street
- Flood 1/10 Low FEMA zone X (unshaded) · 0% chance over 30 yrs
- Wildfire 1/10 Low
- Heat 2/10 Low 7 d/yr ≥87°F today · 15 d/yr by 30 yrs out
- Wind 1/10 Low
- Air quality 7/10 Severe 11 unhealthy d/yr today · 16 by 30 yrs out
Nearby sold comps map
Loading sold comps map…
Walkable amenities ~0.75 mi
Loading nearby amenities…
Taxation est. · year 1
- Rental income
- $55,099
- − Mortgage interest
- −$38,567
- − Property taxes
- −$7,554
- − Insurance
- −$3,442
- − Repairs & maintenance
- −$4,408
- − Management
- −$4,408
- − HOA
- −$660
- − Depreciation
- −$20,029
- Taxable loss
- −$23,969
- Est. tax savings @ 24.0%
- +$5,753
- After-tax cash flow
- $-5,702/yr
For passive investors: Depreciation is non-cash, so a rental often shows a tax loss while cash-flowing — sheltering income. Rental losses are passive: they offset passive income freely, and up to $25,000/yr can offset ordinary (W-2) income if you actively participate and your MAGI is under $100k (phasing out to $0 by $150k); unused losses carry forward. On sale, claimed depreciation is recaptured at up to 25%, and gains may owe capital-gains tax (a 1031 exchange can defer both). Figures are a year-1 estimate at your 24.0% rate — not tax advice; consult a CPA.
Schools (NCES district)
- District
- Tahoma School District
- NCES district ID
- 5308760
- Math proficiency
- 68% ▬ 0.00%
- Reading proficiency
- 76% ▬ 0.00%
- Median HH income
- $94,834
- Composite
- 66.41/100
- National rank
- #925
- State rank
- #10 of 291 in WA
Livability — Maple Valley
- Score
- 85/100
- State rank
- #24
- US rank
- #461
Category grades
Schools grade is shown separately in the Schools card above.
Census & demographics
- Census place
- Maple Valley, WA
- County
- King County · 2,251,916 people
- City population
- 37,324
- Metro
- Seattle-Tacoma-Bellevue, WA
- Population (ZIP)
- 37,324
- Household income
- $152,261
- Rent vs Own
- Severe rent burden
- 580.0
Population outlook (King County) Hauer SSP2
- Today (2025)
- 2,576,485 people
- By 2030
- 2,803,316 · +8.8%
- By 2040
- 3,255,921 · +26.4%
- By 2050
- 3,706,444 · +43.9%
- By 2075
- 4,746,063 · +84.2%
- By 2100
- 5,407,730 · +109.9%
Race, ethnicity, and origin ACS 2023
- Neighborhood character
- Predominantly White (73%)
- Race & ethnicity
- White 73% Asian 10% Two or more races 9% Hispanic / Latino 6% Black 2%
- Hispanic origin (detail)
- Mexican 3%
- Common ancestry
- Portuguese 5% Italian 4% Romanian 3%
- Foreign-born
- 13% · Canada, China, South Korea
- Languages at home
- 86% English-only · Other Asian/Pacific 4% Russian/Polish/Slavic 3% Other Indo-European 2%
Political lean MEDSL · King
- 2024 margin
- Solid D (+51.7) · D 74.2% · R 22.5% · Other 3.4%
- 2008→2024 swing
- +9.6pp toward D · 2008: 42.1pp · 2024: 51.7pp
- All cycles
- 2024: D+51.7 2020: D+52.7 2016: D+50.4 2012: D+39.9 2008: D+42.1
Not yet ingested
- Civics
- —
Market trends
- HPI YoY
- ▼ -588.79%
- Current HPI
- 310.7428
- Rent YoY
- ▲ 2.76%
- Metro
- Seattle-Tacoma-Bellevue, WA
- State GDP YoY
- ▲ 4.65%
- F500 in state
- 22
Industry mix (Fortune 500 HQ in WA)
| Industry | F500 HQs | Revenue |
|---|---|---|
| Retail | 2 | $269B |
|
||
| Technology / Retail | 1 | $638B |
|
||
| Technology | 1 | $245B |
|
||
| Telecommunications | 1 | $38B |
|
||
| Food / Beverage | 1 | $36B |
|
||
| Automotive / Trucks | 1 | $34B |
|
||
Price history
+218.1% since first listed15 events — show timeline
- 2026-06-08 Price Changed $688,500 NWMLS as Distributed by MLS Grid
- 2026-04-28 Listed $698,500 NWMLS as Distributed by MLS Grid
- 2023-05-04 Sold (Public Records) $680,000 Public Records
- 2023-05-04 Sold (MLS) $680,000 NWMLS as Distributed by MLS Grid
- 2023-04-09 Pending — NWMLS as Distributed by MLS Grid
- 2023-04-06 Listed $675,000 NWMLS as Distributed by MLS Grid
- 2008-01-25 Sold (MLS) $325,000 NWMLS as Distributed by MLS Grid
- 2008-01-15 Sold (Public Records) $325,000 Public Records
- 2008-01-14 Delisted — NWMLS as Distributed by MLS Grid
- 2007-12-11 Relisted — NWMLS as Distributed by MLS Grid
- 2007-12-10 Contingent — NWMLS as Distributed by MLS Grid
- 2007-11-27 Price Changed $339,950 NWMLS as Distributed by MLS Grid
- 2007-08-31 Listed $341,750 NWMLS as Distributed by MLS Grid
- 2002-12-20 Sold (MLS) $220,053 NWMLS as Distributed by MLS Grid
- 2002-07-17 Listed $216,470 NWMLS as Distributed by MLS Grid
Property tax history
+5.0%/yrLatest (2025): $7,554 · +17.1% YoY. Source: county tax records.
Cash-flow waterfall
monthlySold comps — $/sqft
last 12 mo · ≤1 miLoading sold comps…