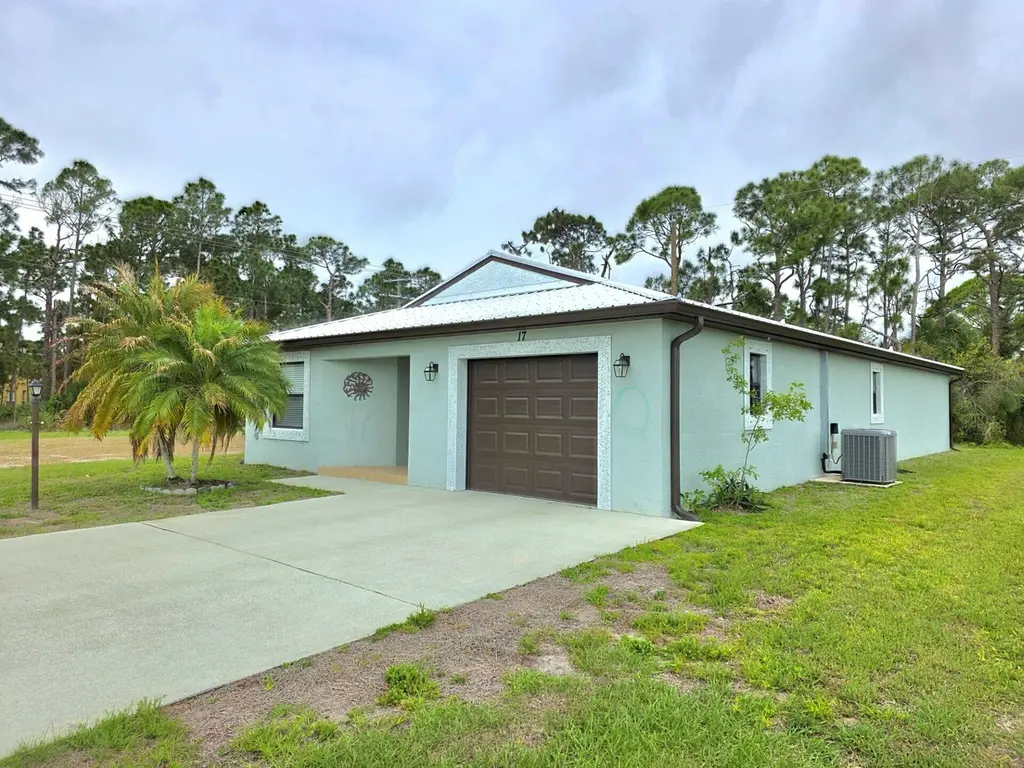
17 San Felipe · Lakewood Park, FL
Flood risk 1/10 · Minimal
- FEMA flood zone
- X (unshaded)
- Chance of flooding over 30 yrs
- 0.0%
- Est. flood insurance / yr
- $507 – $1,088
Fire risk 4/10 · Minor
- Est. fire insurance / yr
- $947 – $1,759
Heat risk 10/10 · Severe
- Hot days now (above 107°F)
- 7 days/yr
- Hot days in 30 yrs
- 26 days/yr
Wind risk 10/10 · Severe
- Chance of severe wind over 30 yrs
- 99.0%
Air-quality risk 1/10 · Minimal
- Unhealthy air days now
- 0 days/yr
- Unhealthy air days in 30 yrs
- 0 days/yr
Risk factors via First Street. Map © Google.
Why this score? — see what drove the C+ grade
The composite is a weighted blend of 9 inputs, each scored 0–100. Each bar is that input's sub-score; the figure is the points it added to the 100-point composite (weight × sub-score).
- Cash flow +23.0/30.0
- ARV discount +15.0/15.0
- DSCR +7.4/10.0
- 1% rule +5.4/10.0
- Schools +3.7/10.0
- Livability +3.2/5.0
- Rent growth +2.5/5.0
- Condition / age +2.5/5.0
- Appreciation +0.0/10.0
$225,000
🖨 Deal sheet 📄 Offer letter ✓ Due diligence
Listing remarks
Welcome to this Inviting Home with an Open Floor Plan, Large Entry Foyer, 29x20 Great Room with Cathedral Ceilings, an Updated 12x10 Kitchen with Granite Counter Tops, Stainless Steel Appliances & a 7 ft Breakfast Bar that is an added extension to to the Open Floor Plan. There is a Large Laundry Room off the Kitchen that leads into a Huge 20x14 one Car Garage with a Garage Door Opener and Window for added needed light. There is a 10x20 Three-Season Room that is Designed for Comfort & Entertaining with Family & Friends. Other Features to this Home include a Large 17x13 Primary Bedroom with a Spacious Ensuite to include a Walk-in Wardrobe Room & a Private Water Close
Key facts
- Large entry foyer
- Open floor plan
- Cathedral ceilings
Tags
Property features AI
Finance
- Other: Senior community; Pets allowed (possible restrictions)
- Financial info: Land lease in place ($350 monthly, expires 2026-07-31)
- HOA & community: Part of Spanish Lakes Country Club Village Homeowners Association; HOA fee $100 monthly; HOA includes maintenance of grounds, trash, and golf; Community amenities: clubhouse, pool, fitness center, golf course, pickleball courts, bocce ball, putting green, shuffleboard, billiard room, sauna, dog park, library, workshop area
Exterior
- Parking: Total of 5 parking spaces; Attached 1-car garage with garage door opener; Covered parking (1); Circular concrete driveway
- Utilities: Public water; Public sewer; 200+ amp electric service; Cable available; Electricity connected; Sewer connected; Water connected
- Home design: Single family residence; One story; Faces east; Resale property
- Construction: Stucco and CBS construction; Metal roof; Slab foundation; Built area approximately 2,074 (building); living area approximately 1,482
- Exterior features: Screened patio; Screened porch; Patio; Porch; Located on a cul-de-sac; Private road frontage; Asphalt road surface; Private maintained road; Not waterfront
Interior
- Kitchen: Dishwasher; Electric range; Microwave; Refrigerator; Electric water heater
- Bedrooms: 2 bedrooms on the main level
- Flooring: Carpet; Concrete; Ceramic tile; Laminate; Tile; Wood
- Bathrooms: 2 full bathrooms (main level)
- Heating & cooling: Central electric heating; Central air conditioning; Ceiling fans
- Interior features: Cathedral ceilings; Entrance foyer; High ceilings; Walk-in closets; Split bedroom layout; Decorative fireplace; Partially furnished
- Laundry & utility: Inside laundry room; Washer hookup; Electric dryer hookup
Neighborhood map
What this means for you Summary
Snapshot
- This is a 3-bed/2.0-bath single-family listed at $225k.
Deal economics
- At list price, monthly cash flow is $400 ($5k/yr) — positive.
- The deal already cash-flows at list — no discount required.
- Meets the 1% rule at list price ($2k rent vs $225k).
- Recommended offer: $212k (6.0% below list) — sets the bar for market timing.
- Cap rate 8.4% vs local median 5.7% in Lakewood Park — top-decile yield for the area; either an underpriced asset or a hidden risk that comps aren't pricing in. Stress-test before assuming the spread holds.
Location & tenants
- Location reads 63/100 on livability (#719 in FL) — a middle-class / working-renter tenant base. Strengths: cost of living A+, housing A+; Watch: schools F, amenities F, commute F.
- St. Lucie (urban): math 40% / reading 48% proficiency, ranked #51 of 73 in FL (top 70%) — families likely to look elsewhere, expect single-tenant / working-renter base with shorter leases.
- Market conditions: 292 active listings in the ZIP; 14 comparable units currently listed for rent nearby; rentals at typical pace (median 21d on market — plan ~3-4 weeks tenant-placement turnaround); 4,868 units permitted in St. Lucie County in 2024 (268 in 5+ unit buildings).
- This rent runs 44% of the median local income ($63k/yr) — at the standard rent-burdened threshold; future hikes will face affordability resistance.
Forward outlook
- Local home prices are declining (-3.0%/yr); year-one equity from $2k of loan paydown is wiped out by about $7k of value loss. Plan a longer hold.
- St. Lucie County population projected at +20% by 2050 — long-run rental-demand tailwind backs the buy-and-hold thesis.
Negotiation context
- It's been on market 76 days — a 6% lower offer ($212k) is reasonable based on typical stale-listing flexibility.
Risks & watch-outs
- Climate carrying-cost: severe wind risk, 99% chance of damaging wind over 30y; extreme-heat days projected 7→26/yr by 2055 (HVAC capex compounding) — expect insurance premiums to compound above CPI over the hold.
Questions for the listing agent
- It's been on market 76 days. Have you received any prior offers? Is the seller open to a 6% concession, seller financing, or rate buy-down credit?
- What does the HOA fee cover, when was the last increase, and are there any pending special assessments or reserve-fund shortfalls?
- Why hasn't it sold? Are there any deal-killer items the seller is aware of (foundation, flood, title, zoning, code violations)?
- Is there a deadline driving the sale (1031 exchange, divorce, estate, relocation)? That informs how much negotiation room exists.
- Schools are F-rated, which usually means shorter tenancies and higher turnover. Who's the typical renter profile here, and what's been the actual vacancy rate?
- What's the average days-on-market for RENTAL listings here right now (not sales)? A rising rental-DOM trend means longer vacancies and softer asking-rent achievability than the comps imply.
- What's the recent tenant-quality profile in this submarket — average credit score on applications, eviction rate, late-payment / NSF rate, and stable-employment percentage? A property-management company in the area should have these aggregated.
- How much new for-sale + rental construction is in the pipeline within 1–3 miles? Heavy new supply typically softens prices + rents 12–24 months out; constrained supply supports both.
Investment metrics
- 1% rule
- 1.04% ✓
- Cap rate
- 8.43%
- Cash-on-cash
- 7.62%
- DSCR
- 1.34
- GRM
- 8.0
CMA / ARV
- ARV (on-the-fly)
- $305,292
- Comps found
- 12
Show comp detail 12 sales within ~0.75 mi
| Address | Dist | Beds/Ba | Sqft | Sold | Price | $/sf | Match |
|---|---|---|---|---|---|---|---|
| 18 Montoya | 0.48mi | 2/2.0 (-1) | 1,446 (-2%) | 5mo | $289,000 | $200 | 65 |
| 16 Danzar | 0.54mi | 2/2.0 (-1) | 1,439 (-3%) | 4mo | $165,000 | $115 | 62 |
| 6505 Citrus Park Blvd | 0.54mi | 3/2.0 | 1,548 (+4%) | 9mo | $345,000 | $223 | 60 |
| 21 Lavilla Way | 0.63mi | 2/2.0 (-1) | 1,446 (-2%) | 7mo | $269,000 | $186 | 56 |
| 7205 Lakeland Blvd | 0.68mi | 3/2.0 | 1,377 (-7%) | 1mo | $315,000 | $229 | 56 |
| 6901 Deer Park Ave | 0.37mi | 4/2.0 (+1) | 1,673 (+13%) | 5mo | $345,000 | $206 | 52 |
| 7004 Bayard Rd #10 | 0.40mi | 4/2.0 (+1) | 1,673 (+13%) | 4mo | $334,990 | $200 | 52 |
| 7004 Bayard Rd | 0.40mi | 4/2.0 (+1) | 1,673 (+13%) | 4mo | $334,990 | $200 | 52 |
| 65 Lavilla Way | 0.53mi | 2/2.0 (-1) | 1,687 (+14%) | 6mo | $299,000 | $177 | 42 |
| 7506 Winter Garden Pkwy | 0.68mi | 3/2.0 | 1,324 (-11%) | 10mo | $290,000 | $219 | 42 |
| 6806 Lakeland Blvd | 0.57mi | 3/2.0 | 1,263 (-15%) | 10mo | $313,000 | $248 | 41 |
| 7205 Salerno Rd | 0.64mi | 4/2.0 (+1) | 1,673 (+13%) | 5mo | $347,990 | $208 | 40 |
Match score weights: distance 35% · size 25% · config 20% · recency 20%. Top-matched comps best support the ARV.
Projected returns pro-forma
-3.0% appreciation · 3.0% rent growth · sell at horizon
- IRR
- -4.7%
- Equity multiple
- 0.83×
- Total profit
- $-11,014
- Equity at exit
- $33,548
- IRR
- 5.0%
- Equity multiple
- 1.37×
- Total profit
- $23,093
- Equity at exit
- $19,454
Cash invested: $63,000 (down + closing). Projections, not guarantees.
Landlord ↔ Tenant lean methodology
- Overall (STATE)
- 87 Strongly Landlord-Friendly
- State Florida
- 87 Strongly Landlord-Friendly · R+3
- County
- — inherits STATE
- City
- — inherits STATE
ZIP-level market 34951
- Home prices YoY
- -23.6%
- Active inventory
- 292
- Price-to-rent
- 8.0×
Monthly cashflow live
- Estimated rent
- $2,340 high interval (Pro) →
- Mortgage (P&I)
- −$1,180
- Tax from tax record
- −$75 /mo · $904/yr
- Insurance
- −$94
- HOA
- −$100
- Vacancy / Maint / Mgmt
- −$491
- Net cashflow
- $400
Break-even live
UW: 25.0% down · 7.5% · 30yr · 1.5% tax · 5.0% vac · 8.0% maint · 8.0% mgmt
Financing live
Cash to close
- Down payment
- $56,250
- Closing costs
- $6,750
- Reserves months
- —
- Total cash needed
- —
Loan-product check · same deal, 3 products live
Conventional
25% down · 7.5% · 30yr
- Down + closing
- —
- Monthly P&I
- —
- Monthly cashflow
- —
- DSCR
- —
- Eligible?
- —
Personal DTI + credit; lowest rate.
DSCR
20% down · 8.5% · 30yr
- Down + closing
- —
- Monthly P&I
- —
- Monthly cashflow
- —
- DSCR
- —
- Eligible?
- —
No personal income docs; deal must DSCR.
Hard money
10% down · 12.0% · 12mo
- Down + closing
- —
- Monthly P&I
- —
- Monthly cashflow
- —
- DSCR
- —
- Eligible?
- —
Short-term bridge; refi at stabilization.
Rent comps 14 comps
| Address | Beds | Baths | Sqft | Rent | $/sqft | DOM | Units | Dist |
|---|---|---|---|---|---|---|---|---|
| 6906 Ocala Ave Fort Pierce, FL | 3.0 | 2.0 | 1175 | $1,955 | $1.66 | 14d | 1 | 0.33mi |
| 5642 Sunberry Cir Fort Pierce, FL | 3.0 | 2.0 | 1377 | $1,950 | $1.42 | 23d | 1 | 0.54mi |
| 5510 Shannon Dr Fort Pierce, FL | 3.0 | 2.0 | 1594 | $2,350 | $1.47 | 14d | 1 | 0.57mi |
| 7403 Winter Garden Pkwy Fort Pierce, FL | 3.0 | 2.0 | 1372 | $2,200 | $1.60 | 21d | 1 | 0.59mi |
| 7500 Pensacola Rd Fort Pierce, FL | 3.0 | 2.0 | 1125 | $2,150 | $1.91 | 14d | 1 | 0.73mi |
| 7704 Pacific Ave Fort Pierce, FL | 3.0 | 2.0 | 1719 | $2,500 | $1.45 | 14d | 1 | 0.83mi |
| 7503 Paso Robles Blvd Fort Pierce, FL | 3.0 | 2.0 | 1260 | $2,000 | $1.59 | 23d | 1 | 0.93mi |
| 2450 8th Ave SW Vero Beach, FL | 3.0 | 2.0 | 1388 | $2,100 | $1.51 | 21d | 1 | 1.09mi |
| 5234 Oakland Lake Cir Fort Pierce, FL | 3.0 | 2.0 | 1460 | $2,300 | $1.58 | 14d | 1 | 1.11mi |
| 6602 Palomar Pkwy Unit A Fort Pierce, FL | 3.0 | 1.0 | 1200 | $2,000 | $1.67 | 23d | 1 | 1.11mi |
| 5010 Killarney Ave Unit A Fort Pierce, FL | 2.0 | 1.0 | 1720 | $1,500 | $0.87 | 23d | 1 | 1.19mi |
| 985 23rd Pl SW Vero Beach, FL | 3.0 | 2.0 | 1176 | $2,200 | $1.87 | 21d | 1 | 1.22mi |
| 2320 Water Oaks Ln Unit 111 Vero Beach, FL | 3.0 | 2.0 | 1811 | $3,500 | $1.93 | 21d | 1 | 1.44mi |
| 8674 Pavia St Fort Pierce, FL | 4.0 | 2.0 | 1824 | $2,600 | $1.43 | 21d | 1 | 1.48mi |
HOA detail
- Monthly dues
- $100 · $1,200/yr
- Likely covers
- water
Listing history 17 events
-
2026-06-18days on market $225,000 Active 76 DOM
-
2026-06-17days on market $225,000 Active 75 DOM
-
2026-06-16days on market $225,000 Active 74 DOM
-
2026-06-15days on market $225,000 Active 73 DOM
-
2026-06-14days on market $225,000 Active 71 DOM
-
2026-06-13days on market $225,000 Active 70 DOM
-
2026-06-10days on market $225,000 Active 68 DOM
-
2026-06-09days on market $225,000 Active 67 DOM
-
2026-06-08days on market $225,000 Active 66 DOM
-
2026-06-07days on market $225,000 Active 65 DOM
-
2026-06-05days on market $225,000 Active 62 DOM
-
2026-06-03days on market $225,000 Active 61 DOM
-
2026-06-02days on market $225,000 Active 60 DOM
-
2026-06-01days on market $225,000 Active 59 DOM
-
2026-05-31days on market $225,000 Active 58 DOM
-
2026-05-30days on market $225,000 Active 57 DOM
-
2026-04-03$225,000 Active
ⓘ Source: listings_history table (triggers on properties + properties_extension) + one-shot
backfill from property_details.listing_events for pre-trigger history.
Tax reassessment forecast FL · Resets to sale price
- Current annual tax
- $904 · $75/mo
- Projected year-2 tax
- $1,868 · $156/mo
- Expected delta
- +$964/yr (+$80/mo · 106.7%)
ⓘ Screening estimate from a state-policy table — verify with the county assessor before closing.
Climate risk First Street
- Flood 1/10 Low FEMA zone X (unshaded) · 0% chance over 30 yrs
- Wildfire 4/10 Moderate
- Heat 10/10 Extreme 7 d/yr ≥107°F today · 26 d/yr by 30 yrs out
- Wind 10/10 Extreme 99% chance of damaging wind over 30 yrs
- Air quality 1/10 Low 0 unhealthy d/yr today · 0 by 30 yrs out
Nearby sold comps map
Loading sold comps map…
Walkable amenities ~0.75 mi
Loading nearby amenities…
Taxation est. · year 1
- Rental income
- $28,086
- − Mortgage interest
- −$12,603
- − Property taxes
- −$904
- − Insurance
- −$1,125
- − Repairs & maintenance
- −$2,247
- − Management
- −$2,247
- − HOA
- −$1,200
- − Depreciation
- −$6,545
- Taxable income
- $1,214
- Est. tax owed @ 24.0%
- −$291
- After-tax cash flow
- $4,508/yr
For passive investors: Depreciation is non-cash, so a rental often shows a tax loss while cash-flowing — sheltering income. Rental losses are passive: they offset passive income freely, and up to $25,000/yr can offset ordinary (W-2) income if you actively participate and your MAGI is under $100k (phasing out to $0 by $150k); unused losses carry forward. On sale, claimed depreciation is recaptured at up to 25%, and gains may owe capital-gains tax (a 1031 exchange can defer both). Figures are a year-1 estimate at your 24.0% rate — not tax advice; consult a CPA.
Schools (NCES district)
- District
- St. Lucie
- NCES district ID
- 1201770
- Math proficiency
- 40% ▼ -11.00%
- Reading proficiency
- 48% ▼ -4.00%
- Median HH income
- $44,737
- Composite
- 37.28/100
- National rank
- #4449
- State rank
- #51 of 73 in FL
Livability — Lakewood Park
- Score
- 63/100
- State rank
- #719
- US rank
- #15407
Category grades
Schools grade is shown separately in the Schools card above.
Census & demographics
- Census place
- Lakewood Park, FL
- County
- Saint Lucie County · 337,150 people
- Metro
- Port St. Lucie, FL
- Population (ZIP)
- 17,148
- Household income
- $63,122
- Rent vs Own
- Severe rent burden
- 140.0
Population outlook (St. Lucie County) Hauer SSP2
- Today (2025)
- 338,016 people
- By 2030
- 355,687 · +5.2%
- By 2040
- 385,521 · +14.1%
- By 2050
- 406,106 · +20.1%
- By 2075
- 441,054 · +30.5%
- By 2100
- 436,885 · +29.2%
Race, ethnicity, and origin ACS 2023
- Neighborhood character
- Predominantly White (74%)
- Race & ethnicity
- White 74% Black 13% Hispanic / Latino 8% Two or more races 7% Asian 2%
- Hispanic origin (detail)
- Mexican 2% Puerto Rican 2% Cuban 2%
- Common ancestry
- Romanian 3% Italian 2% Lithuanian 2%
- Foreign-born
- 10% · Canada, Jamaica, Vietnam
- Languages at home
- 88% English-only · Spanish 7% French/Haitian/Cajun 3% Vietnamese 1%
Political lean MEDSL · St. Lucie
- 2024 margin
- Lean R (+9.1) · D 45.1% · R 54.2%
- 2008→2024 swing
- -21.2pp toward R · 2008: 12.1pp · 2024: -9.1pp
- All cycles
- 2024: R+9.1 2020: R+1.6 2016: R+2.5 2012: D+7.9 2008: D+12.1
Not yet ingested
- Civics
- —
Market trends
- HPI YoY
- ▼ -106.06%
- Current HPI
- 343.1376
- Rent YoY
- —
- Metro
- Port St. Lucie, FL
- State GDP YoY
- ▲ 3.28%
- F500 in state
- 36
Industry mix (Fortune 500 HQ in FL)
| Industry | F500 HQs | Revenue |
|---|---|---|
| Industrial Technology | 2 | $29B |
|
||
| Insurance | 2 | $17B |
|
||
| Retail | 1 | $60B |
|
||
| Technology Distribution | 1 | $58B |
|
||
| Homebuilding | 1 | $35B |
|
||
| Technology Manufacturing | 1 | $35B |
|
||
Price history
1 event — show timeline
- 2026-04-03 Listed $225,000 Beaches MLS
Property tax history
+6.4%/yrLatest (2025): $904 · +5.1% YoY. Source: county tax records.
Cash-flow waterfall
monthlySold comps — $/sqft
last 12 mo · ≤1 miLoading sold comps…