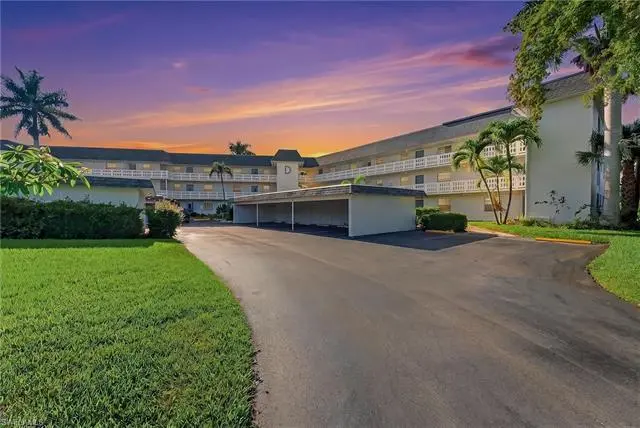
315 Saint Andrews Blvd Unit D5 · Lely, FL
Flood risk 8/10 · Major
- FEMA flood zone
- X (shaded)
- Chance of flooding over 30 yrs
- 0.97%
- Est. flood insurance / yr
- $507 – $1,088
Fire risk 4/10 · Minor
- Est. fire insurance / yr
- $947 – $1,759
Heat risk 9/10 · Severe
- Hot days now (above 107°F)
- 5 days/yr
- Hot days in 30 yrs
- 19 days/yr
Wind risk 10/10 · Severe
- Chance of severe wind over 30 yrs
- 99.0%
Air-quality risk 2/10 · Minimal
- Unhealthy air days now
- 2 days/yr
- Unhealthy air days in 30 yrs
- 2 days/yr
Risk factors via First Street. Map © Google.
Why this score? — see what drove the B grade
The composite is a weighted blend of 9 inputs, each scored 0–100. Each bar is that input's sub-score; the figure is the points it added to the 100-point composite (weight × sub-score).
- Cash flow +30.0/30.0
- 1% rule +10.0/10.0
- DSCR +10.0/10.0
- ARV discount +7.5/15.0
- Schools +5.0/10.0
- Rent growth +3.9/5.0
- Livability +3.3/5.0
- Condition / age +2.5/5.0
- Appreciation +0.0/10.0
$214,900
🖨 Deal sheet 📄 Offer letter ✓ Due diligence
Listing remarks
Discover one of the best values for a three-bedroom condo in Naples in the welcoming 55+ Vista Palms community, ideally located within the highly desirable Lely Country Club area between downtown Naples and Marco Island. This spacious ground-floor corner residence offers over 1,300 square feet of comfortable living space with peaceful golf course views, presenting an exciting opportunity to personalize, add value, or simply enjoy as-is as a full-time residence, seasonal retreat, or investment property. Thoughtfully maintained and offered unfurnished, the condo features a bright and functional layout with an expansive lanai that adds valuable flexible living space perfect for morning coffee,
Key facts
- In-residence laundry
- Covered parking
- Ground-floor access
Tags
Property features AI
Finance
- Other: Part of a 96-unit complex with 24 units per building; single unit per floor in this building
- HOA & community: Mandatory HOA (professional management); Quarterly condo fee; Condo fee $1,600 quarterly (total annual recurring fees $6,400); One-time fees $150; HOA maintenance covers insurance, irrigation water, lawn/land maintenance, legal/accounting, exterior pest control, trash removal, and water; Community amenities include billiards, community pool, extra storage, shuffleboard, sidewalks and streetlights; Non-gated community
Exterior
- Parking: Detached 1-space carport
- Utilities: Central water; Central sewer; Cable available
- Home design: Residential low-rise building (1–3 stories); Single-floor unit; Rear of property faces north; Part of Lely Golf Estates / Vista Palms development
- Construction: Concrete block construction; Built in 1977
- Exterior features: Stucco exterior; Built-up/flat roof; Jalousie windows; Zero lot line; Golf course view; Central irrigation; Architectural and deeded restrictions; no RVs
Interior
- Kitchen: Dishwasher; Self-cleaning oven; Refrigerator
- Bedrooms: 3 bedrooms (one on the first floor)
- Flooring: Laminate flooring
- Bathrooms: 2 full bathrooms; Master bathroom with shower (no tub)
- Heating & cooling: Central electric heat; Central electric air conditioning; Ceiling fans
- Interior features: Cable prewire; High-speed internet available; Smoke detectors; Split-bedroom floor plan; Common elevator
- Laundry & utility: Washer; Dryer
Neighborhood map
What this means for you Summary
Snapshot
- This is a 3-bed/2.0-bath condo listed at $215k.
Deal economics
- At list price, monthly cash flow is $2k ($18k/yr) — positive.
- The deal already cash-flows at list — no discount required.
- Meets the 1% rule at list price ($4k rent vs $215k).
- Recommended offer: $208k (3.0% below list) — sets the bar for market timing.
Location & tenants
- Location reads 66/100 on livability (#586 in FL) — a middle-class / working-renter tenant base. Strengths: crime A+, housing A+; Watch: schools D+, health & safety D, amenities F.
- Collier (suburban): math 60% / reading 56% proficiency, ranked #16 of 73 in FL (top 22%) — acceptable for families but not a draw, mixed tenant base, ~2y average lease.
- Market conditions: Rents rising fast (+5.6%/yr); 597 active listings in the ZIP; 40 comparable units currently listed for rent nearby; rentals at typical pace (median 24d on market — plan ~3-4 weeks tenant-placement turnaround); solid renter incomes; 3,520 units permitted in Collier County in 2024 (959 in 5+ unit buildings).
- At $4,490/mo this rent would consume 66% of the median local household income ($82k/yr) (locally 954% of renters already pay >50% of income on rent) — very limited rent-growth headroom before tenants either downsize or default.
Forward outlook
- Local home prices are declining (-3.0%/yr); year-one equity from $1k of loan paydown is wiped out by about $6k of value loss. Plan a longer hold.
- Collier County population projected at +30% by 2050 — long-run rental-demand tailwind backs the buy-and-hold thesis.
- At projected returns (-3.0% appreciation + 5.6% rent growth), your $60k cash investment doubles in ~4 years — after that, you're playing with house money.
Negotiation context
- It's been on market 37 days — a 3% lower offer ($208k) is reasonable based on typical stale-listing flexibility.
- 8 sale attempts since 3y ago with the ask held roughly flat each time — persistent listings suggest the price (not the market) is what's stuck; bring a comps-based counter.
- Current owner paid $171k; 26% above their basis — modest negotiation headroom, anchor on the comps not their cost.
Risks & watch-outs
- Watch-outs: flood insurance adds $66/mo.
- Climate carrying-cost: severe flood risk; severe wind risk, 99% chance of damaging wind over 30y; extreme-heat days projected 5→19/yr by 2055 (HVAC capex compounding) — expect insurance premiums to compound above CPI over the hold.
Questions for the listing agent
- It's been on market 37 days. Have you received any prior offers? Is the seller open to a 3% concession, seller financing, or rate buy-down credit?
- Built in 1977 — when were the roof, HVAC, electrical panel, plumbing, and water heater last replaced?
- What's the actual annual flood-insurance premium (NFIP or private), and is the property in a SFHA with mandatory coverage?
- What does the HOA fee cover, when was the last increase, and are there any pending special assessments or reserve-fund shortfalls?
- Any open or pending special assessments — roof, HVAC, plumbing, elevator, façade? What's the per-unit balance and payoff schedule, and is the seller paying it off at close or rolling it to the buyer?
- Is there a deadline driving the sale (1031 exchange, divorce, estate, relocation)? That informs how much negotiation room exists.
- Schools are D-rated, which usually means shorter tenancies and higher turnover. Who's the typical renter profile here, and what's been the actual vacancy rate?
- What's the average days-on-market for RENTAL listings here right now (not sales)? A rising rental-DOM trend means longer vacancies and softer asking-rent achievability than the comps imply.
- What's the recent tenant-quality profile in this submarket — average credit score on applications, eviction rate, late-payment / NSF rate, and stable-employment percentage? A property-management company in the area should have these aggregated.
- How much new apartment / multifamily construction is in the pipeline within 1–3 miles? Heavy new supply (>2% of stock underway) typically softens rents 12–24 months out; light construction supports rent growth.
Investment metrics
- 1% rule
- 2.09% ✓
- Cap rate
- 15.13%
- Cash-on-cash
- 31.57%
- DSCR
- 2.40
- GRM
- 4.0
CMA / ARV
No comps found within radius.
Projected returns pro-forma
-3.0% appreciation · 5.59% rent growth · sell at horizon
- IRR
- 28.4%
- Equity multiple
- 2.23×
- Total profit
- $74,181
- Equity at exit
- $32,042
- IRR
- 37.6%
- Equity multiple
- 5.03×
- Total profit
- $242,557
- Equity at exit
- $18,581
Cash invested: $60,172 (down + closing). Projections, not guarantees.
Landlord ↔ Tenant lean methodology
- Overall (STATE)
- 87 Strongly Landlord-Friendly
- State Florida
- 87 Strongly Landlord-Friendly · R+3
- County
- — inherits STATE
- City
- — inherits STATE
ZIP-level market 34113
- Rents YoY
- 5.6%
- Active inventory
- 597
- Price-to-rent
- 4.0×
Monthly cashflow live
- Estimated rent
- $4,490 high interval (Pro) →
- Mortgage (P&I)
- −$1,127
- Tax from tax record
- −$214 /mo · $2,570/yr
- Insurance
- −$90
- Flood insurance flood zone
- −$66 /mo · $798/yr
- HOA
- −$533
- Vacancy / Maint / Mgmt
- −$943
- Net cashflow
- $1,517
Break-even live
UW: 25.0% down · 7.5% · 30yr · 1.5% tax · 5.0% vac · 8.0% maint · 8.0% mgmt
Financing live
Cash to close
- Down payment
- $53,725
- Closing costs
- $6,447
- Reserves months
- —
- Total cash needed
- —
Loan-product check · same deal, 3 products live
Conventional
25% down · 7.5% · 30yr
- Down + closing
- —
- Monthly P&I
- —
- Monthly cashflow
- —
- DSCR
- —
- Eligible?
- —
Personal DTI + credit; lowest rate.
DSCR
20% down · 8.5% · 30yr
- Down + closing
- —
- Monthly P&I
- —
- Monthly cashflow
- —
- DSCR
- —
- Eligible?
- —
No personal income docs; deal must DSCR.
Hard money
10% down · 12.0% · 12mo
- Down + closing
- —
- Monthly P&I
- —
- Monthly cashflow
- —
- DSCR
- —
- Eligible?
- —
Short-term bridge; refi at stabilization.
Rent comps 40 comps
| Address | Beds | Baths | Sqft | Rent | $/sqft | DOM | Units | Dist |
|---|---|---|---|---|---|---|---|---|
| 315 Saint Andrews Blvd Unit A25 Naples, FL | 2.0 | 2.0 | 1126 | $1,530 | $1.36 | 23d | 1 | 0.03mi |
| 452 Bristle Cone Ln #27 Naples, FL | 2.0 | 2.0 | 1129 | $2,000 | $1.77 | 23d | 1 | 0.13mi |
| 326 Bradstrom Cir Unit 204F Naples, FL | 3.0 | 2.0 | 1200 | $3,500 | $2.92 | 23d | 1 | 0.14mi |
| 326 Bradstrom Cir Unit 103F Naples, FL | 2.0 | 2.0 | 1113 | $1,800 | $1.62 | 23d | 1 | 0.14mi |
| 255 Pine Valley Cir Naples, FL | 3.0 | 1.5 | 1574 | $3,500 | $2.22 | 23d | 1 | 0.15mi |
| 332 Bradstrom Cir #201 Naples, FL | 2.0 | 2.0 | 1257 | $2,200 | $1.75 | 23d | 1 | 0.19mi |
| 5293 Dixie Dr Unit 1546039P Naples, FL | 2.0 | 2.0 | 1130 | $1,561 | $1.38 | 14d | 1 | 0.24mi |
| 248 Pebble Beach Cir Unit G201 Naples, FL | 2.0 | 2.0 | 1163 | $2,300 | $1.98 | 23d | 1 | 0.32mi |
| 520 Augusta Blvd Unit B204 Naples, FL | 3.0 | 2.0 | 1294 | $2,200 | $1.70 | 23d | 1 | 0.39mi |
| 494 Saint Andrews Blvd Naples, FL | 3.0 | 2.0 | 1700 | $2,800 | $1.65 | 23d | 1 | 0.40mi |
| 265 Deerwood Cir Naples, FL | 2.0 | 2.0 | 1179 | $5,000 | $4.24 | 23d | 1 | 0.44mi |
| 413 Augusta Blvd #302 Naples, FL | 2.0 | 2.0 | 1390 | $5,500 | $3.96 | 21d | 1 | 0.49mi |
| 213 Bay Meadows Dr Naples, FL | 3.0 | 2.0 | 1650 | $5,500 | $3.33 | 23d | 1 | 0.51mi |
| 9512 Napoli Ln Unit 101 Naples, FL | 3.0 | 2.0 | 1741 | $10,000 | $5.74 | 14d | 1 | 0.54mi |
| 555 Augusta Blvd Unit 3-1 Naples, FL | 2.0 | 2.0 | 1249 | $4,200 | $3.36 | 23d | 1 | 0.57mi |
| 240 Pebble Beach Blvd #702 Naples, FL | 2.0 | 2.0 | 1090 | $4,000 | $3.67 | 23d | 1 | 0.58mi |
| 575 Augusta Blvd Naples, FL | 3.0 | 2.0 | 1500 | $2,100 | $1.40 | 23d | 1 | 0.61mi |
| 9115 Napoli Ct #101 Naples, FL | 3.0 | 2.0 | 1741 | $9,500 | $5.46 | 23d | 1 | 0.61mi |
| 6984 Saona Ct Naples, FL | 2.0 | 2.0 | 1472 | $7,500 | $5.10 | 23d | 1 | 0.62mi |
| 190 Pebble Beach Blvd #301 Naples, FL | 2.0 | 2.0 | 954 | $1,700 | $1.78 | 23d | 1 | 0.62mi |
| 7124 Saona Ct Naples, FL | 2.0 | 2.0 | 1387 | $8,000 | $5.77 | 23d | 1 | 0.63mi |
| 640 Augusta Blvd Naples, FL | 2.0 | 2.0 | 1634 | $2,700 | $1.65 | 23d | 1 | 0.63mi |
| 9250 Veneto Pl Naples, FL | 2.0 | 2.5 | 1854 | $6,000 | $3.24 | 23d | 1 | 0.64mi |
| 7162 Saona Ct Naples, FL | 2.0 | 2.0 | 1482 | $9,000 | $6.07 | 23d | 1 | 0.66mi |
| 7110 Cayo Coco Ln Naples, FL | 2.0 | 2.0 | 1387 | $9,250 | $6.67 | 23d | 1 | 0.66mi |
| 605 Augusta Blvd #14 Naples, FL | 2.0 | 2.0 | 1125 | $4,000 | $3.56 | 23d | 1 | 0.67mi |
| 605 Augusta Blvd #4 Naples, FL | 2.0 | 2.0 | 1125 | $3,950 | $3.51 | 14d | 1 | 0.67mi |
| 7197 Saona Ct Unit 1545994P Naples, FL | 2.0 | 2.0 | 1291 | $4,152 | $3.22 | 14d | 1 | 0.67mi |
| 232 Pebble Beach Blvd #104 Naples, FL | 3.0 | 2.0 | 1298 | $1,975 | $1.52 | 23d | 1 | 0.67mi |
| 7142 Cayo Coco Ln Naples, FL | 2.0 | 2.0 | 1490 | $10,000 | $6.71 | 23d | 1 | 0.69mi |
| 7138 Cayo Coco Ln Naples, FL | 2.0 | 2.0 | 1205 | $6,500 | $5.39 | 23d | 1 | 0.69mi |
| 7213 Saona Ct Naples, FL | 2.0 | 2.0 | 1308 | $7,500 | $5.73 | 23d | 1 | 0.69mi |
| 701 Augusta Blvd Unit 701-8 Naples, FL | 2.0 | 2.0 | 1250 | $4,800 | $3.84 | 14d | 1 | 0.69mi |
| 705 Augusta Blvd Unit 705-5 Naples, FL | 2.0 | 2.0 | 1125 | $2,000 | $1.78 | 14d | 1 | 0.72mi |
| 5651 Rattlesnake Hammock Rd Unit C-108 Naples, FL | 2.0 | 2.0 | 1054 | $1,800 | $1.71 | 23d | 1 | 0.72mi |
| 7242 Saona Ct Naples, FL | 2.0 | 2.0 | 1204 | $7,750 | $6.44 | 23d | 1 | 0.73mi |
| 5635 Rattlesnake Hammock Rd Apt 203D Naples, FL | 2.0 | 2.0 | 1054 | $1,700 | $1.61 | 21d | 1 | 0.73mi |
| 6875 Saona Ct Naples, FL | 2.0 | 2.0 | 1565 | $8,000 | $5.11 | 23d | 1 | 0.74mi |
| 5535 Rattlesnake Hammock Rd #302 Naples, FL | 2.0 | 2.0 | 1205 | $2,800 | $2.32 | 23d | 1 | 0.74mi |
| 709 Augusta Blvd Unit 709-5 Naples, FL | 3.0 | 2.0 | 1480 | $4,000 | $2.70 | 14d | 1 | 0.74mi |
HOA detail condo
- Monthly dues
- $533 · $6,396/yr
- Assessments
- None detected in remarks — confirm with the listing agent.
Listing history 42 events
-
2026-06-18days on market $214,900 Active 37 DOM
-
2026-06-17days on market $214,900 Active 36 DOM
-
2026-06-16days on market $214,900 Active 35 DOM
-
2026-06-15days on market $214,900 Active 34 DOM
-
2026-06-14days on market $214,900 Active 32 DOM
-
2026-06-10days on market $214,900 Active 29 DOM
-
2026-06-09days on market $214,900 Active 28 DOM
-
2026-06-08days on market $214,900 Active 27 DOM
-
2026-06-07days on market $214,900 Active 26 DOM
-
2026-06-03days on market $214,900 Active 22 DOM
-
2026-06-02days on market $214,900 Active 21 DOM
-
2026-06-01days on market $214,900 Active 20 DOM
-
2026-05-31days on market $214,900 Active 19 DOM
-
2026-05-30days on market $214,900 Active 18 DOM
-
2026-05-12$214,900 Active
-
2026-05-05historical
-
2026-04-23price $214,900
-
2026-04-23price $214,900
-
2026-04-09$219,900 Active
-
2026-04-08price $219,900
-
2026-02-27$225,000 Active
-
2026-02-23historical
-
2026-01-30status Active
-
2026-01-29historical
-
2025-12-19price $224,000
-
2025-10-17$229,000 Active
-
2025-10-17historical
-
2025-08-22price $229,000
-
2025-05-01price $234,900
-
2025-03-28$264,900 Active
-
2024-08-29soldstatus $171,000 Sold
-
2024-08-08status Pending With Contingencies
-
2024-07-05price $199,900
-
2024-06-11price $214,900
-
2024-05-10price $221,900
-
2024-04-01$231,800 Active
-
2024-03-28historical
-
2024-02-14price $231,800
-
2023-12-11price $244,000
-
2023-10-31$298,000 Active
-
1996-11-12soldstatus $78,000
-
1988-08-01soldstatus $73,400
ⓘ Source: listings_history table (triggers on properties + properties_extension) + one-shot
backfill from property_details.listing_events for pre-trigger history.
Tax reassessment forecast FL · Resets to sale price
- Current annual tax
- $2,570 · $214/mo
- Projected year-2 tax
- $2,570 · $214/mo
- Expected delta
- $0/yr ($0/mo · 0.0%)
ⓘ Screening estimate from a state-policy table — verify with the county assessor before closing.
Climate risk First Street
- Flood 8/10 Severe FEMA zone X (shaded) · 97% chance over 30 yrs
- Wildfire 4/10 Moderate
- Heat 9/10 Extreme 5 d/yr ≥107°F today · 19 d/yr by 30 yrs out
- Wind 10/10 Extreme 99% chance of damaging wind over 30 yrs
- Air quality 2/10 Low 2 unhealthy d/yr today · 2 by 30 yrs out
Nearby sold comps map
Loading sold comps map…
Walkable amenities ~0.75 mi
Loading nearby amenities…
Taxation est. · year 1
- Rental income
- $53,876
- − Mortgage interest
- −$12,038
- − Property taxes
- −$2,570
- − Insurance
- −$1,872
- − Repairs & maintenance
- −$4,310
- − Management
- −$4,310
- − HOA
- −$6,396
- − Depreciation
- −$6,252
- Taxable income
- $16,128
- Est. tax owed @ 24.0%
- −$3,871
- After-tax cash flow
- $14,330/yr
For passive investors: Depreciation is non-cash, so a rental often shows a tax loss while cash-flowing — sheltering income. Rental losses are passive: they offset passive income freely, and up to $25,000/yr can offset ordinary (W-2) income if you actively participate and your MAGI is under $100k (phasing out to $0 by $150k); unused losses carry forward. On sale, claimed depreciation is recaptured at up to 25%, and gains may owe capital-gains tax (a 1031 exchange can defer both). Figures are a year-1 estimate at your 24.0% rate — not tax advice; consult a CPA.
Schools (NCES district)
- District
- Collier
- NCES district ID
- 1200330
- Math proficiency
- 60% ▼ -4.00%
- Reading proficiency
- 56% ▼ -2.00%
- Median HH income
- $58,275
- Composite
- 50.23/100
- National rank
- #1892
- State rank
- #16 of 73 in FL
Livability — Lely
- Score
- 66/100
- State rank
- #586
- US rank
- #11224
Category grades
Schools grade is shown separately in the Schools card above.
Census & demographics
- Census place
- Lely, FL
- County
- Collier County · 396,295 people
- Metro
- Naples-Marco Island, FL
- Population (ZIP)
- 26,056
- Household income
- $81,674
- Rent vs Own
- Severe rent burden
- 954.0
Population outlook (Collier County) Hauer SSP2
- Today (2025)
- 420,858 people
- By 2030
- 450,054 · +6.9%
- By 2040
- 502,232 · +19.3%
- By 2050
- 544,932 · +29.5%
- By 2075
- 627,203 · +49.0%
- By 2100
- 659,015 · +56.6%
Race, ethnicity, and origin ACS 2023
- Neighborhood character
- Diverse neighborhood (Simpson 0.59)
- Race & ethnicity
- White 56% Hispanic / Latino 28% Black 12% Two or more races 11% Asian 2%
- Hispanic origin (detail)
- Mexican 17% Puerto Rican 3% Cuban 2%
- Common ancestry
- Hispanic 10% Romanian 3% Lithuanian 2%
- Foreign-born
- 26% · Canada, Jamaica, Vietnam
- Languages at home
- 63% English-only · Spanish 24% French/Haitian/Cajun 9% Other Indo-European 2%
Political lean MEDSL · Collier
- 2024 margin
- Solid R (+33.1) · D 33.1% · R 66.2%
- 2008→2024 swing
- -10.6pp toward R · 2008: -22.5pp · 2024: -33.1pp
- All cycles
- 2024: R+33.1 2020: R+24.7 2016: R+26.0 2012: R+30.1 2008: R+22.5
Not yet ingested
- Civics
- —
Market trends
- HPI YoY
- ▼ -194.86%
- Current HPI
- 279.4232
- Rent YoY
- ▲ 5.59%
- Metro
- Naples-Marco Island, FL
- State GDP YoY
- ▲ 3.28%
- F500 in state
- 36
Industry mix (Fortune 500 HQ in FL)
| Industry | F500 HQs | Revenue |
|---|---|---|
| Industrial Technology | 2 | $29B |
|
||
| Insurance | 2 | $17B |
|
||
| Retail | 1 | $60B |
|
||
| Technology Distribution | 1 | $58B |
|
||
| Homebuilding | 1 | $35B |
|
||
| Technology Manufacturing | 1 | $35B |
|
||
Price history
+192.8% since first listed28 events — show timeline
- 2026-05-12 Listed $214,900 NAPLESMLS
- 2026-05-05 Listing Removed — NAPLESMLS
- 2026-04-23 Price Changed $214,900 NAPLESMLS
- 2026-04-23 Price Changed $214,900 MIML
- 2026-04-09 Listed $219,900 MIML
- 2026-04-08 Price Changed $219,900 NAPLESMLS
- 2026-02-27 Listed $225,000 NAPLESMLS
- 2026-02-23 Listing Removed — NAPLESMLS
- 2026-01-30 Relisted — NAPLESMLS
- 2026-01-29 Listing Removed — NAPLESMLS
- 2025-12-19 Price Changed $224,000 NAPLESMLS
- 2025-10-17 Listing Removed — NAPLESMLS
- 2025-10-17 Listed $229,000 NAPLESMLS
- 2025-08-22 Price Changed $229,000 NAPLESMLS
- 2025-05-01 Price Changed $234,900 NAPLESMLS
- 2025-03-28 Listed $264,900 NAPLESMLS
- 2024-08-29 Sold (MLS) $171,000 NAPLESMLS
- 2024-08-08 Pending — NAPLESMLS
- 2024-07-05 Price Changed $199,900 NAPLESMLS
- 2024-06-11 Price Changed $214,900 NAPLESMLS
- 2024-05-10 Price Changed $221,900 NAPLESMLS
- 2024-04-01 Listed $231,800 NAPLESMLS
- 2024-03-28 Listing Removed — NAPLESMLS
- 2024-02-14 Price Changed $231,800 NAPLESMLS
- 2023-12-11 Price Changed $244,000 NAPLESMLS
- 2023-10-31 Listed $298,000 NAPLESMLS
- 1996-11-12 Sold (Public Records) $78,000 Public Records
- 1988-08-01 Sold (Public Records) $73,400 Public Records
Property tax history
+14.8%/yrLatest (2025): $2,570 · +3.6% YoY. Source: county tax records.
Cash-flow waterfall
monthlySold comps — $/sqft
last 12 mo · ≤1 miLoading sold comps…