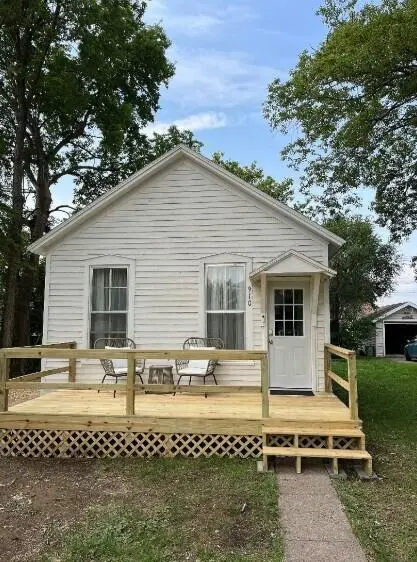
910 E 6th Ave · Mitchell, SD
Flood risk 1/10 · Minimal
- FEMA flood zone
- X (unshaded)
- Chance of flooding over 30 yrs
- 0.0%
- Est. flood insurance / yr
- $507 – $1,088
Fire risk 4/10 · Minor
- Est. fire insurance / yr
- $1,342 – $2,492
Heat risk 3/10 · Minor
- Hot days now (above 101°F)
- 7 days/yr
- Hot days in 30 yrs
- 14 days/yr
Wind risk 2/10 · Minimal
- Chance of severe wind over 30 yrs
- —
Air-quality risk 2/10 · Minimal
- Unhealthy air days now
- 1 days/yr
- Unhealthy air days in 30 yrs
- 1 days/yr
Risk factors via First Street. Map © Google.
Why this score? — see what drove the C grade
The composite is a weighted blend of 9 inputs, each scored 0–100. Each bar is that input's sub-score; the figure is the points it added to the 100-point composite (weight × sub-score).
- Cash flow +19.3/30.0
- ARV discount +13.8/15.0
- DSCR +6.1/10.0
- Schools +4.9/10.0
- 1% rule +4.3/10.0
- Livability +3.9/5.0
- Rent growth +2.5/5.0
- Condition / age +2.5/5.0
- Appreciation +0.0/10.0
$98,000
🖨 Deal sheet 📄 Offer letter ✓ Due diligence
Listing remarks MLS
1 bedroom with new bathroom. Put in the updates and this could make a great rental. Selling the home in AS-IS condition.
Key facts
- 6,970 sq ft lot
- Built 1920
- Listed 14 days
Property features AI
Exterior
- Utilities: Public water; Public sewer
- Home design: Single-family residential property
- Exterior features: Lot approximately 0.16 acres
Interior
- Bathrooms: 1 full bathroom
- Heating & cooling: Central air conditioning; Natural gas heating
- Interior features: Crawl space basement
Neighborhood map
What this means for you Summary
Snapshot
- This is a 2-bed/1.0-bath single-family listed at $98k.
Deal economics
- At list price, monthly cash flow is $108 ($1k/yr) — positive.
- The deal already cash-flows at list — no discount required.
- To meet the 1% rule (rent ≥ 1% of price), the offer needs to be $91k (7.5% below list).
- Recommended offer: $91k (7.5% below list) — sets the bar for 1% rule.
- Cap rate 7.6% vs local median 2.5% in Mitchell — top-decile yield for the area; either an underpriced asset or a hidden risk that comps aren't pricing in. Stress-test before assuming the spread holds.
Location & tenants
- Location reads 77/100 on livability (#18 in SD, #2,969 nationally) — a middle-class / working-renter tenant base. Strengths: cost of living A+, housing A+, health & safety A+; Watch: schools C-, employment C-, amenities D+.
- Mitchell School District 17-2 (town): math 55% / reading 62% proficiency, ranked #11 of 59 in SD (top 19%) — acceptable for families but not a draw, mixed tenant base, ~2y average lease.
- Market conditions: 135 active listings in the ZIP; 20 comparable units currently listed for rent nearby; rentals lingering (median 44d on market — plan ~5-8 weeks vacancy on turnover, expect pricing pressure); 100% of comp listings sitting > 30 days — soft ceiling on asking rent; 48 units permitted in Davison County in 2024 (0 in 5+ unit buildings).
- This rent is only 17% of the median local income ($66k/yr) — well below the 30% rent-burden line; pricing power to push rent on renewal without tenant pushback.
Forward outlook
- Local home prices are declining (-3.0%/yr); year-one equity from $678 of loan paydown is wiped out by about $3k of value loss. Plan a longer hold.
- Davison County population projected at +7% by 2050 — modest demand growth; plan on rents tracking national, not racing it.
Negotiation context
- It's been on market 15 days — a 2% lower offer ($97k) is reasonable based on typical stale-listing flexibility.
- 2 sale attempts since 3y ago with the ask held roughly flat each time — persistent listings suggest the price (not the market) is what's stuck; bring a comps-based counter.
- Current owner paid $40k; list at $98k implies a 145% gain — meaningful room to come down on a strong offer.
Risks & watch-outs
- Watch-outs: built in 1920 — expect roof / HVAC / electrical / plumbing capex.
Questions for the listing agent
- Built in 1920 — when were the roof, HVAC, electrical panel, plumbing, and water heater last replaced?
- Is there a deadline driving the sale (1031 exchange, divorce, estate, relocation)? That informs how much negotiation room exists.
- What's the average days-on-market for RENTAL listings here right now (not sales)? A rising rental-DOM trend means longer vacancies and softer asking-rent achievability than the comps imply.
- What's the recent tenant-quality profile in this submarket — average credit score on applications, eviction rate, late-payment / NSF rate, and stable-employment percentage? A property-management company in the area should have these aggregated.
- How much new for-sale + rental construction is in the pipeline within 1–3 miles? Heavy new supply typically softens prices + rents 12–24 months out; constrained supply supports both.
Investment metrics
- 1% rule
- 0.93% ✗
- Cap rate
- 7.62%
- Cash-on-cash
- 4.74%
- DSCR
- 1.21
- GRM
- 9.0
CMA / ARV
- ARV (on-the-fly)
- $114,048
- Comps found
- 8
Show comp detail 8 sales within ~0.75 mi
| Address | Dist | Beds/Ba | Sqft | Sold | Price | $/sf | Match |
|---|---|---|---|---|---|---|---|
| 1100 E 7th Ave | 0.20mi | 2/2.0 | 840 (+6%) | 6mo | $171,000 | $204 | 71 |
| 800 E Hanson Ave | 0.43mi | 2/1.0 | 816 (+3%) | 6mo | $196,000 | $240 | 70 |
| 1024 E 7th Ave | 0.16mi | 2/1.0 | 836 (+6%) | 18mo | $95,000 | $114 | 68 |
| 921 E 6th Ave | 0.04mi | 2/2.0 | 904 (+14%) | 3mo | $119,000 | $132 | 68 |
| 216 E 10th Ave | 0.56mi | 1/1.5 (-1) | 731 (-8%) | 1mo | $87,000 | $119 | 54 |
| 1101 E 4th Ave | 0.25mi | 3/1.0 (+1) | 886 (+12%) | 18mo | $117,525 | $133 | 49 |
| 931 E Hanson Ave | 0.45mi | 2/1.0 | 870 (+10%) | 20mo | $125,000 | $144 | 46 |
| 613 E 1st Ave | 0.43mi | 2/1.0 | 904 (+14%) | 14mo | $175,000 | $194 | 44 |
Match score weights: distance 35% · size 25% · config 20% · recency 20%. Top-matched comps best support the ARV.
Projected returns pro-forma
-3.0% appreciation · 3.0% rent growth · sell at horizon
- IRR
- -9.0%
- Equity multiple
- 0.67×
- Total profit
- $-9,012
- Equity at exit
- $14,612
- IRR
- 0.5%
- Equity multiple
- 1.03×
- Total profit
- $916
- Equity at exit
- $8,473
Cash invested: $27,440 (down + closing). Projections, not guarantees.
Landlord ↔ Tenant lean methodology
- Overall (STATE)
- 83 Strongly Landlord-Friendly
- State South Dakota
- 83 Strongly Landlord-Friendly · R+16
- County
- — inherits STATE
- City
- — inherits STATE
ZIP-level market 57301
- Active inventory
- 135
- Price-to-rent
- 9.0×
Monthly cashflow live
- Estimated rent
- $907 high interval (Pro) →
- Mortgage (P&I)
- −$514
- Tax from tax record
- −$53 /mo · $638/yr
- Insurance
- −$41
- HOA
- −$0
- Vacancy / Maint / Mgmt
- −$190
- Net cashflow
- $108
Break-even live
UW: 25.0% down · 7.5% · 30yr · 1.5% tax · 5.0% vac · 8.0% maint · 8.0% mgmt
Financing live
Cash to close
- Down payment
- $24,500
- Closing costs
- $2,940
- Reserves months
- —
- Total cash needed
- —
Loan-product check · same deal, 3 products live
Conventional
25% down · 7.5% · 30yr
- Down + closing
- —
- Monthly P&I
- —
- Monthly cashflow
- —
- DSCR
- —
- Eligible?
- —
Personal DTI + credit; lowest rate.
DSCR
20% down · 8.5% · 30yr
- Down + closing
- —
- Monthly P&I
- —
- Monthly cashflow
- —
- DSCR
- —
- Eligible?
- —
No personal income docs; deal must DSCR.
Hard money
10% down · 12.0% · 12mo
- Down + closing
- —
- Monthly P&I
- —
- Monthly cashflow
- —
- DSCR
- —
- Eligible?
- —
Short-term bridge; refi at stabilization.
Rent comps 20 comps
| Address | Beds | Baths | Sqft | Rent | $/sqft | DOM | Units | Dist |
|---|---|---|---|---|---|---|---|---|
| 821 E 7th Ave Unit 2 (up) Mitchell, SD | 2.0 | 1.0 | 925 | $750 | $0.81 | 43d | 1 | 0.04mi |
| 910 N Winsor St Mitchell, SD | 3.0 | 1.0 | 996 | $1,300 | $1.31 | 43d | 1 | 0.22mi |
| 1020 E 1st Ave Mitchell, SD | 2.0 | 1.0 | 864 | $975 | $1.13 | 43d | 1 | 0.39mi |
| 623 E Hanson Ave Mitchell, SD | 3.0 | 1.0 | 1023 | $1,200 | $1.17 | 43d | 1 | 0.49mi |
| 400 E 12th Ave Unit 1 Mitchell, SD | 2.0 | 1.0 | 900 | $1,000 | $1.11 | 43d | 1 | 0.55mi |
| 123 W 6th Ave Unit 305 Mitchell, SD | 1.0 | 1.0 | 600 | $750 | $1.25 | 43d | 1 | 0.64mi |
| 223 N Main St Unit 208 Mitchell, SD | 1.0 | 1.0 | 550 | $850 | $1.55 | 43d | 1 | 0.65mi |
| 122 W 9th Ave Mitchell, SD | 1.0 | 1.0 | 550 | $650 | $1.18 | 43d | 1 | 0.67mi |
| 122 W 9th Ave Unit 122 1/2 Mitchell, SD | 3.0 | 1.0 | 965 | $1,000 | $1.04 | 43d | 1 | 0.67mi |
| 200 W 4th Ave Unit 3 Mitchell, SD | 2.0 | 1.0 | 1085 | $725 | $0.67 | 43d | 1 | 0.68mi |
| 101 S Main St Unit 201 Mitchell, SD | 2.0 | 1.0 | 675 | $800 | $1.19 | 43d | 1 | 0.71mi |
| 101 S Main St Apt 203 Mitchell, SD | 1.0 | 1.0 | 525 | $700 | $1.33 | 43d | 1 | 0.71mi |
| 1803 E 1st Ave Mitchell, SD | 3.0 | 1.0 | 960 | $1,100 | $1.15 | 43d | 1 | 0.80mi |
| 501 W 3rd Ave Unit 5 Mitchell, SD | 3.0 | 1.0 | 750 | $900 | $1.20 | 43d | 1 | 0.91mi |
| 408 S Duff St Apt A Mitchell, SD | 2.0 | 1.0 | 750 | $775 | $1.03 | 43d | 1 | 0.92mi |
| 1701 N Main St Apt 9A Mitchell, SD | 2.0 | 1.0 | 711 | $895 | $1.26 | 43d | 1 | 1.01mi |
| 828 W 2nd Ave Mitchell, SD | 2.0 | 2.0 | 648 | $850 | $1.31 | 43d | 1 | 1.18mi |
| 915 W 4th Ave Unit 2 Mitchell, SD | 2.0 | 1.0 | 700 | $750 | $1.07 | 43d | 1 | 1.21mi |
| 1820 N Wisconsin St Unit B2 Mitchell, SD | 2.0 | 1.0 | 1000 | $915 | $0.92 | 43d | 1 | 1.24mi |
| 1820 N Wisconsin St Unit F7 Mitchell, SD | 2.0 | 1.0 | 1000 | $1,300 | $1.30 | 43d | 1 | 1.24mi |
Listing history 11 events
-
2026-06-19days on market $98,000 Active 15 DOM
-
2026-06-18days on market $98,000 Active 14 DOM
-
2026-06-17days on market $98,000 Active 13 DOM
-
2026-06-16days on market $98,000 Active 12 DOM
-
2026-06-15days on market $98,000 Active 11 DOM
-
2026-06-14days on market $98,000 Active 9 DOM
-
2026-06-12days on market $98,000 Active 8 DOM
-
2026-06-09days on market $98,000 Active 5 DOM
-
2026-06-08days on market $98,000 Active 4 DOM
-
2026-06-07days on market $98,000 Active 3 DOM
-
2026-06-05$98,000 Active 1 DOM
ⓘ Source: listings_history table (triggers on properties + properties_extension) + one-shot
backfill from property_details.listing_events for pre-trigger history.
Tax reassessment forecast SD · Resets to sale price
- Current annual tax
- $638 · $53/mo
- Projected year-2 tax
- $1,284 · $107/mo
- Expected delta
- +$646/yr (+$54/mo · 101.3%)
ⓘ Screening estimate from a state-policy table — verify with the county assessor before closing.
Climate risk First Street
- Flood 1/10 Low FEMA zone X (unshaded) · 0% chance over 30 yrs
- Wildfire 4/10 Moderate
- Heat 3/10 Moderate 7 d/yr ≥101°F today · 14 d/yr by 30 yrs out
- Wind 2/10 Low
- Air quality 2/10 Low 1 unhealthy d/yr today · 1 by 30 yrs out
Nearby sold comps map
Loading sold comps map…
Walkable amenities ~0.75 mi
Loading nearby amenities…
Taxation est. · year 1
- Rental income
- $10,879
- − Mortgage interest
- −$5,490
- − Property taxes
- −$638
- − Insurance
- −$490
- − Repairs & maintenance
- −$870
- − Management
- −$870
- − Depreciation
- −$2,851
- Taxable loss
- −$330
- Est. tax savings @ 24.0%
- +$79
- After-tax cash flow
- $1,379/yr
For passive investors: Depreciation is non-cash, so a rental often shows a tax loss while cash-flowing — sheltering income. Rental losses are passive: they offset passive income freely, and up to $25,000/yr can offset ordinary (W-2) income if you actively participate and your MAGI is under $100k (phasing out to $0 by $150k); unused losses carry forward. On sale, claimed depreciation is recaptured at up to 25%, and gains may owe capital-gains tax (a 1031 exchange can defer both). Figures are a year-1 estimate at your 24.0% rate — not tax advice; consult a CPA.
Schools (NCES district)
- District
- Mitchell School District 17-2
- NCES district ID
- 4648390
- Math proficiency
- 55% ▬ 0.00%
- Reading proficiency
- 62% ▲ 5.00%
- Median HH income
- $45,912
- Composite
- 49.42/100
- National rank
- #2008
- State rank
- #11 of 59 in SD
Livability — Mitchell
- Score
- 77/100
- State rank
- #18
- US rank
- #2969
Category grades
Schools grade is shown separately in the Schools card above.
Census & demographics
- Census place
- Mitchell, SD
- County
- Davison County · 19,104 people
- City population
- 19,104
- Metro
- Mitchell, SD
- Population (ZIP)
- 19,104
- Household income
- $65,620
- Rent vs Own
- Severe rent burden
- 537.0
Population outlook (Davison County) Hauer SSP2
- Today (2025)
- 20,529 people
- By 2030
- 20,856 · +1.6%
- By 2040
- 21,415 · +4.3%
- By 2050
- 21,925 · +6.8%
- By 2075
- 24,245 · +18.1%
- By 2100
- 29,222 · +42.3%
Race, ethnicity, and origin ACS 2023
- Neighborhood character
- Predominantly White (89%)
- Race & ethnicity
- White 89% Hispanic / Latino 5% Native American 4% Two or more races 3%
- Common ancestry
- Portuguese 10% Iranian 7% Lithuanian 3%
- Foreign-born
- 2% · Canada
- Languages at home
- 96% English-only · Spanish 2%
Political lean MEDSL · Davison
- 2024 margin
- Solid R (+37.8) · D 29.9% · R 67.7% · Other 2.5%
- 2008→2024 swing
- -23.8pp toward R · 2008: -13.9pp · 2024: -37.8pp
- All cycles
- 2024: R+37.8 2020: R+35.1 2016: R+35.2 2012: R+21.5 2008: R+13.9
Not yet ingested
- Civics
- —
Market trends
- HPI YoY
- ▼ -136.01%
- Current HPI
- 179.7909
- Rent YoY
- —
- Metro
- Mitchell, SD
- State GDP YoY
- ▲ 0.70%
- F500 in state
- 2
Industry mix (Fortune 500 HQ in SD)
| Industry | F500 HQs | Revenue |
|---|---|---|
| Utilities | 1 | $1B |
|
||
Price history
+600.0% since first listed5 events — show timeline
- 2026-06-04 Listed $98,000 MBOR
- 2023-05-17 Sold (MLS) $40,000 MBOR
- 2023-05-09 Pending — MBOR
- 2023-04-24 Listed $59,500 MBOR
- 2001-06-07 Sold (Public Records) $14,000 Public Records
Property tax history
+5.2%/yrLatest (2025): $638 · +30.4% YoY. Source: county tax records.
Cash-flow waterfall
monthlySold comps — $/sqft
last 12 mo · ≤1 miLoading sold comps…