 108-Plex
1121 N College Dr · Maryville, MO
Flood risk 1/10 · Minimal
- FEMA flood zone
- X (unshaded)
- Chance of flooding over 30 yrs
- 0.0%
- Est. flood insurance / yr
- $507 – $1,088
Fire risk 3/10 · Minor
- Est. fire insurance / yr
- $1,054 – $1,958
Heat risk 3/10 · Minor
- Hot days now (above 105°F)
- 7 days/yr
- Hot days in 30 yrs
- 15 days/yr
Wind risk 2/10 · Minimal
- Chance of severe wind over 30 yrs
- —
Air-quality risk 2/10 · Minimal
- Unhealthy air days now
- 1 days/yr
- Unhealthy air days in 30 yrs
- 1 days/yr
Risk factors via First Street. Map © Google.
Why this score? — see what drove the B- grade
The composite is a weighted blend of 9 inputs, each scored 0–100. Each bar is that input's sub-score; the figure is the points it added to the 100-point composite (weight × sub-score).
- Cash flow +28.8/30.0
- DSCR +10.0/10.0
- 1% rule +8.0/10.0
- ARV discount +7.5/15.0
- Livability +4.0/5.0
- Condition / age +4.0/5.0
- Schools +3.9/10.0
- Rent growth +2.5/5.0
- Appreciation +0.0/10.0
$5,000,000
🖨 Deal sheet (PDF) 📄 Offer letter ✓ Due diligence
Multi-family units
County records classify this as Multi-Family (5+ Unit). Listing-text estimate: 108 units. confirmed
5+ unit building — per-unit beds/baths from public records are typically unavailable; the breakdown below (if shown) is an estimate from the listing text.
Listing remarks
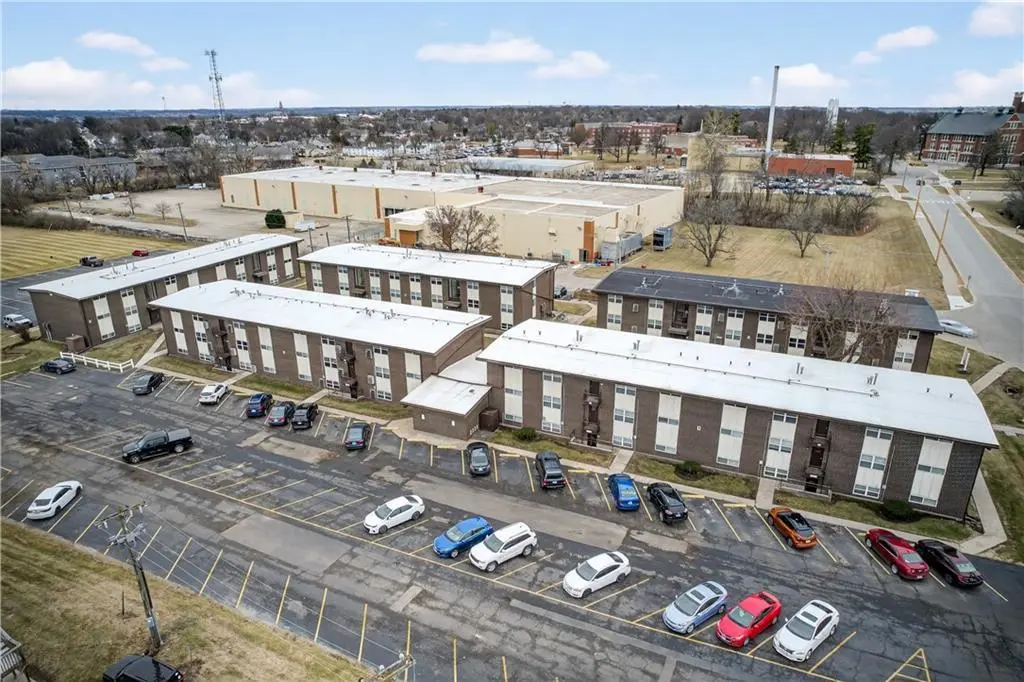
Campus View Apartments, a 108-unit multifamily community located in Maryville, Missouri. Campus View represents a clear, execution-oriented value-add opportunity, with the majority of units remaining in classic condition and the ability to drive approximately $100 per unit in monthly rent upside through light, cost-effective interior renovations. The property features a well-balanced mix of one- and two-bedroom floor plans that align with the primary renter base in Maryville, including students, university staff, healthcare workers, and other local employees. Campus View benefits from a walkable location near Northwest Missouri State University, durable local demand drivers supported by edu
Key facts
- Interior renovations
- Capital improvements
- Walkable location
Tags
Property features AI
Finance
- Financial info: Gross income reported: $769,015; Operating expenses include real estate tax
- HOA & community: No association fees
Exterior
- Parking: 140 off-street paved parking spaces
- Utilities: Public water; Public sewer; Central water heater
- Home design: Apartment building (residential income); Two stories; Zoned R4
- Construction: Brick and wood siding construction; Synthetic/other roof
- Exterior features: Property not in a flood plain; Lot approximately 4.63 acres
Interior
- Bedrooms: One-bedroom units (84 total); Two-bedroom units (24 total)
- Bathrooms: One bathroom in each unit type
- Heating & cooling: Natural gas heating; Window units and other cooling
- Interior features: Residential income property with apartment units; Current occupancy approximately 80-90%
Neighborhood map
What this means for you Summary
Snapshot
- This is a 108 × 1-bed/1-bath units multifamily listed at $5.00M. Condition is rated good.
Deal economics
- At list price, monthly cash flow is $17k ($202k/yr) — positive. Per door: $156/mo.
- The deal already cash-flows at list — no discount required.
- Meets the 1% rule at list price ($65k rent vs $5.00M).
- Cap rate 10.3% vs local median 4.2% in Maryville — top-decile yield for the area; either an underpriced asset or a hidden risk that comps aren't pricing in. Stress-test before assuming the spread holds.
Location & tenants
- Location reads 79/100 on livability (#23 in MO, #2,122 nationally) — a middle-class / working-renter tenant base. Strengths: cost of living A+, health & safety A+, housing B+; Watch: employment D, commute F.
- Maryville R-II (town): math 42% / reading 53% proficiency, ranked #79 of 324 in MO (top 24%) — families likely to look elsewhere, expect single-tenant / working-renter base with shorter leases.
- Zoned schools: Eugene Field Elem. (math 47% / reading 52%, grade D, #284 of 1,115 statewide, top 30%, 318 students, 52% FRL); Maryville Middle (math 41% / reading 50%, grade D+, #105 of 391 statewide, top 27%, 442 students, 40% FRL); Maryville High (math 42% / reading 72%, grade C, #51 of 521 statewide, top 11%, 506 students, 31% FRL) — zoned schools average 41% FRL vs 25% district-wide (16 pts higher); higher-poverty schools than district average — tighter screening recommended.
- Market conditions: 133 active listings in the ZIP; 5 comparable units currently listed for rent nearby; rentals lingering (median 46d on market — plan ~5-8 weeks vacancy on turnover, expect pricing pressure); 100% of comp listings sitting > 30 days — soft ceiling on asking rent; 49 units permitted in Nodaway County in 2024 (0 in 5+ unit buildings).
Forward outlook
- Local home prices are declining (-3.0%/yr); year-one equity from $35k of loan paydown is wiped out by about $150k of value loss. Plan a longer hold.
- Nodaway County population projected at -13% by 2050 — secular population decline; favor cash flow + early exit over multi-decade hold.
- At projected returns (-3.0% appreciation + 3.0% rent growth), your $1.40M cash investment doubles in ~9 years — after that, you're playing with house money.
Negotiation context
- Only 2 days on market — expect competitive offers; lowballing is unlikely to land.
- 2 sale attempts since 2y ago with the ask held roughly flat each time — persistent listings suggest the price (not the market) is what's stuck; bring a comps-based counter.
Questions for the listing agent
- Can we see the unit-by-unit rent roll, current vacancy, and any below-market leases? What's the average tenancy length?
- What capital expenditures (roof, boiler, parking lot, exteriors) have been made in the last 5 years, and what's planned in the next 2?
- Built in 1972 — when were the roof, HVAC, electrical panel, plumbing, and water heater last replaced?
- Is there a deadline driving the sale (1031 exchange, divorce, estate, relocation)? That informs how much negotiation room exists.
- Schools are B-rated — typically a magnet for longer-tenancy family renters. What's the average tenant stay here, and is there a school-zone premium baked into asking?
- What's the average days-on-market for RENTAL listings here right now (not sales)? A rising rental-DOM trend means longer vacancies and softer asking-rent achievability than the comps imply.
- What's the recent tenant-quality profile in this submarket — average credit score on applications, eviction rate, late-payment / NSF rate, and stable-employment percentage? A property-management company in the area should have these aggregated.
- How much new apartment / multifamily construction is in the pipeline within 1–3 miles? Heavy new supply (>2% of stock underway) typically softens rents 12–24 months out; light construction supports rent growth.
Investment metrics
- 1% rule
- 1.30% ✓
- Cap rate
- 10.33%
- Cash-on-cash
- 14.42%
- DSCR
- 1.64
- GRM
- 6.4
CMA / ARV
No comps found within radius.
Show comp detail 7 sales within ~0.75 mi
| Address | Dist | Beds/Ba | Sqft | Sold | Price | $/sf | Match |
|---|---|---|---|---|---|---|---|
| 926 N Buchanan St | 0.44mi | 12/6.0 | — | 1mo | $610,000 | — | 46 |
| 915/917 N Fillmore St | 0.42mi | 8/9.0 | — | 6mo | $450,000 | — | 43 |
| 825 N Buchanan St | 0.49mi | —/4.0 | 14,656 | 2mo | $250,000 | $17 | 43 |
| 111 W 9th St | 0.51mi | 16/6.0 | — | 6mo | $649,000 | — | 39 |
| 315 W 4th St | 0.58mi | 7/4.0 | — | 6mo | $314,000 | — | 36 |
| 316 N Fillmore St | 0.62mi | 4/4.0 | — | 4mo | $329,000 | — | 35 |
| 614-616 W 2nd St | 0.63mi | 8/4.0 | — | 8mo | $319,000 | — | 32 |
Match score weights: distance 35% · size 25% · config 20% · recency 20%. Top-matched comps best support the ARV.
Projected returns pro-forma
-3.0% appreciation · 3.0% rent growth · sell at horizon
- IRR
- 4.8%
- Equity multiple
- 1.19×
- Total profit
- $262,483
- Equity at exit
- $745,516
- IRR
- 14.3%
- Equity multiple
- 2.15×
- Total profit
- $1,612,559
- Equity at exit
- $432,309
Cash invested: $1,400,000 (down + closing). Projections, not guarantees.
Landlord ↔ Tenant lean methodology
- Overall (STATE)
- 81 Strongly Landlord-Friendly
- State Missouri
- 81 Strongly Landlord-Friendly · R+10
- County
- — inherits STATE
- City
- — inherits STATE
ZIP-level market 64468
- Home prices YoY
- -25.4%
- Active inventory
- 133
- Price-to-rent
- 691.9×
Monthly cashflow live
- Estimated rent
- $65,039 high interval (Pro) →
- Mortgage (P&I)
- −$26,221
- Tax est. 1.5%
- −$6,250 /mo · $75,000/yr
- Insurance
- −$2,083
- HOA
- −$0
- Vacancy / Maint / Mgmt
- −$13,658
- Net cashflow
- $16,827
Break-even live
Sensitivity live
| Price | -10% $20,282 | -5% $18,555 | +0% $16,827 | +5% $15,099 | +10% $13,372 |
|---|---|---|---|---|---|
| Rent | -10% $11,689 | -5% $14,258 | +0% $16,827 | +5% $19,396 | +10% $21,965 |
| Rate | -1.0pp $19,345 | -0.5pp $18,099 | base $16,827 | +0.5pp $15,531 | +1.0pp $14,213 |
108-unit breakdown (identical units grouped — click to expand)
| Units | Beds | Baths | Est. rent |
|---|---|---|---|
| 108× units | 1 | 1 | $65,016 |
| #1 | 1 | 1 | $602 |
| #2 | 1 | 1 | $602 |
| #3 | 1 | 1 | $602 |
| #4 | 1 | 1 | $602 |
| #5 | 1 | 1 | $602 |
| #6 | 1 | 1 | $602 |
| #7 | 1 | 1 | $602 |
| #8 | 1 | 1 | $602 |
| #9 | 1 | 1 | $602 |
| #10 | 1 | 1 | $602 |
| #11 | 1 | 1 | $602 |
| #12 | 1 | 1 | $602 |
| #13 | 1 | 1 | $602 |
| #14 | 1 | 1 | $602 |
| #15 | 1 | 1 | $602 |
| #16 | 1 | 1 | $602 |
| #17 | 1 | 1 | $602 |
| #18 | 1 | 1 | $602 |
| #19 | 1 | 1 | $602 |
| #20 | 1 | 1 | $602 |
| #21 | 1 | 1 | $602 |
| #22 | 1 | 1 | $602 |
| #23 | 1 | 1 | $602 |
| #24 | 1 | 1 | $602 |
| #25 | 1 | 1 | $602 |
| #26 | 1 | 1 | $602 |
| #27 | 1 | 1 | $602 |
| #28 | 1 | 1 | $602 |
| #29 | 1 | 1 | $602 |
| #30 | 1 | 1 | $602 |
| #31 | 1 | 1 | $602 |
| #32 | 1 | 1 | $602 |
| #33 | 1 | 1 | $602 |
| #34 | 1 | 1 | $602 |
| #35 | 1 | 1 | $602 |
| #36 | 1 | 1 | $602 |
| #37 | 1 | 1 | $602 |
| #38 | 1 | 1 | $602 |
| #39 | 1 | 1 | $602 |
| #40 | 1 | 1 | $602 |
| #41 | 1 | 1 | $602 |
| #42 | 1 | 1 | $602 |
| #43 | 1 | 1 | $602 |
| #44 | 1 | 1 | $602 |
| #45 | 1 | 1 | $602 |
| #46 | 1 | 1 | $602 |
| #47 | 1 | 1 | $602 |
| #48 | 1 | 1 | $602 |
| #49 | 1 | 1 | $602 |
| #50 | 1 | 1 | $602 |
| #51 | 1 | 1 | $602 |
| #52 | 1 | 1 | $602 |
| #53 | 1 | 1 | $602 |
| #54 | 1 | 1 | $602 |
| #55 | 1 | 1 | $602 |
| #56 | 1 | 1 | $602 |
| #57 | 1 | 1 | $602 |
| #58 | 1 | 1 | $602 |
| #59 | 1 | 1 | $602 |
| #60 | 1 | 1 | $602 |
| #61 | 1 | 1 | $602 |
| #62 | 1 | 1 | $602 |
| #63 | 1 | 1 | $602 |
| #64 | 1 | 1 | $602 |
| #65 | 1 | 1 | $602 |
| #66 | 1 | 1 | $602 |
| #67 | 1 | 1 | $602 |
| #68 | 1 | 1 | $602 |
| #69 | 1 | 1 | $602 |
| #70 | 1 | 1 | $602 |
| #71 | 1 | 1 | $602 |
| #72 | 1 | 1 | $602 |
| #73 | 1 | 1 | $602 |
| #74 | 1 | 1 | $602 |
| #75 | 1 | 1 | $602 |
| #76 | 1 | 1 | $602 |
| #77 | 1 | 1 | $602 |
| #78 | 1 | 1 | $602 |
| #79 | 1 | 1 | $602 |
| #80 | 1 | 1 | $602 |
| #81 | 1 | 1 | $602 |
| #82 | 1 | 1 | $602 |
| #83 | 1 | 1 | $602 |
| #84 | 1 | 1 | $602 |
| #85 | 1 | 1 | $602 |
| #86 | 1 | 1 | $602 |
| #87 | 1 | 1 | $602 |
| #88 | 1 | 1 | $602 |
| #89 | 1 | 1 | $602 |
| #90 | 1 | 1 | $602 |
| #91 | 1 | 1 | $602 |
| #92 | 1 | 1 | $602 |
| #93 | 1 | 1 | $602 |
| #94 | 1 | 1 | $602 |
| #95 | 1 | 1 | $602 |
| #96 | 1 | 1 | $602 |
| #97 | 1 | 1 | $602 |
| #98 | 1 | 1 | $602 |
| #99 | 1 | 1 | $602 |
| #100 | 1 | 1 | $602 |
| #101 | 1 | 1 | $602 |
| #102 | 1 | 1 | $602 |
| #103 | 1 | 1 | $602 |
| #104 | 1 | 1 | $602 |
| #105 | 1 | 1 | $602 |
| #106 | 1 | 1 | $602 |
| #107 | 1 | 1 | $602 |
| #108 | 1 | 1 | $602 |
| Total (108 units) | $65,039 | ||
UW: 25.0% down · 7.5% · 30yr · 1.5% tax · 5.0% vac · 8.0% maint · 8.0% mgmt
Financing live
Cash to close
- Down payment
- $1,250,000
- Closing costs
- $150,000
- Reserves months
- —
- Total cash needed
- —
Loan-product check · same deal, 3 products live
Conventional
25% down · 7.5% · 30yr
- Down + closing
- —
- Monthly P&I
- —
- Monthly cashflow
- —
- DSCR
- —
- Eligible?
- —
Personal DTI + credit; lowest rate.
DSCR
20% down · 8.5% · 30yr
- Down + closing
- —
- Monthly P&I
- —
- Monthly cashflow
- —
- DSCR
- —
- Eligible?
- —
No personal income docs; deal must DSCR.
Hard money
10% down · 12.0% · 12mo
- Down + closing
- —
- Monthly P&I
- —
- Monthly cashflow
- —
- DSCR
- —
- Eligible?
- —
Short-term bridge; refi at stabilization.
Rent comps 5 comps
| Address | Beds | Baths | Sqft | Rent | $/sqft | DOM | Units | Dist |
|---|---|---|---|---|---|---|---|---|
| 1115 N College Dr Maryville, MO | 1.0–2.0 | 1.0 | 779 | $715 | $0.92 | 45d | 45 | 0.03mi |
| 218 Park Ave Unit 4 Maryville, MO | 2.0 | 1.0 | — | $795 | — | 45d | 1 | 0.60mi |
| 222 Park Ave Unit 218-4 Maryville, MO | 2.0 | 1.0 | — | $795 | — | 45d | 1 | 0.61mi |
| 316 N Fillmore St Apt : C Maryville, MO 64468 Maryville, MO | 1.0 | 1.0 | 800 | $800 | $1.00 | 45d | 1 | 0.62mi |
| 112 E 3rd St Unit 114A Maryville, MO | 2.0 | 1.0 | — | $575 | — | 45d | 1 | 0.77mi |
Listing history 3 events
-
2026-06-04statusdays on market $5,000,000 Pending 2 DOM
-
2026-06-01remarks 699-char remark
-
2026-06-01$5,000,000 Active 1 DOM
ⓘ Source: listings_history table (triggers on properties + properties_extension) + one-shot
backfill from property_details.listing_events for pre-trigger history.
Climate risk First Street
- Flood 1/10 Low FEMA zone X (unshaded) · 0% chance over 30 yrs
- Wildfire 3/10 Moderate
- Heat 3/10 Moderate 7 d/yr ≥105°F today · 15 d/yr by 30 yrs out
- Wind 2/10 Low
- Air quality 2/10 Low 1 unhealthy d/yr today · 1 by 30 yrs out
Nearby sold comps map
Loading sold comps map…
Walkable amenities ~0.75 mi
Loading nearby amenities…
Taxation est. · year 1
- Rental income
- $780,468
- − Mortgage interest
- −$280,078
- − Property taxes
- −$75,000
- − Insurance
- −$25,000
- − Repairs & maintenance
- −$62,437
- − Management
- −$62,437
- − Depreciation
- −$145,455
- Taxable income
- $130,061
- Est. tax owed @ 24.0%
- −$31,215
- After-tax cash flow
- $170,709/yr
For passive investors: Depreciation is non-cash, so a rental often shows a tax loss while cash-flowing — sheltering income. Rental losses are passive: they offset passive income freely, and up to $25,000/yr can offset ordinary (W-2) income if you actively participate and your MAGI is under $100k (phasing out to $0 by $150k); unused losses carry forward. On sale, claimed depreciation is recaptured at up to 25%, and gains may owe capital-gains tax (a 1031 exchange can defer both). Figures are a year-1 estimate at your 24.0% rate — not tax advice; consult a CPA.
Condition & rehab AI · 12 photos
Campus View Apartments is a well-maintained 108-unit multifamily property with good condition and potential for modest cosmetic updates to enhance its curb appeal and value.
Value-add opportunities
- Both Paint exterior walls — Enhances curb appeal and can increase both resale and rental value.
- Both Clean and maintain landscaping — Improves curb appeal and can increase both resale and rental value.
- Both Update kitchen appliances — Modernizes the kitchen and can increase both resale and rental value.
- Both Update bathrooms with modern fixtures — Modernizes the bathrooms and can increase both resale and rental value.
Renovation cost estimate screening
Value-add ROI direction
- Both Paint exterior walls — Enhances curb appeal and can increase both resale and rental value. ↑
- Both Clean and maintain landscaping — Improves curb appeal and can increase both resale and rental value. ↑
- Both Update kitchen appliances — Modernizes the kitchen and can increase both resale and rental value. ↑
- Both Update bathrooms with modern fixtures — Modernizes the bathrooms and can increase both resale and rental value. ↑
ⓘ Cost ranges are severity-bucket heuristics (US national rule-of-thumb). Get contractor quotes + a written scope before underwriting a rehab budget.
Schools (NCES district)
- District
- Maryville R-II
- NCES district ID
- 2920490
- Math proficiency
- 42% ▼ -5.00%
- Reading proficiency
- 53% ▼ -2.00%
- Median HH income
- $35,045
- Composite
- 39.24/100
- National rank
- #4005
- State rank
- #79 of 324 in MO
Livability — Maryville
- Score
- 79/100
- State rank
- #23
- US rank
- #2122
Category grades
Schools grade is shown separately in the Schools card above.
Census & demographics
- Census place
- Maryville, MO
- City population
- 14,315
- Population (ZIP)
- 14,315
Population outlook (Nodaway County) Hauer SSP2
- Today (2025)
- 22,010 people
- By 2030
- 21,531 · -2.2%
- By 2040
- 20,360 · -7.5%
- By 2050
- 19,210 · -12.7%
- By 2075
- 17,711 · -19.5%
- By 2100
- 16,796 · -23.7%
Race, ethnicity, and origin ACS 2023
- Neighborhood character
- Predominantly White (90%)
- Race & ethnicity
- White 90% Black 3% Hispanic / Latino 3% Two or more races 2% Asian 2%
- Common ancestry
- Slovak 3% Italian 3% Lithuanian 2%
- Foreign-born
- 3% · Canada
- Languages at home
- 97% English-only · Spanish 1% Other Asian/Pacific 1% German/W. Germanic 0%
Political lean MEDSL · Nodaway
- 2024 margin
- Solid R (+43.7) · D 27.6% · R 71.4% · Other 1.0%
- 2008→2024 swing
- -33.2pp toward R · 2008: -10.5pp · 2024: -43.7pp
- All cycles
- 2024: R+43.7 2020: R+40.5 2016: R+40.8 2012: R+27.0 2008: R+10.5
Not yet ingested
- Civics
- —
Market trends
- HPI YoY
- ▼ -65.91%
- Current HPI
- 193.2735
- Rent YoY
- —
- Metro
- —
- State GDP YoY
- ▲ 1.84%
- F500 in state
- 20
Industry mix (Fortune 500 HQ in MO)
| Industry | F500 HQs | Revenue |
|---|---|---|
| Healthcare | 1 | $163B |
|
||
| Insurance | 1 | $21B |
|
||
| Industrial Technology | 1 | $17B |
|
||
| Retail | 1 | $16B |
|
||
| Industrial Distribution | 1 | $10B |
|
||
| Utilities | 1 | $9B |
|
||
Price history
3 events — show timeline
- 2026-06-01 Listed $5,000,000 Heartland MLS as Distributed by MLS Grid
- 2024-06-26 Rental Removed $715 APPFOLIO
- 2024-06-26 Listed for Rent $715 APPFOLIO
Cash-flow waterfall
monthlySold comps — $/sqft
last 12 mo · ≤1 miLoading sold comps…