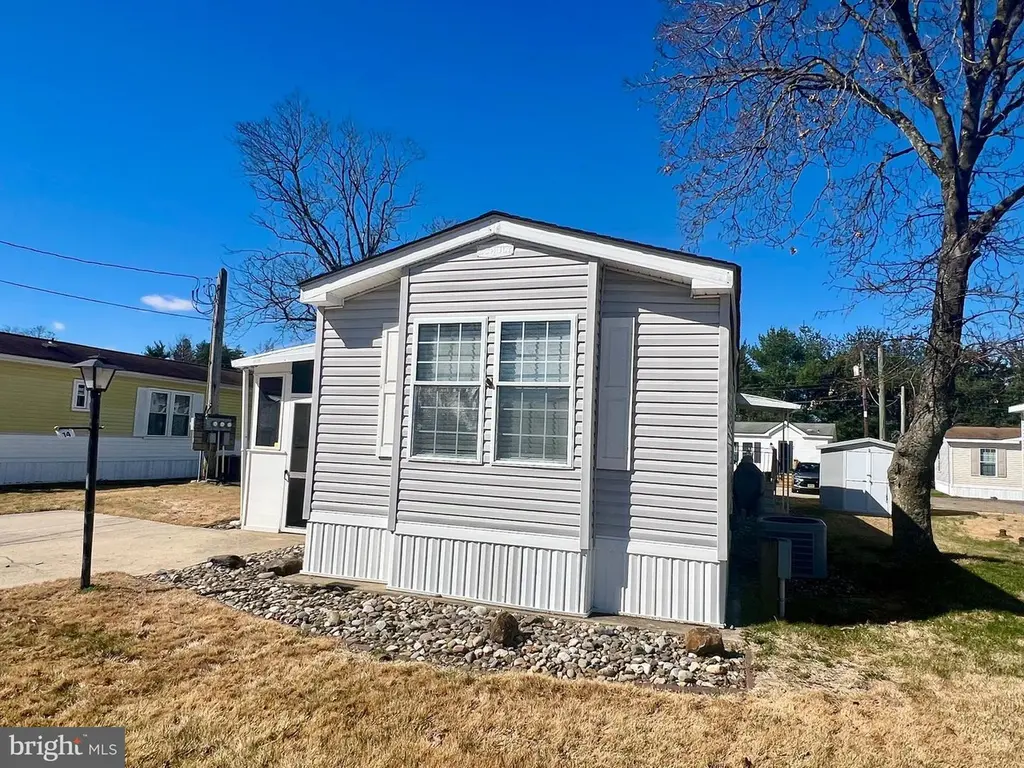
768 E Garden Rd #14 · Vineland, NJ
Flood risk No data
- FEMA flood zone
- —
- Chance of flooding over 30 yrs
- —
- Est. flood insurance / yr
- —
Fire risk No data
- Est. fire insurance / yr
- —
Heat risk No data
- Hot days now (above threshold)
- —
- Hot days in 30 yrs
- —
Wind risk No data
- Chance of severe wind over 30 yrs
- —
Air-quality risk No data
- Unhealthy air days now
- —
- Unhealthy air days in 30 yrs
- —
Risk factors via First Street. Map © Google.
Why this score? — see what drove the B+ grade
The composite is a weighted blend of 9 inputs, each scored 0–100. Each bar is that input's sub-score; the figure is the points it added to the 100-point composite (weight × sub-score).
- Cash flow +30.0/30.0
- ARV discount +15.0/15.0
- 1% rule +10.0/10.0
- DSCR +10.0/10.0
- Condition / age +3.8/5.0
- Livability +3.3/5.0
- Rent growth +2.5/5.0
- Schools +1.9/10.0
- Appreciation +0.0/10.0
$99,999
🖨 Deal sheet 📄 Offer letter ✓ Due diligence
Listing remarks
Welcome to Unit #14 in Chapman's Country Living! This single-wide manufactured home is move-in ready, with updates throughout! Conveniently located in the community, this home features a concrete driveway with plenty of room for parking. When approaching the home, you will notice beautiful perennial gardens, that provide annual blooms with low maintenance. Inside the screened in patio area, you will find plenty of room for furniture - a great place to rest and relax in the warmer months! Inside the home, updated luxury vinyl plank flooring runs through the living room area. The kitchen area includes an L-shaped countertop, wood cabinets and stainless appliances. This laundry area is locat
Key facts
- Perennial gardens
- L-shaped countertop
- Stainless appliances
Tags
Property features AI
Finance
- Financial info: Ownership interest: Land lease
- HOA & community: Land lease of $741 per month with approximately 30 years remaining; Pets allowed with size/weight restrictions
Exterior
- Parking: Concrete driveway with four parking spaces
- Utilities: Public water; Community septic tank; Electric service
- Home design: Manufactured single-wide home; Single-story (main level living); Land lease community
- Construction: Estimated year built; Other structures above and below grade
- Exterior features: Patio; Shed; Park setting (Chapman's Manufactured Housing)
Interior
- Kitchen: Refrigerator; Electric oven/range; Dishwasher
- Bedrooms: Two bedrooms on the main level
- Flooring: Luxury vinyl plank; Carpet; Laminate
- Bathrooms: Two full bathrooms on the main level
- Heating & cooling: Forced air heating (natural gas); Central air conditioning (electric)
- Interior features: Very good overall condition; No basement; Enclosed patio
- Laundry & utility: Washer and dryer located on the main floor; Natural gas hot water
Neighborhood map
What this means for you Summary
Snapshot
- This is a 2-bed/2.0-bath single-family listed at $100k. Condition is rated good.
Deal economics
- At list price, monthly cash flow is $641 ($8k/yr) — positive.
- The deal already cash-flows at list — no discount required.
- Meets the 1% rule at list price ($2k rent vs $100k).
- Recommended offer: $94k (6.0% below list) — sets the bar for market timing.
- Cap rate 14.0% vs local median 4.5% in Vineland — top-decile yield for the area; either an underpriced asset or a hidden risk that comps aren't pricing in. Stress-test before assuming the spread holds.
Location & tenants
- Location reads 66/100 on livability (#363 in NJ) — a middle-class / working-renter tenant base. Strengths: housing A+, health & safety A+; Watch: employment D+, schools D, crime F.
- Vineland Public School District (urban): math 9% / reading 34% proficiency, ranked #418 of 472 in NJ (top 89%) — low school quality limits family demand, transient renter base, plan for 1-2y turnover.
- Market conditions: 173 active listings in the ZIP; 216 units permitted in Cumberland County in 2024 (73 in 5+ unit buildings).
- This rent runs 31% of the median local income ($65k/yr) — at the standard rent-burdened threshold; future hikes will face affordability resistance.
Forward outlook
- Local home prices are declining (-3.0%/yr); year-one equity from $691 of loan paydown is wiped out by about $3k of value loss. Plan a longer hold.
- Cumberland County population projected to shrink 7% by 2050 — rents likely to lag national; underwrite the cash flow, not the appreciation.
- At projected returns (-3.0% appreciation + 3.0% rent growth), your $28k cash investment doubles in ~5 years — after that, you're playing with house money.
Negotiation context
- It's been on market 78 days — a 6% lower offer ($94k) is reasonable based on typical stale-listing flexibility.
Questions for the listing agent
- It's been on market 78 days. Have you received any prior offers? Is the seller open to a 6% concession, seller financing, or rate buy-down credit?
- Why hasn't it sold? Are there any deal-killer items the seller is aware of (foundation, flood, title, zoning, code violations)?
- Is there a deadline driving the sale (1031 exchange, divorce, estate, relocation)? That informs how much negotiation room exists.
- Schools are D-rated, which usually means shorter tenancies and higher turnover. Who's the typical renter profile here, and what's been the actual vacancy rate?
- Crime grade is F in this area — have there been break-ins, vandalism, or insurance claims at this property in the last 3 years? What carrier currently insures it and at what premium?
- What's the average days-on-market for RENTAL listings here right now (not sales)? A rising rental-DOM trend means longer vacancies and softer asking-rent achievability than the comps imply.
- What's the recent tenant-quality profile in this submarket — average credit score on applications, eviction rate, late-payment / NSF rate, and stable-employment percentage? A property-management company in the area should have these aggregated.
- How much new for-sale + rental construction is in the pipeline within 1–3 miles? Heavy new supply typically softens prices + rents 12–24 months out; constrained supply supports both.
Investment metrics
- 1% rule
- 1.69% ✓
- Cap rate
- 13.99%
- Cash-on-cash
- 27.49%
- DSCR
- 2.22
- GRM
- 4.9
CMA / ARV
- ARV (on-the-fly)
- $147,000
- Comps found
- 9
Show comp detail 9 sales within ~0.75 mi
| Address | Dist | Beds/Ba | Sqft | Sold | Price | $/sf | Match |
|---|---|---|---|---|---|---|---|
| 768 E Garden Rd #6 | 0.02mi | 2/2.0 | 1,100 (+12%) | 18mo | $165,000 | $150 | 63 |
| 1263 Sunrise Ave | 0.45mi | 2/1.0 | 1,008 (+3%) | 12mo | $250,000 | $248 | 60 |
| 2871 Alberic St | 0.42mi | 2/1.0 | 840 (-14%) | 0mo | $250,000 | $298 | 52 |
| 2871 Alberic St | 0.43mi | 2/1.0 | 840 (-14%) | 0mo | $250,000 | $298 | 52 |
| 1976 Ne Ave #263 | 0.71mi | 2/2.0 | 970 (-1%) | 22mo | $86,500 | $89 | 47 |
| 1114 Jewel St | 0.37mi | 3/1.0 (+1) | 1,056 (+8%) | 22mo | $295,001 | $279 | 43 |
| 1976 N East Ave Unit 115 (DARLENE DRIVE) | 0.71mi | 2/1.0 | 1,000 (+2%) | 22mo | $50,000 | $50 | 41 |
| 1976 N East Ave #238 | 0.75mi | 3/2.0 (+1) | 1,000 (+2%) | 21mo | $85,000 | $85 | 39 |
| 1976 N East Ave Ave #8 | 0.72mi | 2/2.0 | 1,088 (+11%) | 22mo | $79,000 | $73 | 30 |
Match score weights: distance 35% · size 25% · config 20% · recency 20%. Top-matched comps best support the ARV.
Projected returns pro-forma
-3.0% appreciation · 3.0% rent growth · sell at horizon
- IRR
- 21.5%
- Equity multiple
- 1.88×
- Total profit
- $24,676
- Equity at exit
- $14,910
- IRR
- 29.7%
- Equity multiple
- 3.65×
- Total profit
- $74,199
- Equity at exit
- $8,646
Cash invested: $28,000 (down + closing). Projections, not guarantees.
Landlord ↔ Tenant lean methodology
- Overall (STATE)
- 21 Tenant-Leaning
- State New Jersey
- 21 Tenant-Leaning · D+6
- County
- — inherits STATE
- City
- — inherits STATE
ZIP-level market 08360
- Active inventory
- 173
- Price-to-rent
- 4.9×
Monthly cashflow live
- Estimated rent
- $1,687 medium interval (Pro) →
- Mortgage (P&I)
- −$524
- Tax est. 1.5%
- −$125 /mo · $1,500/yr
- Insurance
- −$42
- HOA
- −$0
- Vacancy / Maint / Mgmt
- −$354
- Net cashflow
- $641
Break-even live
UW: 25.0% down · 7.5% · 30yr · 1.5% tax · 5.0% vac · 8.0% maint · 8.0% mgmt
Financing live
Cash to close
- Down payment
- $25,000
- Closing costs
- $3,000
- Reserves months
- —
- Total cash needed
- —
Loan-product check · same deal, 3 products live
Conventional
25% down · 7.5% · 30yr
- Down + closing
- —
- Monthly P&I
- —
- Monthly cashflow
- —
- DSCR
- —
- Eligible?
- —
Personal DTI + credit; lowest rate.
DSCR
20% down · 8.5% · 30yr
- Down + closing
- —
- Monthly P&I
- —
- Monthly cashflow
- —
- DSCR
- —
- Eligible?
- —
No personal income docs; deal must DSCR.
Hard money
10% down · 12.0% · 12mo
- Down + closing
- —
- Monthly P&I
- —
- Monthly cashflow
- —
- DSCR
- —
- Eligible?
- —
Short-term bridge; refi at stabilization.
Listing history 8 events
-
2026-06-07statusdays on market $99,999 Pending 78 DOM
-
2026-06-03days on market $99,999 Active 77 DOM
-
2026-06-02days on market $99,999 Active 76 DOM
-
2026-06-01days on market $99,999 Active 75 DOM
-
2026-05-31days on market $99,999 Active 74 DOM
-
2026-05-30days on market $99,999 Active 73 DOM
-
2026-04-28price $99,999
-
2026-03-18$105,000 Active
ⓘ Source: listings_history table (triggers on properties + properties_extension) + one-shot
backfill from property_details.listing_events for pre-trigger history.
Nearby sold comps map
Loading sold comps map…
Walkable amenities ~0.75 mi
Loading nearby amenities…
Taxation est. · year 1
- Rental income
- $20,241
- − Mortgage interest
- −$5,601
- − Property taxes
- −$1,500
- − Insurance
- −$500
- − Repairs & maintenance
- −$1,619
- − Management
- −$1,619
- − Depreciation
- −$2,909
- Taxable income
- $6,492
- Est. tax owed @ 24.0%
- −$1,558
- After-tax cash flow
- $6,139/yr
For passive investors: Depreciation is non-cash, so a rental often shows a tax loss while cash-flowing — sheltering income. Rental losses are passive: they offset passive income freely, and up to $25,000/yr can offset ordinary (W-2) income if you actively participate and your MAGI is under $100k (phasing out to $0 by $150k); unused losses carry forward. On sale, claimed depreciation is recaptured at up to 25%, and gains may owe capital-gains tax (a 1031 exchange can defer both). Figures are a year-1 estimate at your 24.0% rate — not tax advice; consult a CPA.
Condition & rehab AI · 12 photos
This move-in ready single-wide manufactured home features updated flooring and appliances, with a good exterior and landscaping. Minor updates to the exterior and interior would significantly enhance its value.
Value-add opportunities
- Both Paint exterior siding — Enhances curb appeal and value
- Both Replace carpet in bedrooms — Improves aesthetics and comfort
- Both Update kitchen cabinets — Modernizes the space and adds value
Renovation cost estimate screening
Value-add ROI direction
- Both Paint exterior siding — Enhances curb appeal and value ↑
- Both Replace carpet in bedrooms — Improves aesthetics and comfort ↑
- Both Update kitchen cabinets — Modernizes the space and adds value ↑
ⓘ Cost ranges are severity-bucket heuristics (US national rule-of-thumb). Get contractor quotes + a written scope before underwriting a rehab budget.
Schools (NCES district)
- District
- Vineland Public School District
- NCES district ID
- 3416800
- Math proficiency
- 9% ▼ -17.00%
- Reading proficiency
- 34% ▬ 0.00%
- Median HH income
- $51,168
- Composite
- 19.17/100
- National rank
- #8819
- State rank
- #418 of 472 in NJ
Livability — Vineland
- Score
- 66/100
- State rank
- #363
- US rank
- #12180
Category grades
Schools grade is shown separately in the Schools card above.
Census & demographics
- Census place
- Vineland, NJ
- County
- Cumberland County · 80,266 people
- City population
- 45,038
- Metro
- Vineland-Bridgeton, NJ
- Population (ZIP)
- 45,038
- Household income
- $65,359
- Rent vs Own
- Severe rent burden
- 1328.0
Population outlook (Cumberland County) Hauer SSP2
- Today (2025)
- 152,743 people
- By 2030
- 150,373 · -1.6%
- By 2040
- 146,881 · -3.8%
- By 2050
- 142,653 · -6.6%
- By 2075
- 129,468 · -15.2%
- By 2100
- 107,456 · -29.6%
Race, ethnicity, and origin ACS 2023
- Neighborhood character
- Diverse neighborhood (Simpson 0.62)
- Race & ethnicity
- Hispanic / Latino 51% White 32% Two or more races 17% Black 11% Asian 1%
- Hispanic origin (detail)
- Mexican 11% Puerto Rican 33% Dominican 2%
- Common ancestry
- Romanian 2% Subsaharan African 1% Scotch-Irish 1%
- Foreign-born
- 14% · Canada, Jamaica
- Languages at home
- 59% English-only · Spanish 37% Russian/Polish/Slavic 2% Other Indo-European 1%
Political lean MEDSL · Cumberland
- 2024 margin
- Toss-up / Even · D 47.6% · R 51.3% · Other 1.1%
- 2008→2024 swing
- -25.4pp toward R · 2008: 21.6pp · 2024: -3.8pp
- All cycles
- 2024: R+3.8 2020: D+6.0 2016: D+5.3 2012: D+23.1 2008: D+21.6
Not yet ingested
- Civics
- —
Market trends
- HPI YoY
- ▼ -320.06%
- Current HPI
- 278.786
- Rent YoY
- —
- Metro
- Vineland-Bridgeton, NJ
- State GDP YoY
- ▲ 2.05%
- F500 in state
- 34
Industry mix (Fortune 500 HQ in NJ)
| Industry | F500 HQs | Revenue |
|---|---|---|
| Consumer Goods | 3 | $31B |
|
||
| Pharmaceuticals | 2 | $153B |
|
||
| Technology | 2 | $21B |
|
||
| Insurance | 2 | $20B |
|
||
| Healthcare | 2 | $19B |
|
||
| Financial Services | 1 | $70B |
|
||
Price history
-4.8% since first listed2 events — show timeline
- 2026-04-28 Price Changed $99,999 BRIGHT MLS
- 2026-03-18 Listed $105,000 BRIGHT MLS
Cash-flow waterfall
monthlySold comps — $/sqft
last 12 mo · ≤1 miLoading sold comps…