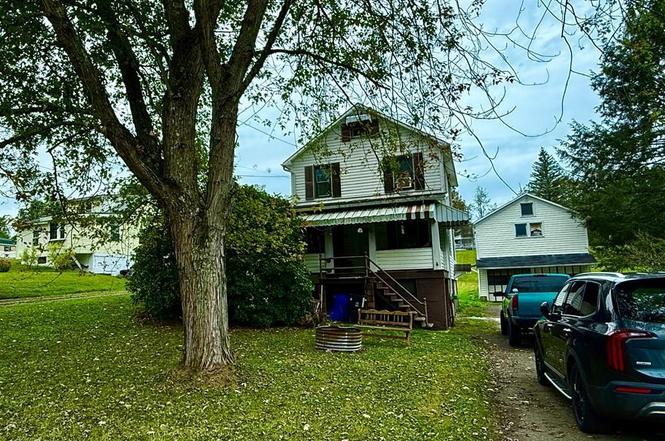
1739 William Penn Ave · Parkhill, PA
Flood risk 1/10 · Minimal
- FEMA flood zone
- X (unshaded)
- Chance of flooding over 30 yrs
- 0.0%
- Est. flood insurance / yr
- $473 – $860
Fire risk 2/10 · Minimal
- Est. fire insurance / yr
- $511 – $949
Heat risk 2/10 · Minimal
- Hot days now (above 93°F)
- 7 days/yr
- Hot days in 30 yrs
- 16 days/yr
Wind risk 2/10 · Minimal
- Chance of severe wind over 30 yrs
- —
Air-quality risk 3/10 · Minor
- Unhealthy air days now
- 2 days/yr
- Unhealthy air days in 30 yrs
- 3 days/yr
Risk factors via First Street. Map © Google.
Why this score? — see what drove the C+ grade
The composite is a weighted blend of 9 inputs, each scored 0–100. Each bar is that input's sub-score; the figure is the points it added to the 100-point composite (weight × sub-score).
- Cash flow +19.2/30.0
- ARV discount +12.7/15.0
- Appreciation +6.8/10.0
- DSCR +6.1/10.0
- 1% rule +4.4/10.0
- Schools +3.6/10.0
- Rent growth +2.5/5.0
- Livability +2.5/5.0
- Condition / age +2.5/5.0
$120,000
🖨 Deal sheet 📄 Offer letter ✓ Due diligence
Listing remarks MLS
Come take a look at this 3 bedroom, 1 full bath home on a 0.7 acre lot in East Taylor! Detached two car garage with spacious second floor workshop or storage area. Kitchen, separate Dining Room and large Living Room with coat closet. Hardwood under carpeting. Replacement windows throughout and newer doors. Newer furnace. Basement professionally waterproofed in 2015. Reasonable taxes. Lots of potential! Don't miss your chance to tour this priced right home!
Key facts
- New drywall
- Plumbing
- New kitchen
Tags
Neighborhood map
What this means for you Summary
Snapshot
- This is a 3-bed/1.0-bath single-family listed at $120k.
Deal economics
- At list price, monthly cash flow is $129 ($2k/yr) — positive.
- The deal already cash-flows at list — no discount required.
- To meet the 1% rule (rent ≥ 1% of price), the offer needs to be $112k (6.4% below list).
- Recommended offer: $106k (12.0% below list) — sets the bar for market timing.
Location & tenants
- Location reads: area grade C — affects rentability + tenant quality, not the cash-flow math above.
- Conemaugh Valley SD (rural): math 30% / reading 56% proficiency, ranked #313 of 539 in PA (top 58%) — families likely to look elsewhere, expect single-tenant / working-renter base with shorter leases.
- Market conditions: 22 active listings in the ZIP; 64 units permitted in Cambria County in 2024 (0 in 5+ unit buildings).
Forward outlook
- In year one you build about $5k of equity ($830 loan paydown + $4k appreciation (3.6% local appreciation)).
- Cambria County population projected at -28% by 2050 — secular population decline; favor cash flow + early exit over multi-decade hold.
- At projected returns (3.6% appreciation + 3.0% rent growth), your $34k cash investment doubles in ~5 years — after that, you're playing with house money.
- By year 7, paydown + projected appreciation supports a ~$32k cash-out refi (75% LTV) — recoverable capital for the next deal without selling this one.
Negotiation context
- It's been on market 206 days — a 12% lower offer ($106k) is reasonable based on typical stale-listing flexibility.
- 2 sale attempts; this cycle's ask has dropped $10k (8%) from the opening price — seller is motivated, your offer sets the floor, not the list.
- Current owner paid $64k; list at $120k implies a 89% gain — meaningful room to come down on a strong offer.
Questions for the listing agent
- It's been on market 206 days. Have you received any prior offers? Is the seller open to a 12% concession, seller financing, or rate buy-down credit?
- Why hasn't it sold? Are there any deal-killer items the seller is aware of (foundation, flood, title, zoning, code violations)?
- Is there a deadline driving the sale (1031 exchange, divorce, estate, relocation)? That informs how much negotiation room exists.
- What's the average days-on-market for RENTAL listings here right now (not sales)? A rising rental-DOM trend means longer vacancies and softer asking-rent achievability than the comps imply.
- What's the recent tenant-quality profile in this submarket — average credit score on applications, eviction rate, late-payment / NSF rate, and stable-employment percentage? A property-management company in the area should have these aggregated.
- How much new for-sale + rental construction is in the pipeline within 1–3 miles? Heavy new supply typically softens prices + rents 12–24 months out; constrained supply supports both.
Investment metrics
- 1% rule
- 0.94% ✗
- Cap rate
- 7.58%
- Cash-on-cash
- 4.61%
- DSCR
- 1.21
- GRM
- 8.9
CMA / ARV
- ARV (on-the-fly)
- $135,520
- Comps found
- 3
Show comp detail 3 sales within ~0.75 mi
| Address | Dist | Beds/Ba | Sqft | Sold | Price | $/sf | Match |
|---|---|---|---|---|---|---|---|
| 1211 Bartlett St | 0.21mi | 2/1.0 (-1) | 1,036 (-8%) | 13mo | $72,500 | $70 | 62 |
| 308 Cullis Ln | 0.55mi | 3/1.0 | 1,200 (+7%) | 4mo | $174,900 | $146 | 59 |
| 382 Ridgeview Ln | 0.49mi | 3/1.0 | 1,120 (0%) | 22mo | $135,000 | $121 | 59 |
Match score weights: distance 35% · size 25% · config 20% · recency 20%. Top-matched comps best support the ARV.
Projected returns pro-forma
3.56% appreciation · 3.0% rent growth · sell at horizon
- IRR
- 13.3%
- Equity multiple
- 1.78×
- Total profit
- $26,266
- Equity at exit
- $57,802
- IRR
- 14.8%
- Equity multiple
- 3.31×
- Total profit
- $77,593
- Equity at exit
- $92,191
Cash invested: $33,600 (down + closing). Projections, not guarantees.
Landlord ↔ Tenant lean methodology
- Overall (STATE)
- 62 Landlord-Friendly
- State Pennsylvania
- 62 Landlord-Friendly · EVEN
- County
- — inherits STATE
- City
- — inherits STATE
ZIP-level market 15909
- Home prices YoY
- 2.4%
- Active inventory
- 22
- Price-to-rent
- 8.9×
Monthly cashflow live
- Estimated rent
- $1,123 medium interval (Pro) →
- Mortgage (P&I)
- −$629
- Tax from tax record
- −$79 /mo · $947/yr
- Insurance
- −$50
- HOA
- −$0
- Vacancy / Maint / Mgmt
- −$236
- Net cashflow
- $129
Break-even live
UW: 25.0% down · 7.5% · 30yr · 1.5% tax · 5.0% vac · 8.0% maint · 8.0% mgmt
Financing live
Cash to close
- Down payment
- $30,000
- Closing costs
- $3,600
- Reserves months
- —
- Total cash needed
- —
Loan-product check · same deal, 3 products live
Conventional
25% down · 7.5% · 30yr
- Down + closing
- —
- Monthly P&I
- —
- Monthly cashflow
- —
- DSCR
- —
- Eligible?
- —
Personal DTI + credit; lowest rate.
DSCR
20% down · 8.5% · 30yr
- Down + closing
- —
- Monthly P&I
- —
- Monthly cashflow
- —
- DSCR
- —
- Eligible?
- —
No personal income docs; deal must DSCR.
Hard money
10% down · 12.0% · 12mo
- Down + closing
- —
- Monthly P&I
- —
- Monthly cashflow
- —
- DSCR
- —
- Eligible?
- —
Short-term bridge; refi at stabilization.
Listing history 19 events
-
2026-06-19days on market $120,000 Active 206 DOM
-
2026-06-18days on market $120,000 Active 205 DOM
-
2026-06-17days on market $120,000 Active 204 DOM
-
2026-06-16days on market $120,000 Active 203 DOM
-
2026-06-15days on market $120,000 Active 202 DOM
-
2026-06-14days on market $120,000 Active 200 DOM
-
2026-06-12days on market $120,000 Active 199 DOM
-
2026-06-09days on market $120,000 Active 196 DOM
-
2026-06-08days on market $120,000 Active 195 DOM
-
2026-06-07pricedays on market $120,000 Active 194 DOM
-
2026-06-02days on market $115,000 Active 189 DOM
-
2026-06-01status $115,000 Active 188 DOM
-
2026-04-05status Pending
-
2026-04-01status Active
-
2026-04-01price $115,000
-
2025-12-08price $124,500
-
2025-09-29$129,900 Active
-
2016-05-16soldstatus $63,500 460-char remark
Show marketing remark (460 chars)
Come take a look at this 3 bedroom, 1 full bath home on a 0.7 acre lot in East Taylor! Detached two car garage with spacious second floor workshop or storage area. Kitchen, separate Dining Room and large Living Room with coat closet. Hardwood under carpeting. Replacement windows throughout and newer doors. Newer furnace. Basement professionally waterproofed in 2015. Reasonable taxes. Lots of potential! Don't miss your chance to tour this priced right home!
-
2016-05-12soldstatus $63,500
ⓘ Source: listings_history table (triggers on properties + properties_extension) + one-shot
backfill from property_details.listing_events for pre-trigger history.
Tax reassessment forecast PA · Partial reset (capped growth)
- Current annual tax
- $947 · $79/mo
- Projected year-2 tax
- $1,422 · $118/mo
- Expected delta
- +$474/yr (+$40/mo · 50.1%)
ⓘ Screening estimate from a state-policy table — verify with the county assessor before closing.
Climate risk First Street
- Flood 1/10 Low FEMA zone X (unshaded) · 0% chance over 30 yrs
- Wildfire 2/10 Low
- Heat 2/10 Low 7 d/yr ≥93°F today · 16 d/yr by 30 yrs out
- Wind 2/10 Low
- Air quality 3/10 Moderate 2 unhealthy d/yr today · 3 by 30 yrs out
Nearby sold comps map
Loading sold comps map…
Walkable amenities ~0.75 mi
Loading nearby amenities…
Taxation est. · year 1
- Rental income
- $13,479
- − Mortgage interest
- −$6,722
- − Property taxes
- −$947
- − Insurance
- −$600
- − Repairs & maintenance
- −$1,078
- − Management
- −$1,078
- − Depreciation
- −$3,491
- Taxable loss
- −$438
- Est. tax savings @ 24.0%
- +$105
- After-tax cash flow
- $1,654/yr
For passive investors: Depreciation is non-cash, so a rental often shows a tax loss while cash-flowing — sheltering income. Rental losses are passive: they offset passive income freely, and up to $25,000/yr can offset ordinary (W-2) income if you actively participate and your MAGI is under $100k (phasing out to $0 by $150k); unused losses carry forward. On sale, claimed depreciation is recaptured at up to 25%, and gains may owe capital-gains tax (a 1031 exchange can defer both). Figures are a year-1 estimate at your 24.0% rate — not tax advice; consult a CPA.
Schools (NCES district)
- District
- Conemaugh Valley SD
- NCES district ID
- 4206430
- Math proficiency
- 30% ▼ -18.00%
- Reading proficiency
- 56% ▼ -11.00%
- Median HH income
- $42,523
- Composite
- 36.16/100
- National rank
- #4739
- State rank
- #313 of 539 in PA
Livability — Parkhill
No livability data for this city. (Only ~50 U.S. cities are tracked.)
Census & demographics
- City population
- 162
- Population (ZIP)
- 4,850
Population outlook (Cambria County) Hauer SSP2
- Today (2025)
- 122,754 people
- By 2030
- 115,827 · -5.6%
- By 2040
- 101,309 · -17.5%
- By 2050
- 88,379 · -28.0%
- By 2075
- 65,237 · -46.9%
- By 2100
- 46,909 · -61.8%
Race, ethnicity, and origin ACS 2023
- Neighborhood character
- Predominantly White (95%)
- Race & ethnicity
- White 95% Two or more races 3% Hispanic / Latino 2%
- Common ancestry
- Romanian 13% Polish 2% Slovak 2%
- Foreign-born
- 0%
- Languages at home
- 99% English-only · Spanish 1%
Political lean MEDSL · Cambria
- 2024 margin
- Solid R (+39.7) · D 29.8% · R 69.5%
- 2008→2024 swing
- -40.4pp toward R · 2008: 0.7pp · 2024: -39.7pp
- All cycles
- 2024: R+39.7 2020: R+37.3 2016: R+37.8 2012: R+17.8 2008: D+0.7
Not yet ingested
- Civics
- —
Market trends
- HPI YoY
- ▲ 3.56%
- Current HPI
- 150.8221
- Rent YoY
- —
- Metro
- —
- State GDP YoY
- ▲ 1.68%
- F500 in state
- 34
Industry mix (Fortune 500 HQ in PA)
| Industry | F500 HQs | Revenue |
|---|---|---|
| Healthcare | 2 | $309B |
|
||
| Insurance | 2 | $27B |
|
||
| Telecommunications / Media | 1 | $124B |
|
||
| Industrial Distribution | 1 | $22B |
|
||
| Financial Services | 1 | $20B |
|
||
| Chemicals / Materials | 1 | $18B |
|
||
Price history
+81.1% since first listed7 events — show timeline
- 2026-04-05 Pending — CSMLS
- 2026-04-01 Relisted — CSMLS
- 2026-04-01 Price Changed $115,000 CSMLS
- 2025-12-08 Price Changed $124,500 CSMLS
- 2025-09-29 Listed $129,900 CSMLS
- 2016-05-16 Sold (MLS) $63,500 CSMLS
- 2016-05-12 Sold (Public Records) $63,500 Public Records
Property tax history
+1.2%/yrLatest (2026): $947 · +0.0% YoY. Source: county tax records.
Cash-flow waterfall
monthlySold comps — $/sqft
last 12 mo · ≤1 miLoading sold comps…