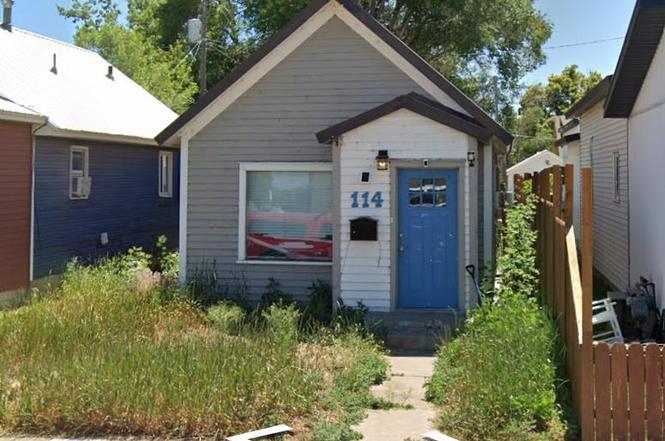
114 2nd St · Idaho Falls, ID
Flood risk No data
- FEMA flood zone
- —
- Chance of flooding over 30 yrs
- —
- Est. flood insurance / yr
- —
Fire risk No data
- Est. fire insurance / yr
- —
Heat risk No data
- Hot days now (above threshold)
- —
- Hot days in 30 yrs
- —
Wind risk No data
- Chance of severe wind over 30 yrs
- —
Air-quality risk No data
- Unhealthy air days now
- —
- Unhealthy air days in 30 yrs
- —
Risk factors via First Street. Map © Google.
Why this score? — see what drove the D grade
The composite is a weighted blend of 9 inputs, each scored 0–100. Each bar is that input's sub-score; the figure is the points it added to the 100-point composite (weight × sub-score).
- Cash flow +14.7/30.0
- ARV discount +7.5/15.0
- DSCR +4.5/10.0
- Livability +4.3/5.0
- Schools +3.7/10.0
- 1% rule +3.3/10.0
- Rent growth +2.6/5.0
- Condition / age +2.5/5.0
- Appreciation +0.0/10.0
$110,500
🖨 Deal sheet (PDF) 📄 Offer letter ✓ Due diligence
Listing remarks MLS
Adorable home!!! Come check out this completely remodeled home !!! The kitchen features brand new cabinets, gorgeous glass back splash, new counter tops, stainless steel appliances, and brand new plank flooring! Check out the bathroom with a large tile shower, plank flooring, and brand new vanity! The living room features a ship lap wall, brand new carpet and new paint!!!
Key facts
- Manageable yard
- Functional interior
- Cozy layout
Tags
Neighborhood map
What this means for you Summary
Snapshot
- This is a 1-bed/1.0-bath single-family listed at $110k.
Deal economics
- At list price, monthly cash flow is $27 ($328/yr) — positive.
- The deal already cash-flows at list — no discount required.
- To meet the 1% rule (rent ≥ 1% of price), the offer needs to be $91k (17.4% below list).
- Recommended offer: $91k (17.4% below list) — sets the bar for 1% rule.
Location & tenants
- Location reads 86/100 on livability (#3 in ID, #428 nationally) — a professional / high-income tenant draw. Strengths: amenities A+, cost of living A+, housing A+.
- Idaho Falls District (urban): math 36% / reading 50% proficiency, ranked #54 of 92 in ID (top 59%) — families likely to look elsewhere, expect single-tenant / working-renter base with shorter leases.
- Zoned schools: Dora Erickson Elementary School (math 22% / reading 37%, grade F, #306 of 357 statewide, top 88%, 450 students, 75% FRL); Taylorview Middle School (math 39% / reading 57%, grade C-, #39 of 109 statewide, top 36%, 776 students, 34% FRL); Idaho Falls Senior High School (math 27% / reading 57%, grade F, #72 of 169 statewide, top 47%, 1,334 students, 23% FRL) — zoned schools at 44% FRL track the district average.
- Market conditions: Rents flat; 401 active listings in the ZIP; 12 comparable units currently listed for rent nearby; rentals at typical pace (median 15d on market — plan ~3-4 weeks tenant-placement turnaround); solid renter incomes; 2,253 units permitted in Bonneville County in 2024 (1,051 in 5+ unit buildings).
- This rent is only 14% of the median local income ($78k/yr) — well below the 30% rent-burden line; pricing power to push rent on renewal without tenant pushback.
Forward outlook
- Local home prices are declining (-3.0%/yr); year-one equity from $764 of loan paydown is wiped out by about $3k of value loss. Plan a longer hold.
- Bonneville County population projected at +18% by 2050 — long-run rental-demand tailwind backs the buy-and-hold thesis.
Negotiation context
- It's been on market 68 days — a 6% lower offer ($104k) is reasonable based on typical stale-listing flexibility.
- 3 sale attempts since 8y ago with the ask held roughly flat each time — persistent listings suggest the price (not the market) is what's stuck; bring a comps-based counter.
Risks & watch-outs
- Watch-outs: built in 1920 — expect roof / HVAC / electrical / plumbing capex.
Questions for the listing agent
- It's been on market 68 days. Have you received any prior offers? Is the seller open to a 17% concession, seller financing, or rate buy-down credit?
- Built in 1920 — when were the roof, HVAC, electrical panel, plumbing, and water heater last replaced?
- Why hasn't it sold? Are there any deal-killer items the seller is aware of (foundation, flood, title, zoning, code violations)?
- Is there a deadline driving the sale (1031 exchange, divorce, estate, relocation)? That informs how much negotiation room exists.
- The area grade is low — what's the realistic commute time and amenity access for the typical tenant pool here? Any planned neighborhood developments (good or bad) we should know about?
- What's the average days-on-market for RENTAL listings here right now (not sales)? A rising rental-DOM trend means longer vacancies and softer asking-rent achievability than the comps imply.
- What's the recent tenant-quality profile in this submarket — average credit score on applications, eviction rate, late-payment / NSF rate, and stable-employment percentage? A property-management company in the area should have these aggregated.
- How much new for-sale + rental construction is in the pipeline within 1–3 miles? Heavy new supply typically softens prices + rents 12–24 months out; constrained supply supports both.
Investment metrics
- 1% rule
- 0.83% ✗
- Cap rate
- 6.59%
- Cash-on-cash
- 1.06%
- DSCR
- 1.05
- GRM
- 10.1
CMA / ARV
No comps found within radius.
Projected returns pro-forma
-3.0% appreciation · 0.51% rent growth · sell at horizon
- IRR
- -17.2%
- Equity multiple
- 0.40×
- Total profit
- $-18,426
- Equity at exit
- $16,476
- IRR
- -14.2%
- Equity multiple
- 0.27×
- Total profit
- $-22,636
- Equity at exit
- $9,554
Cash invested: $30,940 (down + closing). Projections, not guarantees.
Landlord ↔ Tenant lean methodology
- Overall (STATE)
- 91 Strongly Landlord-Friendly
- State Idaho
- 91 Strongly Landlord-Friendly · R+18
- County
- — inherits STATE
- City
- — inherits STATE
ZIP-level market 83401
- Home prices YoY
- -30.6%
- Rents YoY
- 0.5%
- Active inventory
- 401
- Price-to-rent
- 10.1×
Monthly cashflow live
- Estimated rent
- $913 high interval (Pro) →
- Mortgage (P&I)
- −$579
- Tax from tax record
- −$68 /mo · $821/yr
- Insurance
- −$46
- HOA
- −$0
- Vacancy / Maint / Mgmt
- −$192
- Net cashflow
- $27
Break-even live
Sensitivity live
| Price | -10% $90 | -5% $59 | +0% $27 | +5% $-4 | +10% $-35 |
|---|---|---|---|---|---|
| Rent | -10% $-45 | -5% $-9 | +0% $27 | +5% $63 | +10% $99 |
| Rate | -1.0pp $83 | -0.5pp $55 | base $27 | +0.5pp $-1 | +1.0pp $-30 |
UW: 25.0% down · 7.5% · 30yr · 1.5% tax · 5.0% vac · 8.0% maint · 8.0% mgmt
Financing live
Cash to close
- Down payment
- $27,625
- Closing costs
- $3,315
- Reserves months
- —
- Total cash needed
- —
Loan-product check · same deal, 3 products live
Conventional
25% down · 7.5% · 30yr
- Down + closing
- —
- Monthly P&I
- —
- Monthly cashflow
- —
- DSCR
- —
- Eligible?
- —
Personal DTI + credit; lowest rate.
DSCR
20% down · 8.5% · 30yr
- Down + closing
- —
- Monthly P&I
- —
- Monthly cashflow
- —
- DSCR
- —
- Eligible?
- —
No personal income docs; deal must DSCR.
Hard money
10% down · 12.0% · 12mo
- Down + closing
- —
- Monthly P&I
- —
- Monthly cashflow
- —
- DSCR
- —
- Eligible?
- —
Short-term bridge; refi at stabilization.
Rent comps 12 comps
| Address | Beds | Baths | Sqft | Rent | $/sqft | DOM | Units | Dist |
|---|---|---|---|---|---|---|---|---|
| 126 Whittier St Idaho Falls, ID | 1.0 | 1.0 | 400 | $800 | $2.00 | 15d | 1 | 0.48mi |
| 700 I St Unit 700-B Idaho Falls, ID | 1.0 | 1.0 | 730 | $700 | $0.96 | 15d | 1 | 0.50mi |
| 125 N Water Ave Unit 13 Idaho Falls, ID | 1.0 | 1.0 | 600 | $725 | $1.21 | 22d | 1 | 0.53mi |
| 403 Maple St #2 Idaho Falls, ID | — | 1.0 | 600 | $600 | $1.00 | 22d | 1 | 0.62mi |
| 433 Maple St #4 Idaho Falls, ID | 1.0 | 1.0 | 700 | $800 | $1.14 | 15d | 1 | 0.63mi |
| 615 Riverwalk Dr Idaho Falls, ID | 1.0–2.0 | 1.0–2.0 | 991 | $1,299 | $1.31 | 15d | 10 | 0.78mi |
| 1385 S Utah Ave Idaho Falls, ID | 2.0 | 1.0–2.0 | 747 | $1,544 | $2.07 | 15d | 12 | 0.88mi |
| 530 N Fanning Ave Idaho Falls, ID | 1.0–2.0 | 1.0 | 816 | $950 | $1.16 | 15d | 6 | 0.93mi |
| 437 W Crowley St Apt C Idaho Falls, ID | — | 1.0 | 360 | $650 | $1.81 | 22d | 1 | 0.95mi |
| 600 W Anderson St Idaho Falls, ID | 1.0–3.0 | 1.0–2.0 | 802 | $998 | $1.24 | 22d | 2 | 1.10mi |
| 1590 Bower Dr Idaho Falls, ID | 1.0–2.0 | 1.0–2.0 | 880 | $1,280 | $1.45 | 22d | 8 | 1.44mi |
| 1550 Teton View Ln Idaho Falls, ID | 1.0 | 1.0 | 600 | $870 | $1.45 | 15d | 1 | 1.46mi |
Listing history 6 events
-
2026-02-17status Pending
-
2025-11-18$110,500 Active
-
2019-10-04soldstatus 374-char remark
Show marketing remark (374 chars)
Adorable home!!! Come check out this completely remodeled home !!! The kitchen features brand new cabinets, gorgeous glass back splash, new counter tops, stainless steel appliances, and brand new plank flooring! Check out the bathroom with a large tile shower, plank flooring, and brand new vanity! The living room features a ship lap wall, brand new carpet and new paint!!!
-
2019-08-28$117,900 374-char remark
Show marketing remark (374 chars)
Adorable home!!! Come check out this completely remodeled home !!! The kitchen features brand new cabinets, gorgeous glass back splash, new counter tops, stainless steel appliances, and brand new plank flooring! Check out the bathroom with a large tile shower, plank flooring, and brand new vanity! The living room features a ship lap wall, brand new carpet and new paint!!!
-
2019-02-15soldstatus 129-char remark
Show marketing remark (129 chars)
Back on the market . . financing. The sale of 114 2nd will be in conjunction with the sale of Lots 22, 23, 24 and 120 2nd street.
-
2018-11-12$60,000 129-char remark
Show marketing remark (129 chars)
Back on the market . . financing. The sale of 114 2nd will be in conjunction with the sale of Lots 22, 23, 24 and 120 2nd street.
ⓘ Source: listings_history table (triggers on properties + properties_extension) + one-shot
backfill from property_details.listing_events for pre-trigger history.
Tax reassessment forecast ID · Resets to sale price
- Current annual tax
- $821 · $68/mo
- Projected year-2 tax
- $821 · $68/mo
- Expected delta
- $0/yr ($0/mo · 0.0%)
ⓘ Screening estimate from a state-policy table — verify with the county assessor before closing.
Nearby sold comps map
Loading sold comps map…
Walkable amenities ~0.75 mi
Loading nearby amenities…
Taxation est. · year 1
- Rental income
- $10,956
- − Mortgage interest
- −$6,190
- − Property taxes
- −$821
- − Insurance
- −$552
- − Repairs & maintenance
- −$876
- − Management
- −$876
- − Depreciation
- −$3,215
- Taxable loss
- −$1,575
- Est. tax savings @ 24.0%
- +$378
- After-tax cash flow
- $706/yr
For passive investors: Depreciation is non-cash, so a rental often shows a tax loss while cash-flowing — sheltering income. Rental losses are passive: they offset passive income freely, and up to $25,000/yr can offset ordinary (W-2) income if you actively participate and your MAGI is under $100k (phasing out to $0 by $150k); unused losses carry forward. On sale, claimed depreciation is recaptured at up to 25%, and gains may owe capital-gains tax (a 1031 exchange can defer both). Figures are a year-1 estimate at your 24.0% rate — not tax advice; consult a CPA.
Schools (NCES district)
- District
- Idaho Falls District
- NCES district ID
- 1601530
- Math proficiency
- 36% ▼ -2.00%
- Reading proficiency
- 50% ▲ 1.00%
- Median HH income
- $48,119
- Composite
- 36.75/100
- National rank
- #4581
- State rank
- #54 of 92 in ID
Livability — Idaho Falls
- Score
- 86/100
- State rank
- #3
- US rank
- #428
Category grades
Schools grade is shown separately in the Schools card above.
Census & demographics
- Census place
- Idaho Falls, ID
- County
- Bonneville County · 125,162 people
- City population
- 105,466
- Metro
- Idaho Falls, ID
- Population (ZIP)
- 47,972
- Household income
- $78,497
- Rent vs Own
- Severe rent burden
- 422.0
Population outlook (Bonneville County) Hauer SSP2
- Today (2025)
- 120,170 people
- By 2030
- 124,993 · +4.0%
- By 2040
- 134,091 · +11.6%
- By 2050
- 142,122 · +18.3%
- By 2075
- 157,767 · +31.3%
- By 2100
- 160,316 · +33.4%
Race, ethnicity, and origin ACS 2023
- Neighborhood character
- Predominantly White (80%)
- Race & ethnicity
- White 80% Hispanic / Latino 15% Two or more races 8%
- Hispanic origin (detail)
- Mexican 11% Puerto Rican 1%
- Common ancestry
- Italian 4% Slovak 3% Portuguese 2%
- Foreign-born
- 4% · Canada
- Languages at home
- 90% English-only · Spanish 9%
Political lean MEDSL · Bonneville
- 2024 margin
- Solid R (+45.4) · D 25.6% · R 71.0% · Other 3.4%
- 2008→2024 swing
- -2.4pp toward R · 2008: -43.0pp · 2024: -45.4pp
- All cycles
- 2024: R+45.4 2020: R+43.6 2016: R+40.2 2012: R+51.8 2008: R+43.0
Not yet ingested
- Civics
- —
Market trends
- HPI YoY
- ▼ -164.87%
- Current HPI
- 374.2807
- Rent YoY
- ▲ 0.51%
- Metro
- Idaho Falls, ID
- State GDP YoY
- ▲ 4.51%
- F500 in state
- 6
Industry mix (Fortune 500 HQ in ID)
| Industry | F500 HQs | Revenue |
|---|---|---|
| Retail | 1 | $79B |
|
||
| Technology | 1 | $25B |
|
||
| Food / Agriculture | 1 | $6B |
|
||
Price history
+84.2% since first listed6 events — show timeline
- 2026-02-17 Pending — SRMLS
- 2025-11-18 Listed $110,500 SRMLS
- 2019-10-04 Sold (MLS) — SRMLS
- 2019-08-28 Listed $117,900 SRMLS
- 2019-02-15 Sold (MLS) — SRMLS
- 2018-11-12 Listed $60,000 SRMLS
Property tax history
-2.4%/yrLatest (2025): $821 · +4.2% YoY. Source: county tax records.
Cash-flow waterfall
monthlySold comps — $/sqft
last 12 mo · ≤1 miLoading sold comps…