225 S Webb St · Hartwell, GA
Flood risk 1/10 · Minimal
- FEMA flood zone
- X (unshaded)
- Chance of flooding over 30 yrs
- 0.0%
- Est. flood insurance / yr
- $507 – $1,088
Fire risk 1/10 · Minimal
- Est. fire insurance / yr
- $963 – $1,789
Heat risk 5/10 · Moderate
- Hot days now (above 104°F)
- 7 days/yr
- Hot days in 30 yrs
- 17 days/yr
Wind risk 4/10 · Minor
- Chance of severe wind over 30 yrs
- 9.0%
Air-quality risk 3/10 · Minor
- Unhealthy air days now
- 2 days/yr
- Unhealthy air days in 30 yrs
- 4 days/yr
Risk factors via First Street. Map © Google.
Why this score? — see what drove the B- grade
The composite is a weighted blend of 9 inputs, each scored 0–100. Each bar is that input's sub-score; the figure is the points it added to the 100-point composite (weight × sub-score).
- Cash flow +26.4/30.0
- ARV discount +15.0/15.0
- DSCR +9.0/10.0
- 1% rule +6.0/10.0
- Livability +3.1/5.0
- Schools +2.7/10.0
- Rent growth +2.5/5.0
- Condition / age +2.5/5.0
- Appreciation +0.0/10.0
$130,000
🖨 Deal sheet 📄 Offer letter ✓ Due diligence
Listing remarks MLS
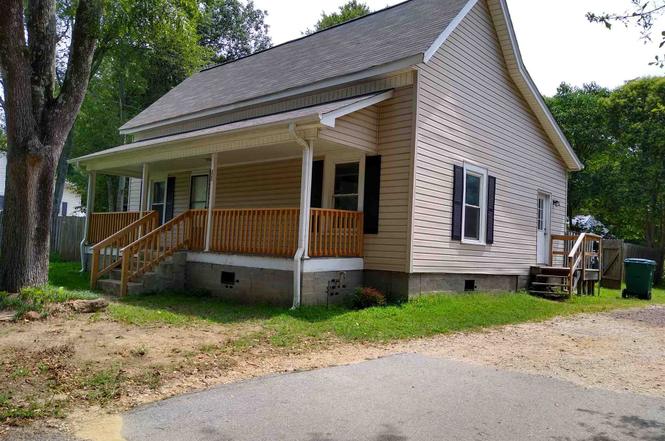
Great house for the price! Partially remodeled 2BR 2Bath on Webb St. In town and close to everything. Great starter home or rental property.
Key facts
- Covered front porch
- Fully renovated
- Historic mill house
Tags
Property features AI
Finance
- Other: Home warranty included
- HOA & community: No HOA
Exterior
- Parking: Open parking; Parking pad
- Utilities: Public water; Public sewer; Electricity available; Sewer connected; Water available
- Home design: Single-family house; Residential property; Built in 1896; One story
- Construction: Vinyl siding; Composition roof; Public records list building area as 1,072 square feet
- Exterior features: Level city lot
Interior
- Kitchen: Refrigerator included
- Bedrooms: 2 bedrooms on the main level
- Flooring: Carpet; Vinyl
- Bathrooms: 2 full bathrooms on the main level
- Heating & cooling: Central heating; Central air conditioning
- Interior features: Updated/remodeled condition; One-level layout; Public records list living area as 1,072 square feet; Crawl space basement; Mud room
- Laundry & utility: Laundry area (listed as laundry room/mud room)
Neighborhood map
What this means for you Summary
Snapshot
- This is a 2-bed/1.0-bath single-family listed at $130k.
Deal economics
- At list price, monthly cash flow is $340 ($4k/yr) — positive.
- The deal already cash-flows at list — no discount required.
- Meets the 1% rule at list price ($1k rent vs $130k).
- Recommended offer: $118k (9.0% below list) — sets the bar for market timing.
- Cap rate 9.4% vs local median 3.3% in Hartwell — top-decile yield for the area; either an underpriced asset or a hidden risk that comps aren't pricing in. Stress-test before assuming the spread holds.
Location & tenants
- Location reads 61/100 on livability (#342 in GA) — a middle-class / working-renter tenant base. Strengths: cost of living A+; Watch: housing C-, health & safety C-, schools D.
- Hart County (town): math 32% / reading 33% proficiency, ranked #82 of 174 in GA (top 47%) — families likely to look elsewhere, expect single-tenant / working-renter base with shorter leases.
- Market conditions: 281 active listings in the ZIP; 11 comparable units currently listed for rent nearby; rentals leasing fast (median 12d on market — plan ~1-2 weeks tenant-placement turnaround); 170 units permitted in Hart County in 2024 (8 in 5+ unit buildings).
Forward outlook
- Local home prices are declining (-3.0%/yr); year-one equity from $899 of loan paydown is wiped out by about $4k of value loss. Plan a longer hold.
- Hart County population projected to shrink 4% by 2050 — rents likely to lag national; underwrite the cash flow, not the appreciation.
- At projected returns (-3.0% appreciation + 3.0% rent growth), your $36k cash investment doubles in ~10 years — after that, you're playing with house money.
Negotiation context
- It's been on market 102 days — a 9% lower offer ($118k) is reasonable based on typical stale-listing flexibility.
- 5 sale attempts since 7y ago; this cycle's ask has dropped $10k (7%) from the opening price — seller is motivated, your offer sets the floor, not the list.
- Current owner paid $56k; list at $130k implies a 132% gain — meaningful room to come down on a strong offer.
Risks & watch-outs
- Watch-outs: built in 1896 — expect roof / HVAC / electrical / plumbing capex.
- Climate carrying-cost: extreme-heat days projected 7→17/yr by 2055 (HVAC capex compounding) — expect insurance premiums to compound above CPI over the hold.
Questions for the listing agent
- It's been on market 102 days. Have you received any prior offers? Is the seller open to a 9% concession, seller financing, or rate buy-down credit?
- Built in 1896 — when were the roof, HVAC, electrical panel, plumbing, and water heater last replaced?
- Why hasn't it sold? Are there any deal-killer items the seller is aware of (foundation, flood, title, zoning, code violations)?
- Is there a deadline driving the sale (1031 exchange, divorce, estate, relocation)? That informs how much negotiation room exists.
- Schools are D-rated, which usually means shorter tenancies and higher turnover. Who's the typical renter profile here, and what's been the actual vacancy rate?
- Crime grade is D in this area — have there been break-ins, vandalism, or insurance claims at this property in the last 3 years? What carrier currently insures it and at what premium?
- What's the average days-on-market for RENTAL listings here right now (not sales)? A rising rental-DOM trend means longer vacancies and softer asking-rent achievability than the comps imply.
- What's the recent tenant-quality profile in this submarket — average credit score on applications, eviction rate, late-payment / NSF rate, and stable-employment percentage? A property-management company in the area should have these aggregated.
- How much new for-sale + rental construction is in the pipeline within 1–3 miles? Heavy new supply typically softens prices + rents 12–24 months out; constrained supply supports both.
Investment metrics
- 1% rule
- 1.10% ✓
- Cap rate
- 9.43%
- Cash-on-cash
- 11.22%
- DSCR
- 1.50
- GRM
- 7.6
CMA / ARV
- ARV (on-the-fly)
- $177,952
- Comps found
- 8
Show comp detail 8 sales within ~0.75 mi
| Address | Dist | Beds/Ba | Sqft | Sold | Price | $/sf | Match |
|---|---|---|---|---|---|---|---|
| 225 S Webb St | 0.00mi | 2/2.0 | 1,072 (0%) | 1mo | $125,000 | $117 | 96 |
| 180 Liberty Cir | 0.10mi | 2/1.0 | 1,170 (+9%) | 1mo | $160,000 | $137 | 80 |
| 130 Liberty Cir | 0.09mi | 2/1.0 | 936 (-13%) | 3mo | $166,500 | $178 | 72 |
| 88 Thornton Dr | 0.60mi | 3/1.5 (+1) | 1,056 (-2%) | 5mo | $95,000 | $90 | 59 |
| 44 Kelsey Dr | 0.66mi | 3/1.0 (+1) | 1,112 (+4%) | 10mo | $184,900 | $166 | 50 |
| 150 Dogwood St | 0.56mi | 3/2.0 (+1) | 1,176 (+10%) | 13mo | $200,000 | $170 | 38 |
| 29 Thornton Dr | 0.65mi | 3/1.0 (+1) | 980 (-9%) | 18mo | $178,500 | $182 | 36 |
| 45 Colfax St | 0.75mi | 3/1.0 (+1) | 982 (-8%) | 23mo | $55,000 | $56 | 27 |
Match score weights: distance 35% · size 25% · config 20% · recency 20%. Top-matched comps best support the ARV.
Projected returns pro-forma
-3.0% appreciation · 3.0% rent growth · sell at horizon
- IRR
- 0.4%
- Equity multiple
- 1.02×
- Total profit
- $564
- Equity at exit
- $19,383
- IRR
- 10.0%
- Equity multiple
- 1.78×
- Total profit
- $28,213
- Equity at exit
- $11,240
Cash invested: $36,400 (down + closing). Projections, not guarantees.
Landlord ↔ Tenant lean methodology
- Overall (STATE)
- 90 Strongly Landlord-Friendly
- State Georgia
- 90 Strongly Landlord-Friendly · R+3
- County
- — inherits STATE
- City
- — inherits STATE
ZIP-level market 30643
- Home prices YoY
- -16.7%
- Active inventory
- 281
- Price-to-rent
- 7.6×
Monthly cashflow live
- Estimated rent
- $1,427 high interval (Pro) →
- Mortgage (P&I)
- −$682
- Tax from tax record
- −$51 /mo · $613/yr
- Insurance
- −$54
- HOA
- −$0
- Vacancy / Maint / Mgmt
- −$300
- Net cashflow
- $340
Break-even live
UW: 25.0% down · 7.5% · 30yr · 1.5% tax · 5.0% vac · 8.0% maint · 8.0% mgmt
Financing live
Cash to close
- Down payment
- $32,500
- Closing costs
- $3,900
- Reserves months
- —
- Total cash needed
- —
Loan-product check · same deal, 3 products live
Conventional
25% down · 7.5% · 30yr
- Down + closing
- —
- Monthly P&I
- —
- Monthly cashflow
- —
- DSCR
- —
- Eligible?
- —
Personal DTI + credit; lowest rate.
DSCR
20% down · 8.5% · 30yr
- Down + closing
- —
- Monthly P&I
- —
- Monthly cashflow
- —
- DSCR
- —
- Eligible?
- —
No personal income docs; deal must DSCR.
Hard money
10% down · 12.0% · 12mo
- Down + closing
- —
- Monthly P&I
- —
- Monthly cashflow
- —
- DSCR
- —
- Eligible?
- —
Short-term bridge; refi at stabilization.
Rent comps 11 comps
| Address | Beds | Baths | Sqft | Rent | $/sqft | DOM | Units | Dist |
|---|---|---|---|---|---|---|---|---|
| 34 Depot St Unit 11 Hartwell, GA | 1.0 | 1.0 | 832 | $1,500 | $1.80 | 11d | 1 | 0.22mi |
| 34 Depot St Unit 11 Hartwell, GA | 1.0 | 1.0 | 870 | $1,500 | $1.72 | 21d | 1 | 0.22mi |
| 291 W Johnson St Unit 401 Hartwell, GA | 2.0 | 1.5 | 900 | $1,200 | $1.33 | 21d | 1 | 0.36mi |
| 186 Maret St Hartwell, GA | 3.0 | 2.0 | 1200 | $1,500 | $1.25 | 43d | 1 | 0.37mi |
| 249 N Carter St Hartwell, GA | 2.0 | 1.0 | 829 | $1,400 | $1.69 | 3d | 1 | 0.51mi |
| 250 N Forest Ave Hartwell, GA | 2.0 | 2.0 | 1092 | $1,450 | $1.33 | 11d | 1 | 0.52mi |
| 249 N Carter St Unit C Hartwell, GA | 2.0 | 1.0 | 829 | $1,400 | $1.69 | 11d | 1 | 0.53mi |
| 125 Cayuga St Unit A Hartwell, GA | 2.0 | 2.0 | 900 | $1,350 | $1.50 | 11d | 1 | 0.75mi |
| 188 Vickery St Unit B Hartwell, GA | 2.0 | 2.0 | 900 | $1,350 | $1.50 | 3d | 1 | 0.75mi |
| 135 Fairview Ave Hartwell, GA | 2.0 | 1.0 | 996 | $1,200 | $1.20 | 11d | 1 | 0.99mi |
| 234 Bowers Estates Rd Hartwell, GA | 3.0 | 3.0 | 1500 | $1,850 | $1.23 | 43d | 1 | 1.16mi |
Listing history 16 events
-
2026-05-09status Under Contract
-
2026-05-08status Back On Market
-
2026-04-30historical
-
2026-04-13price $130,000
-
2026-04-03price $140,000
-
2026-02-06price $145,000
-
2026-01-19$140,000 New
-
2025-08-09historical $1,280
-
2025-08-05price $1,280
-
2025-08-01price $1,275
-
2025-07-16$1,300
-
2025-01-22historical $1,200
-
2025-01-14$1,200
-
2019-07-29soldstatus $56,000
-
2019-07-23soldstatus $56,000 141-char remark
Show marketing remark (141 chars)
Great house for the price! Partially remodeled 2BR 2Bath on Webb St. In town and close to everything. Great starter home or rental property.
-
2019-01-31$58,000 141-char remark
Show marketing remark (141 chars)
Great house for the price! Partially remodeled 2BR 2Bath on Webb St. In town and close to everything. Great starter home or rental property.
ⓘ Source: listings_history table (triggers on properties + properties_extension) + one-shot
backfill from property_details.listing_events for pre-trigger history.
Tax reassessment forecast GA · Resets to sale price
- Current annual tax
- $613 · $51/mo
- Projected year-2 tax
- $1,196 · $100/mo
- Expected delta
- +$583/yr (+$49/mo · 95.2%)
ⓘ Screening estimate from a state-policy table — verify with the county assessor before closing.
Climate risk First Street
- Flood 1/10 Low FEMA zone X (unshaded) · 0% chance over 30 yrs
- Wildfire 1/10 Low
- Heat 5/10 Major 7 d/yr ≥104°F today · 17 d/yr by 30 yrs out
- Wind 4/10 Moderate 9% chance of damaging wind over 30 yrs
- Air quality 3/10 Moderate 2 unhealthy d/yr today · 4 by 30 yrs out
Nearby sold comps map
Loading sold comps map…
Walkable amenities ~0.75 mi
Loading nearby amenities…
Taxation est. · year 1
- Rental income
- $17,123
- − Mortgage interest
- −$7,282
- − Property taxes
- −$613
- − Insurance
- −$650
- − Repairs & maintenance
- −$1,370
- − Management
- −$1,370
- − Depreciation
- −$3,782
- Taxable income
- $2,057
- Est. tax owed @ 24.0%
- −$494
- After-tax cash flow
- $3,590/yr
For passive investors: Depreciation is non-cash, so a rental often shows a tax loss while cash-flowing — sheltering income. Rental losses are passive: they offset passive income freely, and up to $25,000/yr can offset ordinary (W-2) income if you actively participate and your MAGI is under $100k (phasing out to $0 by $150k); unused losses carry forward. On sale, claimed depreciation is recaptured at up to 25%, and gains may owe capital-gains tax (a 1031 exchange can defer both). Figures are a year-1 estimate at your 24.0% rate — not tax advice; consult a CPA.
Schools (NCES district)
- District
- Hart County
- NCES district ID
- 1302730
- Math proficiency
- 32% ▼ -6.00%
- Reading proficiency
- 33% ▼ -6.00%
- Median HH income
- $37,494
- Composite
- 27.08/100
- National rank
- #7047
- State rank
- #82 of 174 in GA
Livability — Hartwell
- Score
- 61/100
- State rank
- #342
- US rank
- #17731
Category grades
Schools grade is shown separately in the Schools card above.
Census & demographics
- Census place
- Hartwell, GA
- Population (ZIP)
- 16,520
Population outlook (Hart County) Hauer SSP2
- Today (2025)
- 25,855 people
- By 2030
- 25,887 · +0.1%
- By 2040
- 25,627 · -0.9%
- By 2050
- 24,939 · -3.5%
- By 2075
- 23,150 · -10.5%
- By 2100
- 19,492 · -24.6%
Race, ethnicity, and origin ACS 2023
- Neighborhood character
- Predominantly White (71%)
- Race & ethnicity
- White 71% Black 22% Two or more races 6% Hispanic / Latino 1%
- Common ancestry
- Slovak 2% Lithuanian 2% Romanian 2%
- Foreign-born
- 1% · Canada
- Languages at home
- 98% English-only · Spanish 1%
Political lean MEDSL · Hart
- 2024 margin
- Solid R (+54.8) · D 22.4% · R 77.2%
- 2008→2024 swing
- -23.1pp toward R · 2008: -31.7pp · 2024: -54.8pp
- All cycles
- 2024: R+54.8 2020: R+49.6 2016: R+46.7 2012: R+38.4 2008: R+31.7
Not yet ingested
- Civics
- —
Market trends
- HPI YoY
- ▼ -59.98%
- Current HPI
- 299.7363
- Rent YoY
- —
- Metro
- —
- State GDP YoY
- ▲ 2.66%
- F500 in state
- 28
Industry mix (Fortune 500 HQ in GA)
| Industry | F500 HQs | Revenue |
|---|---|---|
| Paper / Packaging | 2 | $29B |
|
||
| Retail | 1 | $160B |
|
||
| Transportation / Logistics | 1 | $91B |
|
||
| Airlines | 1 | $62B |
|
||
| Consumer Goods | 1 | $47B |
|
||
| Utilities | 1 | $25B |
|
||
Price history
+124.1% since first listed16 events — show timeline
- 2026-05-09 Pending — GAMLS
- 2026-05-08 Relisted — GAMLS
- 2026-04-30 Listing Removed — GAMLS
- 2026-04-13 Price Changed $130,000 GAMLS
- 2026-04-03 Price Changed $140,000 GAMLS
- 2026-02-06 Price Changed $145,000 GAMLS
- 2026-01-19 Listed $140,000 GAMLS
- 2025-08-09 Rental Removed $1,280 GAMLS
- 2025-08-05 Price Changed $1,280 GAMLS
- 2025-08-01 Price Changed $1,275 GAMLS
- 2025-07-16 Listed for Rent $1,300 GAMLS
- 2025-01-22 Rental Removed $1,200 GAMLS
- 2025-01-14 Listed for Rent $1,200 GAMLS
- 2019-07-29 Sold (Public Records) $56,000 Public Records
- 2019-07-23 Sold (MLS) $56,000 GAMLS
- 2019-01-31 Listed $58,000 GAMLS
Property tax history
+7.9%/yrLatest (2025): $613 · -2.4% YoY. Source: county tax records.
Cash-flow waterfall
monthlySold comps — $/sqft
last 12 mo · ≤1 miLoading sold comps…