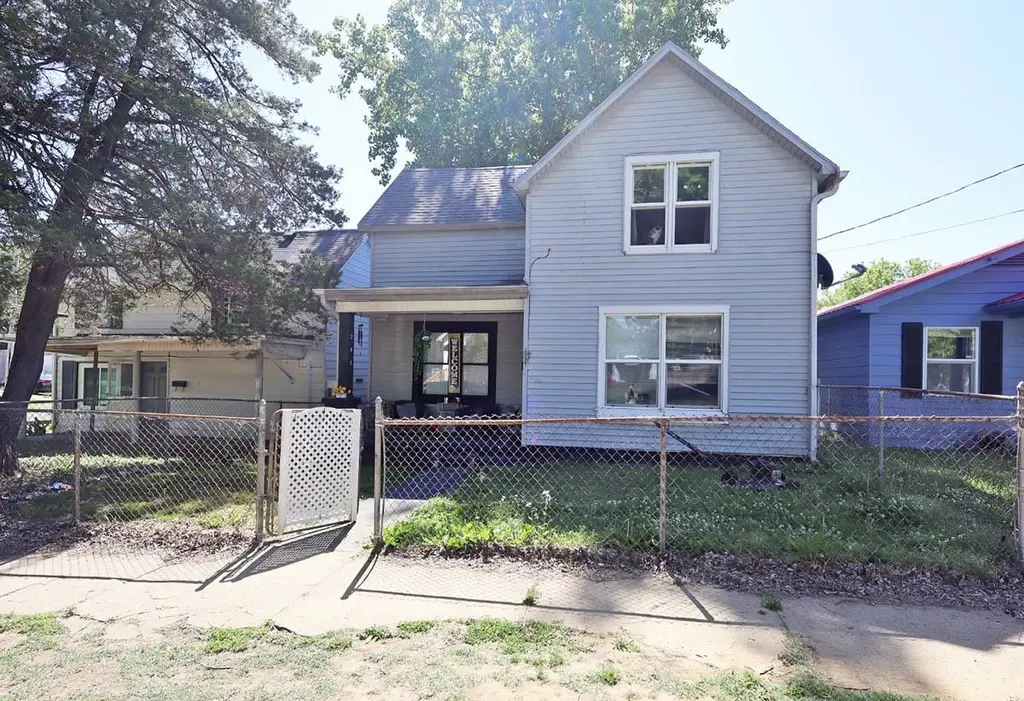
702 Letcher St · Henderson, KY
Flood risk 1/10 · Minimal
- FEMA flood zone
- X (unshaded)
- Chance of flooding over 30 yrs
- 0.0%
- Est. flood insurance / yr
- $507 – $1,088
Fire risk 1/10 · Minimal
- Est. fire insurance / yr
- $839 – $1,559
Heat risk 5/10 · Moderate
- Hot days now (above 107°F)
- 7 days/yr
- Hot days in 30 yrs
- 19 days/yr
Wind risk 2/10 · Minimal
- Chance of severe wind over 30 yrs
- 4.0%
Air-quality risk 3/10 · Minor
- Unhealthy air days now
- 2 days/yr
- Unhealthy air days in 30 yrs
- 3 days/yr
Risk factors via First Street. Map © Google.
Why this score? — see what drove the D grade
The composite is a weighted blend of 9 inputs, each scored 0–100. Each bar is that input's sub-score; the figure is the points it added to the 100-point composite (weight × sub-score).
- Cash flow +15.7/30.0
- ARV discount +7.5/15.0
- DSCR +4.8/10.0
- Livability +3.7/5.0
- 1% rule +3.6/10.0
- Schools +3.4/10.0
- Rent growth +2.5/5.0
- Condition / age +2.5/5.0
- Appreciation +0.0/10.0
$128,000
🖨 Deal sheet (PDF) 📄 Offer letter ✓ Due diligence
Listing remarks
If you've been dreaming of homeownership, this charming 3-bedroom, 1-bath, 2-story home could be the perfect place to start. Recent updates include a freshly painted living room and new landscaping that adds great curb appeal and a welcoming first impression. Inside, you'll find two separate living areas, giving you the flexibility to create a family room, home office, playroom, or entertainment space. The functional layout offers plenty of room to grow while still maintaining a cozy feel. While there are still opportunities to add your own personal touches over time, many of the big first impressions have already been refreshed. Why keep paying rent when you can start building equity in a
Key facts
- 4,356 sq ft lot
- Built 1920
- Listed 38 days
Property features AI
Finance
- Other: Directions: Left on Clay from Green Street, then right on Letcher
Exterior
- Parking: Off-street parking
- Utilities: Public water; Public sewer
- Home design: Single-family residence (Residential property)
- Exterior features: Lot approximately 33.33 x 133 (about 0.1 acre)
Interior
- Bedrooms: One main-level bedroom
- Bathrooms: One full bathroom on the main level
- Heating & cooling: Has heating: Forced air
- Interior features: Forced air heating
Neighborhood map
What this means for you Summary
Snapshot
- This is a 3-bed/1.0-bath single-family listed at $128k.
Deal economics
- At list price, monthly cash flow is $57 ($681/yr) — positive.
- The deal already cash-flows at list — no discount required.
- To meet the 1% rule (rent ≥ 1% of price), the offer needs to be $110k (14.1% below list).
- Recommended offer: $110k (14.1% below list) — sets the bar for 1% rule.
Location & tenants
- Location reads 74/100 on livability (#114 in KY, #4,949 nationally) — a middle-class / working-renter tenant base. Strengths: cost of living A+, housing A+, health & safety A+; Watch: employment D, amenities F, commute F.
- Henderson County (suburban): math 40% / reading 41% proficiency, ranked #29 of 165 in KY (top 18%) — families likely to look elsewhere, expect single-tenant / working-renter base with shorter leases.
- Zoned schools: East Heights Elementary School (math 37% / reading 37%, grade F, #255 of 676 statewide, top 42%, 354 students, 54% FRL); Henderson County North Middle School (math 37% / reading 43%, grade F, #59 of 217 statewide, top 29%, 720 students, 54% FRL); Henderson County High School (math 33% / reading 33%, grade F, #94 of 254 statewide, top 37%, 1,958 students, 44% FRL) — zoned schools at 51% FRL track the district average.
- Market conditions: 231 active listings in the ZIP; 1 comparable units currently listed for rent nearby; 92 units permitted in Henderson County in 2024 (0 in 5+ unit buildings).
Forward outlook
- Local home prices are declining (-3.0%/yr); year-one equity from $885 of loan paydown is wiped out by about $4k of value loss. Plan a longer hold.
- Henderson County population projected to shrink 5% by 2050 — rents likely to lag national; underwrite the cash flow, not the appreciation.
Negotiation context
- It's been on market 38 days — a 3% lower offer ($124k) is reasonable based on typical stale-listing flexibility.
- 5 sale attempts since 18y ago with the ask held roughly flat each time — persistent listings suggest the price (not the market) is what's stuck; bring a comps-based counter.
- Current owner paid $94k; 36% above their basis — modest negotiation headroom, anchor on the comps not their cost.
Risks & watch-outs
- Watch-outs: built in 1920 — expect roof / HVAC / electrical / plumbing capex.
- Climate carrying-cost: extreme-heat days projected 7→19/yr by 2055 (HVAC capex compounding) — expect insurance premiums to compound above CPI over the hold.
Questions for the listing agent
- It's been on market 38 days. Have you received any prior offers? Is the seller open to a 14% concession, seller financing, or rate buy-down credit?
- Built in 1920 — when were the roof, HVAC, electrical panel, plumbing, and water heater last replaced?
- Is there a deadline driving the sale (1031 exchange, divorce, estate, relocation)? That informs how much negotiation room exists.
- The area grade is low — what's the realistic commute time and amenity access for the typical tenant pool here? Any planned neighborhood developments (good or bad) we should know about?
- What's the average days-on-market for RENTAL listings here right now (not sales)? A rising rental-DOM trend means longer vacancies and softer asking-rent achievability than the comps imply.
- What's the recent tenant-quality profile in this submarket — average credit score on applications, eviction rate, late-payment / NSF rate, and stable-employment percentage? A property-management company in the area should have these aggregated.
- How much new for-sale + rental construction is in the pipeline within 1–3 miles? Heavy new supply typically softens prices + rents 12–24 months out; constrained supply supports both.
Investment metrics
- 1% rule
- 0.86% ✗
- Cap rate
- 6.83%
- Cash-on-cash
- 1.90%
- DSCR
- 1.08
- GRM
- 9.7
CMA / ARV
No comps found within radius.
Projected returns pro-forma
-3.0% appreciation · 3.0% rent growth · sell at horizon
- IRR
- -13.3%
- Equity multiple
- 0.52×
- Total profit
- $-17,155
- Equity at exit
- $19,085
- IRR
- -4.4%
- Equity multiple
- 0.71×
- Total profit
- $-10,398
- Equity at exit
- $11,067
Cash invested: $35,840 (down + closing). Projections, not guarantees.
Landlord ↔ Tenant lean methodology
- Overall (STATE)
- 83 Strongly Landlord-Friendly
- State Kentucky
- 83 Strongly Landlord-Friendly · R+16
- County
- — inherits STATE
- City
- — inherits STATE
ZIP-level market 42420
- Home prices YoY
- -31.6%
- Active inventory
- 231
- Price-to-rent
- 9.7×
Monthly cashflow live
- Estimated rent
- $1,099 medium interval (Pro) →
- Mortgage (P&I)
- −$671
- Tax from tax record
- −$87 /mo · $1,042/yr
- Insurance
- −$53
- HOA
- −$0
- Vacancy / Maint / Mgmt
- −$231
- Net cashflow
- $57
Break-even live
Sensitivity live
| Price | -10% $129 | -5% $93 | +0% $57 | +5% $21 | +10% $-16 |
|---|---|---|---|---|---|
| Rent | -10% $-30 | -5% $13 | +0% $57 | +5% $100 | +10% $144 |
| Rate | -1.0pp $121 | -0.5pp $89 | base $57 | +0.5pp $24 | +1.0pp $-10 |
UW: 25.0% down · 7.5% · 30yr · 1.5% tax · 5.0% vac · 8.0% maint · 8.0% mgmt
Financing live
Cash to close
- Down payment
- $32,000
- Closing costs
- $3,840
- Reserves months
- —
- Total cash needed
- —
Loan-product check · same deal, 3 products live
Conventional
25% down · 7.5% · 30yr
- Down + closing
- —
- Monthly P&I
- —
- Monthly cashflow
- —
- DSCR
- —
- Eligible?
- —
Personal DTI + credit; lowest rate.
DSCR
20% down · 8.5% · 30yr
- Down + closing
- —
- Monthly P&I
- —
- Monthly cashflow
- —
- DSCR
- —
- Eligible?
- —
No personal income docs; deal must DSCR.
Hard money
10% down · 12.0% · 12mo
- Down + closing
- —
- Monthly P&I
- —
- Monthly cashflow
- —
- DSCR
- —
- Eligible?
- —
Short-term bridge; refi at stabilization.
Rent comps 1 comps
| Address | Beds | Baths | Sqft | Rent | $/sqft | DOM | Units | Dist |
|---|---|---|---|---|---|---|---|---|
| 500 Fair St Henderson, KY | 1.0–3.0 | 1.0 | 740 | $1,099 | $1.49 | 15d | 9 | 1.14mi |
Listing history 30 events
-
2026-06-21days on market $128,000 Active 38 DOM
-
2026-06-18days on market $128,000 Active 35 DOM
-
2026-06-17days on market $128,000 Active 34 DOM
-
2026-06-16price $128,000 Active 33 DOM
-
2026-06-16days on market $129,000 Active 33 DOM
-
2026-06-15days on market $129,000 Active 32 DOM
-
2026-06-14days on market $129,000 Active 30 DOM
-
2026-06-13days on market $129,000 Active 29 DOM
-
2026-06-10days on market $129,000 Active 27 DOM
-
2026-06-09days on market $129,000 Active 26 DOM
-
2026-06-08days on market $129,000 Active 25 DOM
-
2026-06-07days on market $129,000 Active 24 DOM
-
2026-06-05remarks 699-char remark
-
2026-06-05days on market $129,000 Active 21 DOM
-
2026-06-02days on market $129,000 Active 19 DOM
-
2026-06-01days on market $129,000 Active 18 DOM
-
2026-05-31days on market $129,000 Active 17 DOM
-
2026-05-30days on market $129,000 Active 16 DOM
-
2026-05-13$130,000 Active 558-char remark
-
2026-05-09price $130,000
-
2026-05-03price $132,500
-
2026-04-23$137,000 Active
-
2026-04-18price $138,900
-
2026-04-10$140,000 Active
-
2024-11-18soldstatus $94,000
-
2024-11-13soldstatus $94,000 Closed
-
2024-09-27status Pending
-
2024-09-20$89,900 Active
-
2008-09-17soldstatus $26,000
-
2008-08-15$25,000
ⓘ Source: listings_history table (triggers on properties + properties_extension) + one-shot
backfill from property_details.listing_events for pre-trigger history.
Tax reassessment forecast KY · Resets to sale price
- Current annual tax
- $1,042 · $87/mo
- Projected year-2 tax
- $1,101 · $92/mo
- Expected delta
- +$58/yr (+$5/mo · 5.6%)
ⓘ Screening estimate from a state-policy table — verify with the county assessor before closing.
Climate risk First Street
- Flood 1/10 Low FEMA zone X (unshaded) · 0% chance over 30 yrs
- Wildfire 1/10 Low
- Heat 5/10 Major 7 d/yr ≥107°F today · 19 d/yr by 30 yrs out
- Wind 2/10 Low 4% chance of damaging wind over 30 yrs
- Air quality 3/10 Moderate 2 unhealthy d/yr today · 3 by 30 yrs out
Nearby sold comps map
Loading sold comps map…
Walkable amenities ~0.75 mi
Loading nearby amenities…
Taxation est. · year 1
- Rental income
- $13,188
- − Mortgage interest
- −$7,170
- − Property taxes
- −$1,042
- − Insurance
- −$640
- − Repairs & maintenance
- −$1,055
- − Management
- −$1,055
- − Depreciation
- −$3,724
- Taxable loss
- −$1,498
- Est. tax savings @ 24.0%
- +$360
- After-tax cash flow
- $1,041/yr
For passive investors: Depreciation is non-cash, so a rental often shows a tax loss while cash-flowing — sheltering income. Rental losses are passive: they offset passive income freely, and up to $25,000/yr can offset ordinary (W-2) income if you actively participate and your MAGI is under $100k (phasing out to $0 by $150k); unused losses carry forward. On sale, claimed depreciation is recaptured at up to 25%, and gains may owe capital-gains tax (a 1031 exchange can defer both). Figures are a year-1 estimate at your 24.0% rate — not tax advice; consult a CPA.
Schools (NCES district)
- District
- Henderson County
- NCES district ID
- 2102710
- Math proficiency
- 40% ▼ -19.00%
- Reading proficiency
- 41% ▼ -16.00%
- Median HH income
- $41,772
- Composite
- 34.13/100
- National rank
- #5285
- State rank
- #29 of 165 in KY
Livability — Henderson
- Score
- 74/100
- State rank
- #114
- US rank
- #4949
Category grades
Schools grade is shown separately in the Schools card above.
Census & demographics
- Census place
- Henderson, KY
- Population (ZIP)
- 38,434
Population outlook (Henderson County) Hauer SSP2
- Today (2025)
- 46,910 people
- By 2030
- 46,841 · -0.1%
- By 2040
- 46,018 · -1.9%
- By 2050
- 44,390 · -5.4%
- By 2075
- 40,442 · -13.8%
- By 2100
- 33,538 · -28.5%
Race, ethnicity, and origin ACS 2023
- Neighborhood character
- Predominantly White (83%)
- Race & ethnicity
- White 83% Black 8% Two or more races 5% Hispanic / Latino 4%
- Common ancestry
- Slovak 2% Romanian 1% Italian 1%
- Foreign-born
- 1% · Canada
- Languages at home
- 97% English-only · Spanish 2%
Political lean MEDSL · Henderson
- 2024 margin
- Strong R (+29.2) · D 34.7% · R 64.0% · Other 1.3%
- 2008→2024 swing
- -31.9pp toward R · 2008: 2.6pp · 2024: -29.2pp
- All cycles
- 2024: R+29.2 2020: R+24.6 2016: R+27.7 2012: R+11.8 2008: D+2.6
Not yet ingested
- Civics
- —
Market trends
- HPI YoY
- ▼ -95.69%
- Current HPI
- 207.5676
- Rent YoY
- —
- Metro
- —
- State GDP YoY
- ▲ 1.81%
- F500 in state
- 4
Industry mix (Fortune 500 HQ in KY)
| Industry | F500 HQs | Revenue |
|---|---|---|
| Healthcare | 1 | $118B |
|
||
| Food / Beverage | 1 | $7B |
|
||
Price history
+412.0% since first listed14 events — show timeline
- 2026-06-16 Price Changed $128,000 HABOR
- 2026-05-27 Price Changed $129,000 HABOR
- 2026-05-13 Listed $130,000 HABOR
- 2026-05-09 Price Changed $130,000 HABOR
- 2026-05-03 Price Changed $132,500 HABOR
- 2026-04-23 Listed $137,000 HABOR
- 2026-04-18 Price Changed $138,900 HABOR
- 2026-04-10 Listed $140,000 HABOR
- 2024-11-18 Sold (Public Records) $94,000 Public Records
- 2024-11-13 Sold (MLS) $94,000 HABOR
- 2024-09-27 Pending — HABOR
- 2024-09-20 Listed $89,900 HABOR
- 2008-09-17 Sold (MLS) $26,000 Metro Search MLS
- 2008-08-15 Listed $25,000 Metro Search MLS
Property tax history
+10.1%/yrLatest (2025): $1,042 · +135.6% YoY. Source: county tax records.
Cash-flow waterfall
monthlySold comps — $/sqft
last 12 mo · ≤1 miLoading sold comps…