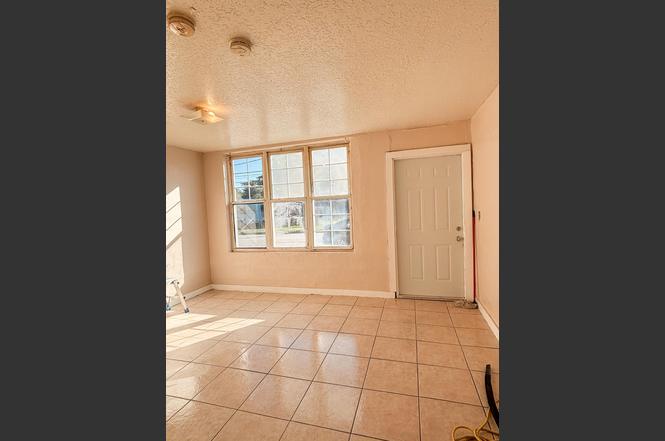
 Fourplex
433 N 9th St N · Fort Pierce, FL
Flood risk 5/10 · Moderate
- FEMA flood zone
- X (unshaded)
- Chance of flooding over 30 yrs
- 0.46%
- Est. flood insurance / yr
- $507 – $1,088
Fire risk 1/10 · Minimal
- Est. fire insurance / yr
- $947 – $1,759
Heat risk 10/10 · Severe
- Hot days now (above 106°F)
- 7 days/yr
- Hot days in 30 yrs
- 25 days/yr
Wind risk 10/10 · Severe
- Chance of severe wind over 30 yrs
- 99.0%
Air-quality risk 2/10 · Minimal
- Unhealthy air days now
- 2 days/yr
- Unhealthy air days in 30 yrs
- 2 days/yr
Risk factors via First Street. Map © Google.
Why this score? — see what drove the D+ grade
The composite is a weighted blend of 9 inputs, each scored 0–100. Each bar is that input's sub-score; the figure is the points it added to the 100-point composite (weight × sub-score).
- Cash flow +17.7/30.0
- ARV discount +7.5/15.0
- DSCR +5.5/10.0
- 1% rule +4.2/10.0
- Rent growth +4.0/5.0
- Livability +3.8/5.0
- Schools +3.7/10.0
- Condition / age +2.5/5.0
- Appreciation +0.0/10.0
$580,000
🖨 Deal sheet (PDF) 📄 Offer letter ✓ Due diligence
Multi-family units
County records classify this as Multi-Family (2-4 Unit). Listing-text estimate: 4 units. confirmed
Listing remarks MLS
Great investment property in Ft pierce Fl, total of 4 units , 3 of the units is a 2 bedrooms and 1 bathroom and 1 of the unit is 1 Room 1 Bathroom. NOI is $20,200 annually Cap Rate: 7.09% .
Key facts
- 5,000 sq ft lot
- Built 1958
- Listed 222 days
Property features AI
Finance
- Financial info: Gross income reported at $66,600; 4 total units (multifamily)
- HOA & community: No association amenities
Exterior
- Utilities: Public water; Public sewer; Three-phase electric; Sewer and water available
- Home design: Quadruplex; Resale property
- Construction: CBS construction; Tar/gravel roof; Building area approximately 1,974 (public records)
- Exterior features: Not waterfront
Interior
- Bedrooms: 4 total units (multifamily property)
- Flooring: Laminate; Tile
- Bathrooms: 4 bathrooms (total)
- Heating & cooling: Electric heating; Electric cooling; Property has heating and cooling
- Interior features: Laminate and tile flooring
Neighborhood map
What this means for you Summary
Snapshot
- This is a 3×2bd/1.0ba + 1×1bd/1.0ba units multifamily listed at $580k.
Deal economics
- At list price, monthly cash flow is $471 ($6k/yr) — positive. Per door: $118/mo.
- The deal already cash-flows at list — no discount required.
- To meet the 1% rule (rent ≥ 1% of price), the offer needs to be $534k (7.9% below list).
- Recommended offer: $510k (12.0% below list) — sets the bar for market timing.
- Cap rate 7.3% vs local median 3.5% in Fort Pierce — top-decile yield for the area; either an underpriced asset or a hidden risk that comps aren't pricing in. Stress-test before assuming the spread holds.
Location & tenants
- Location reads 76/100 on livability (#226 in FL, #3,360 nationally) — a middle-class / working-renter tenant base. Strengths: commute A+, cost of living A+, housing A+; Watch: crime D+, schools D, amenities F.
- St. Lucie (urban): math 40% / reading 48% proficiency, ranked #51 of 73 in FL (top 70%) — families likely to look elsewhere, expect single-tenant / working-renter base with shorter leases.
- Market conditions: Rents rising fast (+5.9%/yr); 165 active listings in the ZIP; 6 comparable units currently listed for rent nearby; rentals at typical pace (median 25d on market — plan ~3-4 weeks tenant-placement turnaround); lower-income renter base — watch delinquency; 4,868 units permitted in St. Lucie County in 2024 (268 in 5+ unit buildings).
- At $5,341/mo this rent would consume 211% of the median local household income ($30k/yr) (locally 1995% of renters already pay >50% of income on rent) — very limited rent-growth headroom before tenants either downsize or default.
Forward outlook
- Local home prices are declining (-3.0%/yr); year-one equity from $4k of loan paydown is wiped out by about $17k of value loss. Plan a longer hold.
- St. Lucie County population projected at +20% by 2050 — long-run rental-demand tailwind backs the buy-and-hold thesis.
Negotiation context
- It's been on market 223 days — a 12% lower offer ($510k) is reasonable based on typical stale-listing flexibility.
- 12 sale attempts since 18y ago with the ask held roughly flat each time — persistent listings suggest the price (not the market) is what's stuck; bring a comps-based counter.
- Current owner paid $285k; list at $580k implies a 104% gain — meaningful room to come down on a strong offer.
Risks & watch-outs
- Watch-outs: built in 1958 — expect roof / HVAC / electrical / plumbing capex.
- Climate carrying-cost: moderate flood risk; severe wind risk, 99% chance of damaging wind over 30y; extreme-heat days projected 7→25/yr by 2055 (HVAC capex compounding) — expect insurance premiums to compound above CPI over the hold.
Questions for the listing agent
- It's been on market 223 days. Have you received any prior offers? Is the seller open to a 12% concession, seller financing, or rate buy-down credit?
- Can we see the unit-by-unit rent roll, current vacancy, and any below-market leases? What's the average tenancy length?
- What capital expenditures (roof, boiler, parking lot, exteriors) have been made in the last 5 years, and what's planned in the next 2?
- Built in 1958 — when were the roof, HVAC, electrical panel, plumbing, and water heater last replaced?
- Why hasn't it sold? Are there any deal-killer items the seller is aware of (foundation, flood, title, zoning, code violations)?
- Is there a deadline driving the sale (1031 exchange, divorce, estate, relocation)? That informs how much negotiation room exists.
- Schools are D-rated, which usually means shorter tenancies and higher turnover. Who's the typical renter profile here, and what's been the actual vacancy rate?
- Crime grade is D in this area — have there been break-ins, vandalism, or insurance claims at this property in the last 3 years? What carrier currently insures it and at what premium?
- The area grade is low — what's the realistic commute time and amenity access for the typical tenant pool here? Any planned neighborhood developments (good or bad) we should know about?
- What's the average days-on-market for RENTAL listings here right now (not sales)? A rising rental-DOM trend means longer vacancies and softer asking-rent achievability than the comps imply.
- What's the recent tenant-quality profile in this submarket — average credit score on applications, eviction rate, late-payment / NSF rate, and stable-employment percentage? A property-management company in the area should have these aggregated.
- How much new apartment / multifamily construction is in the pipeline within 1–3 miles? Heavy new supply (>2% of stock underway) typically softens rents 12–24 months out; light construction supports rent growth.
Investment metrics
- 1% rule
- 0.92% ✗
- Cap rate
- 7.27%
- Cash-on-cash
- 3.48%
- DSCR
- 1.15
- GRM
- 9.0
CMA / ARV
- ARV (on-the-fly)
- $353,346
- Comps found
- 1
Show comp detail 1 sale within ~0.75 mi
| Address | Dist | Beds/Ba | Sqft | Sold | Price | $/sf | Match |
|---|---|---|---|---|---|---|---|
| 1706 Avenue D | 0.63mi | 5/4.0 (+1) | 1,700 (-14%) | 2mo | $305,000 | $179 | 41 |
Match score weights: distance 35% · size 25% · config 20% · recency 20%. Top-matched comps best support the ARV.
Projected returns pro-forma
-3.0% appreciation · 5.94% rent growth · sell at horizon
- IRR
- -7.8%
- Equity multiple
- 0.71×
- Total profit
- $-47,784
- Equity at exit
- $86,480
- IRR
- 5.0%
- Equity multiple
- 1.42×
- Total profit
- $67,611
- Equity at exit
- $50,148
Cash invested: $162,400 (down + closing). Projections, not guarantees.
Landlord ↔ Tenant lean methodology
- Overall (STATE)
- 87 Strongly Landlord-Friendly
- State Florida
- 87 Strongly Landlord-Friendly · R+3
- County
- — inherits STATE
- City
- — inherits STATE
ZIP-level market 34950
- Home prices YoY
- -20.2%
- Rents YoY
- 5.9%
- Active inventory
- 165
- Price-to-rent
- 35.8×
Monthly cashflow live
- Estimated rent
- $5,341 medium interval (Pro) →
- Mortgage (P&I)
- −$3,042
- Tax from tax record
- −$465 /mo · $5,578/yr
- Insurance
- −$242
- HOA
- −$0
- Vacancy / Maint / Mgmt
- −$1,122
- Net cashflow
- $471
Break-even live
Sensitivity live
| Price | -10% $800 | -5% $635 | +0% $471 | +5% $307 | +10% $143 |
|---|---|---|---|---|---|
| Rent | -10% $49 | -5% $260 | +0% $471 | +5% $682 | +10% $893 |
| Rate | -1.0pp $763 | -0.5pp $619 | base $471 | +0.5pp $321 | +1.0pp $168 |
4-unit breakdown (identical units grouped — click to expand)
| Units | Beds | Baths | Est. rent |
|---|---|---|---|
| 3× units | 2 | 1 | $4,053 |
| #1 | 2 | 1 | $1,351 |
| #2 | 2 | 1 | $1,351 |
| #3 | 2 | 1 | $1,351 |
| 1× unit | 1 | 1 | $1,287 |
| Total (4 units) | $5,341 | ||
UW: 25.0% down · 7.5% · 30yr · 1.5% tax · 5.0% vac · 8.0% maint · 8.0% mgmt
Financing live
Cash to close
- Down payment
- $145,000
- Closing costs
- $17,400
- Reserves months
- —
- Total cash needed
- —
Loan-product check · same deal, 3 products live
Conventional
25% down · 7.5% · 30yr
- Down + closing
- —
- Monthly P&I
- —
- Monthly cashflow
- —
- DSCR
- —
- Eligible?
- —
Personal DTI + credit; lowest rate.
DSCR
20% down · 8.5% · 30yr
- Down + closing
- —
- Monthly P&I
- —
- Monthly cashflow
- —
- DSCR
- —
- Eligible?
- —
No personal income docs; deal must DSCR.
Hard money
10% down · 12.0% · 12mo
- Down + closing
- —
- Monthly P&I
- —
- Monthly cashflow
- —
- DSCR
- —
- Eligible?
- —
Short-term bridge; refi at stabilization.
Rent comps 6 comps
| Address | Beds | Baths | Sqft | Rent | $/sqft | DOM | Units | Dist |
|---|---|---|---|---|---|---|---|---|
| 513 N 9th St Unit B Fort Pierce, FL | 3.0 | 2.0 | 1250 | $2,300 | $1.84 | 24d | 1 | 0.09mi |
| 311 N 11th St Fort Pierce, FL | 5.0 | 2.0 | 1616 | $3,000 | $1.86 | 15d | 1 | 0.24mi |
| 1102 Avenue G Fort Pierce, FL | 3.0 | 1.5 | 1870 | $1,800 | $0.96 | 24d | 1 | 0.33mi |
| 313 S 13th St Unit B Fort Pierce, FL | 5.0 | 3.0 | 1783 | $3,800 | $2.13 | 22d | 1 | 0.57mi |
| 318 N 24th St Fort Pierce, FL | 3.0 | 2.5 | 1952 | $2,600 | $1.33 | 24d | 1 | 1.03mi |
| 1701 Sunrise Blvd Fort Pierce, FL | 3.0 | 2.0 | 1518 | $2,000 | $1.32 | 15d | 1 | 1.42mi |
Listing history 50 events
-
2026-06-21days on market $580,000 Active 223 DOM
-
2026-06-18days on market $580,000 Active 220 DOM
-
2026-06-17days on market $580,000 Active 219 DOM
-
2026-06-16days on market $580,000 Active 218 DOM
-
2026-06-15days on market $580,000 Active 217 DOM
-
2026-06-14days on market $580,000 Active 215 DOM
-
2026-06-13days on market $580,000 Active 214 DOM
-
2026-06-10days on market $580,000 Active 212 DOM
-
2026-06-09days on market $580,000 Active 211 DOM
-
2026-06-08days on market $580,000 Active 210 DOM
-
2026-06-07days on market $580,000 Active 209 DOM
-
2026-06-05days on market $580,000 Active 206 DOM
-
2026-06-03days on market $580,000 Active 205 DOM
-
2026-06-02days on market $580,000 Active 204 DOM
-
2026-06-01days on market $580,000 Active 203 DOM
-
2026-05-31days on market $580,000 Active 202 DOM
-
2026-05-30days on market $580,000 Active 201 DOM
-
2025-11-10$580,000 Active
-
2024-07-22historical $1,350
-
2024-07-20historical $1,350
-
2024-07-13price $1,350
-
2024-07-13price $1,125
-
2024-07-01$1,175
-
2024-06-25$1,400
-
2024-03-01historical $1,200
-
2024-03-01$1,200
-
2023-07-11historical
-
2023-04-27soldstatus $285,000
-
2022-01-11soldstatus $250,000
-
2022-01-10soldstatus $283,900 Closed 189-char remark
Show marketing remark (189 chars)
Great investment property in Ft pierce Fl, total of 4 units , 3 of the units is a 2 bedrooms and 1 bathroom and 1 of the unit is 1 Room 1 Bathroom. NOI is $20,200 annually Cap Rate: 7.09% .
-
2021-11-16historical Active Under Contract 189-char remark
Show marketing remark (189 chars)
Great investment property in Ft pierce Fl, total of 4 units , 3 of the units is a 2 bedrooms and 1 bathroom and 1 of the unit is 1 Room 1 Bathroom. NOI is $20,200 annually Cap Rate: 7.09% .
-
2021-10-26price $283,900 189-char remark
Show marketing remark (189 chars)
Great investment property in Ft pierce Fl, total of 4 units , 3 of the units is a 2 bedrooms and 1 bathroom and 1 of the unit is 1 Room 1 Bathroom. NOI is $20,200 annually Cap Rate: 7.09% .
-
2021-09-28price $285,000 189-char remark
Show marketing remark (189 chars)
Great investment property in Ft pierce Fl, total of 4 units , 3 of the units is a 2 bedrooms and 1 bathroom and 1 of the unit is 1 Room 1 Bathroom. NOI is $20,200 annually Cap Rate: 7.09% .
-
2021-08-24price $299,000 189-char remark
Show marketing remark (189 chars)
Great investment property in Ft pierce Fl, total of 4 units , 3 of the units is a 2 bedrooms and 1 bathroom and 1 of the unit is 1 Room 1 Bathroom. NOI is $20,200 annually Cap Rate: 7.09% .
-
2021-08-24status Active 189-char remark
Show marketing remark (189 chars)
Great investment property in Ft pierce Fl, total of 4 units , 3 of the units is a 2 bedrooms and 1 bathroom and 1 of the unit is 1 Room 1 Bathroom. NOI is $20,200 annually Cap Rate: 7.09% .
-
2021-08-16status Pending 189-char remark
Show marketing remark (189 chars)
Great investment property in Ft pierce Fl, total of 4 units , 3 of the units is a 2 bedrooms and 1 bathroom and 1 of the unit is 1 Room 1 Bathroom. NOI is $20,200 annually Cap Rate: 7.09% .
-
2021-06-15$285,000 Active 189-char remark
Show marketing remark (189 chars)
Great investment property in Ft pierce Fl, total of 4 units , 3 of the units is a 2 bedrooms and 1 bathroom and 1 of the unit is 1 Room 1 Bathroom. NOI is $20,200 annually Cap Rate: 7.09% .
-
2020-01-22historical
-
2019-02-18$205,000 Active
-
2016-01-01historical
-
2015-07-24price $80,000
-
2015-04-14price $75,000
-
2014-08-07$70,000 Active
-
2012-03-15soldstatus $30,000
-
2011-09-21historical
-
2011-08-23$64,900
-
2010-04-23soldstatus $7,450
-
2010-04-02historical
-
2010-03-10$7,425
-
2008-11-03historical
ⓘ Source: listings_history table (triggers on properties + properties_extension) + one-shot
backfill from property_details.listing_events for pre-trigger history.
Tax reassessment forecast FL · Resets to sale price
- Current annual tax
- $5,578 · $465/mo
- Projected year-2 tax
- $5,578 · $465/mo
- Expected delta
- $0/yr ($0/mo · 0.0%)
ⓘ Screening estimate from a state-policy table — verify with the county assessor before closing.
Climate risk First Street
- Flood 5/10 Major FEMA zone X (unshaded) · 46% chance over 30 yrs
- Wildfire 1/10 Low
- Heat 10/10 Extreme 7 d/yr ≥106°F today · 25 d/yr by 30 yrs out
- Wind 10/10 Extreme 99% chance of damaging wind over 30 yrs
- Air quality 2/10 Low 2 unhealthy d/yr today · 2 by 30 yrs out
Nearby sold comps map
Loading sold comps map…
Walkable amenities ~0.75 mi
Loading nearby amenities…
Taxation est. · year 1
- Rental income
- $64,092
- − Mortgage interest
- −$32,489
- − Property taxes
- −$5,578
- − Insurance
- −$2,900
- − Repairs & maintenance
- −$5,127
- − Management
- −$5,127
- − Depreciation
- −$16,873
- Taxable loss
- −$4,003
- Est. tax savings @ 24.0%
- +$961
- After-tax cash flow
- $6,616/yr
For passive investors: Depreciation is non-cash, so a rental often shows a tax loss while cash-flowing — sheltering income. Rental losses are passive: they offset passive income freely, and up to $25,000/yr can offset ordinary (W-2) income if you actively participate and your MAGI is under $100k (phasing out to $0 by $150k); unused losses carry forward. On sale, claimed depreciation is recaptured at up to 25%, and gains may owe capital-gains tax (a 1031 exchange can defer both). Figures are a year-1 estimate at your 24.0% rate — not tax advice; consult a CPA.
Schools (NCES district)
- District
- St. Lucie
- NCES district ID
- 1201770
- Math proficiency
- 40% ▼ -11.00%
- Reading proficiency
- 48% ▼ -4.00%
- Median HH income
- $44,737
- Composite
- 37.28/100
- National rank
- #4449
- State rank
- #51 of 73 in FL
Livability — Fort Pierce
- Score
- 76/100
- State rank
- #226
- US rank
- #3360
Category grades
Schools grade is shown separately in the Schools card above.
Census & demographics
- Census place
- Fort Pierce, FL
- County
- Saint Lucie County · 337,150 people
- City population
- 78,556
- Metro
- Port St. Lucie, FL
- Population (ZIP)
- 17,461
- Household income
- $30,400
- Rent vs Own
- Severe rent burden
- 1995.0
Population outlook (St. Lucie County) Hauer SSP2
- Today (2025)
- 338,016 people
- By 2030
- 355,687 · +5.2%
- By 2040
- 385,521 · +14.1%
- By 2050
- 406,106 · +20.1%
- By 2075
- 441,054 · +30.5%
- By 2100
- 436,885 · +29.2%
Race, ethnicity, and origin ACS 2023
- Neighborhood character
- Majority Black (63%)
- Race & ethnicity
- Black 63% Hispanic / Latino 19% White 17% Two or more races 10%
- Hispanic origin (detail)
- Mexican 10% Puerto Rican 2% Cuban 1%
- Common ancestry
- Hispanic 17% Portuguese 1%
- Foreign-born
- 23% · Canada
- Languages at home
- 69% English-only · Spanish 14% French/Haitian/Cajun 12% Other Indo-European 4%
Political lean MEDSL · St. Lucie
- 2024 margin
- Lean R (+9.1) · D 45.1% · R 54.2%
- 2008→2024 swing
- -21.2pp toward R · 2008: 12.1pp · 2024: -9.1pp
- All cycles
- 2024: R+9.1 2020: R+1.6 2016: R+2.5 2012: D+7.9 2008: D+12.1
Not yet ingested
- Civics
- —
Market trends
- HPI YoY
- ▼ -97.20%
- Current HPI
- 384.8532
- Rent YoY
- ▲ 5.94%
- Metro
- Port St. Lucie, FL
- State GDP YoY
- ▲ 3.28%
- F500 in state
- 36
Industry mix (Fortune 500 HQ in FL)
| Industry | F500 HQs | Revenue |
|---|---|---|
| Industrial Technology | 2 | $29B |
|
||
| Insurance | 2 | $17B |
|
||
| Retail | 1 | $60B |
|
||
| Technology Distribution | 1 | $58B |
|
||
| Homebuilding | 1 | $35B |
|
||
| Technology Manufacturing | 1 | $35B |
|
||
Price history
+3766.7% since first listed38 events — show timeline
- 2025-11-10 Listed $580,000 Beaches MLS
- 2024-07-22 Rental Removed $1,350 RMLSFL
- 2024-07-20 Rental Removed $1,350 RMLSFL
- 2024-07-13 Price Changed $1,350 RMLSFL
- 2024-07-13 Price Changed $1,125 RMLSFL
- 2024-07-01 Listed for Rent $1,175 RMLSFL
- 2024-06-25 Listed for Rent $1,400 RMLSFL
- 2024-03-01 Rental Removed $1,200 RMLSFL
- 2024-03-01 Listed for Rent $1,200 RMLSFL
- 2023-07-11 Rental Removed — RMLSFL
- 2023-04-27 Sold (Public Records) $285,000 Public Records
- 2022-01-11 Sold (Public Records) $250,000 Public Records
- 2022-01-10 Sold (MLS) $283,900 Beaches MLS
- 2021-11-16 Contingent — Beaches MLS
- 2021-10-26 Price Changed $283,900 Beaches MLS
- 2021-09-28 Price Changed $285,000 Beaches MLS
- 2021-08-24 Price Changed $299,000 Beaches MLS
- 2021-08-24 Relisted — Beaches MLS
- 2021-08-16 Pending — Beaches MLS
- 2021-06-15 Listed $285,000 Beaches MLS
- 2020-01-22 Listing Removed — Beaches MLS
- 2019-02-18 Listed $205,000 Beaches MLS
- 2016-01-01 Listing Removed — Beaches MLS
- 2015-07-24 Price Changed $80,000 Beaches MLS
- 2015-04-14 Price Changed $75,000 Beaches MLS
- 2014-08-07 Listed $70,000 Beaches MLS
- 2012-03-15 Sold (Public Records) $30,000 Public Records
- 2011-09-21 Listing Removed — Beaches MLS
- 2011-08-23 Listed $64,900 Beaches MLS
- 2010-04-23 Sold (MLS) $7,450 Beaches MLS
- 2010-04-02 Listing Removed — Beaches MLS
- 2010-03-10 Listed $7,425 Beaches MLS
- 2008-11-03 Listing Removed — Beaches MLS
- 2008-06-13 Listed $169,600 Beaches MLS
- 2008-06-06 Listing Removed — Beaches MLS
- 2008-05-05 Listed $179,800 Beaches MLS
- 2005-09-09 Sold (Public Records) $180,000 Public Records
- 2004-06-03 Sold (Public Records) $15,000 Public Records
Property tax history
+17.0%/yrLatest (2025): $5,578 · +8.1% YoY. Source: county tax records.
Cash-flow waterfall
monthlySold comps — $/sqft
last 12 mo · ≤1 miLoading sold comps…