78200 Cortez Ln #143 · Indian Wells, CA
Flood risk 1/10 · Minimal
- FEMA flood zone
- X (shaded)
- Chance of flooding over 30 yrs
- 0.0%
- Est. flood insurance / yr
- $507 – $1,088
Fire risk 5/10 · Moderate
- Est. fire insurance / yr
- $659 – $1,223
Heat risk 9/10 · Severe
- Hot days now (above 114°F)
- 6 days/yr
- Hot days in 30 yrs
- 15 days/yr
Wind risk 1/10 · Minimal
- Chance of severe wind over 30 yrs
- —
Air-quality risk 4/10 · Minor
- Unhealthy air days now
- 4 days/yr
- Unhealthy air days in 30 yrs
- 5 days/yr
Risk factors via First Street. Map © Google.
Why this score? — see what drove the C+ grade
The composite is a weighted blend of 9 inputs, each scored 0–100. Each bar is that input's sub-score; the figure is the points it added to the 100-point composite (weight × sub-score).
- Cash flow +25.9/30.0
- DSCR +8.7/10.0
- 1% rule +7.2/10.0
- Appreciation +6.9/10.0
- Schools +3.8/10.0
- ARV discount +2.7/15.0
- Livability +2.7/5.0
- Rent growth +2.5/5.0
- Condition / age +2.5/5.0
$319,000
🖨 Deal sheet 📄 Offer letter ✓ Due diligence
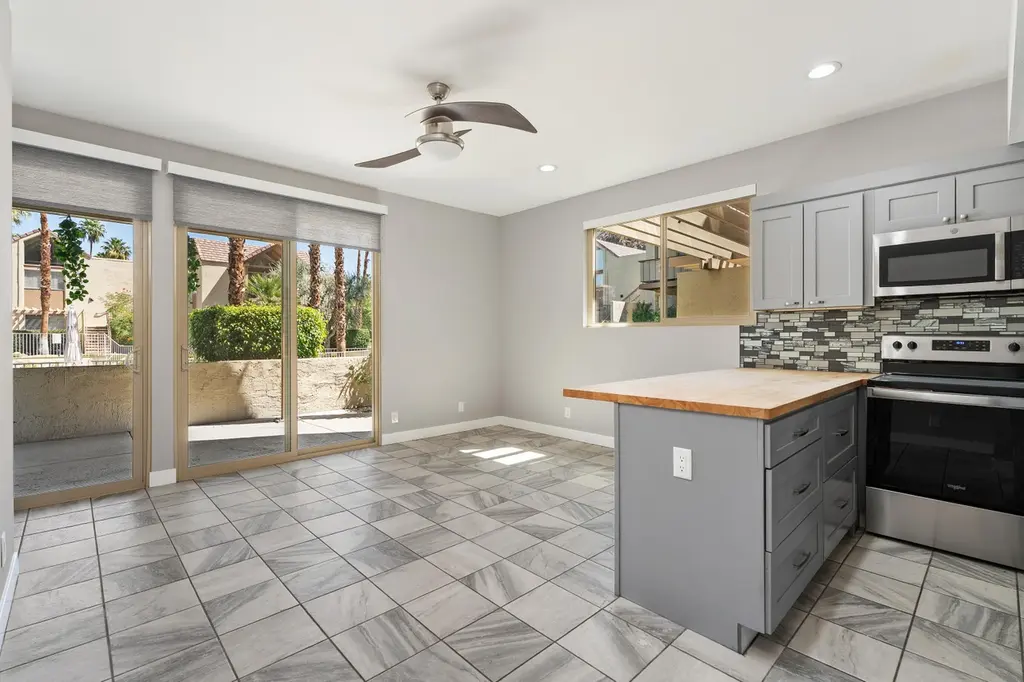
Listing remarks
TINY kitchen on STEROIDS! Oversized pantry cabinet & deep drawers for large pots and counter appliances, stylish glass tile backsplash. A Butcher block Island which is center stage For Prepping, for serving, for dining! New bath. Double sinks, vanity compartment, privacy pony wall, As well as deco accent tile wall. A small walk in closet with vertical storage has been added to the Bedroom. Separate laundry room has a stack washer and dryer with storage. This is a ground floor Condo, no attached walls. Since the wrap around patios face different sun exposure you will enjoy the bedroom patio for a quiet, private moment as well as the pool view patio. So convenient for your Back &
Key facts
- Double sinks
- Privacy pony wall
- Butcher block island
Tags
Property features AI
Finance
- Other: Short-term rentals allowed; Listing terms: Cash; Possession at close of escrow
- Financial info: Land listed as lease; annual land lease amount $1,980
- HOA & community: Monthly association fee of $264; Association covers building & grounds, water and security; Association amenities include guest parking, pet rules, and grounds maintenance; Association has pet rules; Has rental restrictions
Exterior
- Parking: Unassigned parking
- Security: Gated community; Security included in association fees
- Utilities: Sewer connected and paid; Water included in association fees; PUD: No
- Home design: Detached condominium; One story; Built by Mountain Cove
- Construction: Concrete and tile roofing; Assessor-sourced year built; Updated / remodeled condition
- Exterior features: Wrap-around patio; End unit; Stucco wall fencing; Sprinkler system with timer; Mountain views; Gated community
Interior
- Kitchen: Refrigerator; Dishwasher; Disposal
- Bedrooms: Walk-in closet
- Flooring: Tile
- Bathrooms: One full bathroom with double vanity(s); Remodeled bathroom
- Heating & cooling: Central heating; Air conditioning; Ceiling fan(s)
- Interior features: Ground-level entry with no steps; Unfurnished; Family room; Updated / remodeled; No fireplace
- Laundry & utility: Washer and dryer in closet
Neighborhood map
What this means for you Summary
Snapshot
- This is a 1-bed/1.0-bath condo listed at $319k.
Deal economics
- At list price, monthly cash flow is $786 ($9k/yr) — positive.
- The deal already cash-flows at list — no discount required.
- Meets the 1% rule at list price ($4k rent vs $319k).
- Recommended offer: $309k (3.0% below list) — sets the bar for market timing.
- Cap rate 9.3% vs local median 1.5% in Indian Wells — top-decile yield for the area; either an underpriced asset or a hidden risk that comps aren't pricing in. Stress-test before assuming the spread holds.
Location & tenants
- Location reads 53/100 on livability (#968 in CA) — a working-class tenant base; expect higher turnover. Strengths: employment A+, schools B+, crime B+; Watch: amenities F, commute F, cost of living F.
- Desert Sands Unified (suburban): math 31% / reading 56% proficiency, ranked #199 of 517 in CA (top 38%) — families likely to look elsewhere, expect single-tenant / working-renter base with shorter leases.
- Market conditions: 147 active listings in the ZIP; 4 comparable units currently listed for rent nearby; rentals lingering (median 44d on market — plan ~5-8 weeks vacancy on turnover, expect pricing pressure); 100% of comp listings sitting > 30 days — soft ceiling on asking rent; high-income renter base; 9,195 units permitted in Riverside County in 2024 (1,512 in 5+ unit buildings).
Forward outlook
- In year one you build about $14k of equity ($2k loan paydown + $12k appreciation (3.8% local appreciation)).
- Riverside County population projected at +22% by 2050 — long-run rental-demand tailwind backs the buy-and-hold thesis.
- At projected returns (3.8% appreciation + 3.0% rent growth), your $89k cash investment doubles in ~4 years — after that, you're playing with house money.
- By year 3, paydown + projected appreciation supports a ~$35k cash-out refi (75% LTV) — recoverable capital for the next deal without selling this one.
Negotiation context
- It's been on market 37 days — a 3% lower offer ($309k) is reasonable based on typical stale-listing flexibility.
- 3 sale attempts since 25y ago; this cycle's ask has dropped $17k (5%) from the opening price — seller is motivated, your offer sets the floor, not the list.
- Current owner paid $123k; list at $319k implies a 159% gain — meaningful room to come down on a strong offer.
Risks & watch-outs
- Climate carrying-cost: moderate wildfire risk; extreme-heat days projected 6→15/yr by 2055 (HVAC capex compounding) — expect insurance premiums to compound above CPI over the hold.
Questions for the listing agent
- It's been on market 37 days. Have you received any prior offers? Is the seller open to a 3% concession, seller financing, or rate buy-down credit?
- Built in 1972 — when were the roof, HVAC, electrical panel, plumbing, and water heater last replaced?
- What does the HOA fee cover, when was the last increase, and are there any pending special assessments or reserve-fund shortfalls?
- Any open or pending special assessments — roof, HVAC, plumbing, elevator, façade? What's the per-unit balance and payoff schedule, and is the seller paying it off at close or rolling it to the buyer?
- Is there a deadline driving the sale (1031 exchange, divorce, estate, relocation)? That informs how much negotiation room exists.
- Schools are B-rated — typically a magnet for longer-tenancy family renters. What's the average tenant stay here, and is there a school-zone premium baked into asking?
- What's the average days-on-market for RENTAL listings here right now (not sales)? A rising rental-DOM trend means longer vacancies and softer asking-rent achievability than the comps imply.
- What's the recent tenant-quality profile in this submarket — average credit score on applications, eviction rate, late-payment / NSF rate, and stable-employment percentage? A property-management company in the area should have these aggregated.
- How much new apartment / multifamily construction is in the pipeline within 1–3 miles? Heavy new supply (>2% of stock underway) typically softens rents 12–24 months out; light construction supports rent growth.
Investment metrics
- 1% rule
- 1.22% ✓
- Cap rate
- 9.25%
- Cash-on-cash
- 10.56%
- DSCR
- 1.47
- GRM
- 6.8
CMA / ARV
- ARV (median comp)
- $288,231
- List price
- $319,000
- Delta
- 10.68%
- Verdict
- OVERPRICED
- Comps
- 20 within 1.0 mi
Projected returns pro-forma
3.76% appreciation · 3.0% rent growth · sell at horizon
- IRR
- 19.2%
- Equity multiple
- 2.14×
- Total profit
- $101,617
- Equity at exit
- $157,258
- IRR
- 19.9%
- Equity multiple
- 4.09×
- Total profit
- $276,199
- Equity at exit
- $253,699
Cash invested: $89,320 (down + closing). Projections, not guarantees.
Landlord ↔ Tenant lean methodology
- Overall (STATE)
- 18 Strongly Tenant-Friendly
- State California
- 18 Strongly Tenant-Friendly · D+13
- County
- — inherits STATE
- City
- — inherits STATE
ZIP-level market 92210
- Home prices YoY
- 1.3%
- Active inventory
- 147
- Price-to-rent
- 6.8×
Monthly cashflow live
- Estimated rent
- $3,899 medium interval (Pro) →
- Mortgage (P&I)
- −$1,673
- Tax from tax record
- −$224 /mo · $2,687/yr
- Insurance
- −$133
- HOA
- −$264
- Vacancy / Maint / Mgmt
- −$819
- Net cashflow
- $786
Break-even live
UW: 25.0% down · 7.5% · 30yr · 1.5% tax · 5.0% vac · 8.0% maint · 8.0% mgmt
Financing live
Cash to close
- Down payment
- $79,750
- Closing costs
- $9,570
- Reserves months
- —
- Total cash needed
- —
Loan-product check · same deal, 3 products live
Conventional
25% down · 7.5% · 30yr
- Down + closing
- —
- Monthly P&I
- —
- Monthly cashflow
- —
- DSCR
- —
- Eligible?
- —
Personal DTI + credit; lowest rate.
DSCR
20% down · 8.5% · 30yr
- Down + closing
- —
- Monthly P&I
- —
- Monthly cashflow
- —
- DSCR
- —
- Eligible?
- —
No personal income docs; deal must DSCR.
Hard money
10% down · 12.0% · 12mo
- Down + closing
- —
- Monthly P&I
- —
- Monthly cashflow
- —
- DSCR
- —
- Eligible?
- —
Short-term bridge; refi at stabilization.
Rent comps 4 comps
| Address | Beds | Baths | Sqft | Rent | $/sqft | DOM | Units | Dist |
|---|---|---|---|---|---|---|---|---|
| 78200 Cortez Ln #149 Indian Wells, CA | 1.0 | 1.0 | 576 | $2,200 | $3.82 | 43d | 1 | 0.01mi |
| 78155 Cabrillo Ln #37 Indian Wells, CA | 1.0 | 1.0 | 576 | $3,500 | $6.08 | 43d | 1 | 0.03mi |
| 78130 Cortez Ln Indian Wells, CA | 1.0–2.0 | 1.0–2.0 | 874 | $2,600 | $2.97 | 43d | 2 | 0.05mi |
| 78490 Via Palomino Unit 101 La Quinta, CA | 1.0 | 1.0 | 560 | $1,800 | $3.21 | 43d | 1 | 1.17mi |
HOA detail condo
- Monthly dues
- $264 · $3,168/yr
- Likely covers
- pool
- Assessments
- None detected in remarks — confirm with the listing agent.
Listing history 21 events
-
2026-06-18days on market $319,000 Active 37 DOM
-
2026-06-17days on market $319,000 Active 36 DOM
-
2026-06-16days on market $319,000 Active 35 DOM
-
2026-06-15days on market $319,000 Active 34 DOM
-
2026-06-13days on market $319,000 Active 32 DOM
-
2026-06-09days on market $319,000 Active 28 DOM
-
2026-06-08days on market $319,000 Active 27 DOM
-
2026-06-07pricedays on market $319,000 Active 26 DOM
-
2026-06-04days on market $336,000 Active 23 DOM
-
2026-06-03days on market $336,000 Active 22 DOM
-
2026-06-02days on market $336,000 Active 21 DOM
-
2026-06-01days on market $336,000 Active 20 DOM
-
2026-05-31days on market $336,000 Active 19 DOM
-
2026-05-06$336,000 Active 1287-char remark
-
2004-07-02soldstatus $123,000
-
2004-06-14historical
-
2004-06-11$122,900
-
2001-06-19soldstatus $90,000
-
2001-06-15historical
-
2001-04-22$92,500
-
1999-09-20soldstatus $1,914,000
ⓘ Source: listings_history table (triggers on properties + properties_extension) + one-shot
backfill from property_details.listing_events for pre-trigger history.
Tax reassessment forecast CA · Resets to sale price
- Current annual tax
- $2,687 · $224/mo
- Projected year-2 tax
- $2,687 · $224/mo
- Expected delta
- $0/yr ($0/mo · 0.0%)
ⓘ Screening estimate from a state-policy table — verify with the county assessor before closing.
Climate risk First Street
- Flood 1/10 Low FEMA zone X (shaded) · 0% chance over 30 yrs
- Wildfire 5/10 Major
- Heat 9/10 Extreme 6 d/yr ≥114°F today · 15 d/yr by 30 yrs out
- Wind 1/10 Low
- Air quality 4/10 Moderate 4 unhealthy d/yr today · 5 by 30 yrs out
Nearby sold comps map
Loading sold comps map…
Walkable amenities ~0.75 mi
Loading nearby amenities…
Taxation est. · year 1
- Rental income
- $46,785
- − Mortgage interest
- −$17,869
- − Property taxes
- −$2,687
- − Insurance
- −$1,595
- − Repairs & maintenance
- −$3,743
- − Management
- −$3,743
- − HOA
- −$3,168
- − Depreciation
- −$9,280
- Taxable income
- $4,701
- Est. tax owed @ 24.0%
- −$1,128
- After-tax cash flow
- $8,308/yr
For passive investors: Depreciation is non-cash, so a rental often shows a tax loss while cash-flowing — sheltering income. Rental losses are passive: they offset passive income freely, and up to $25,000/yr can offset ordinary (W-2) income if you actively participate and your MAGI is under $100k (phasing out to $0 by $150k); unused losses carry forward. On sale, claimed depreciation is recaptured at up to 25%, and gains may owe capital-gains tax (a 1031 exchange can defer both). Figures are a year-1 estimate at your 24.0% rate — not tax advice; consult a CPA.
Schools (NCES district)
- District
- Desert Sands Unified
- NCES district ID
- 0611110
- Math proficiency
- 31% ▼ -4.00%
- Reading proficiency
- 56% ▲ 7.00%
- Median HH income
- $54,957
- Composite
- 37.77/100
- National rank
- #4346
- State rank
- #199 of 517 in CA
Livability — Indian Wells
- Score
- 53/100
- State rank
- #968
- US rank
- #24559
Category grades
Schools grade is shown separately in the Schools card above.
Census & demographics
- Census place
- Indian Wells, CA
- County
- Riverside County · 2,287,001 people
- City population
- 4,871
- Metro
- Riverside-San Bernardino-Ontario, CA
- Population (ZIP)
- 4,871
- Household income
- $162,990
- Rent vs Own
- Severe rent burden
- 56.0
Population outlook (Riverside County) Hauer SSP2
- Today (2025)
- 2,664,475 people
- By 2030
- 2,802,692 · +5.2%
- By 2040
- 3,050,904 · +14.5%
- By 2050
- 3,256,783 · +22.2%
- By 2075
- 3,655,058 · +37.2%
- By 2100
- 3,766,594 · +41.4%
Race, ethnicity, and origin ACS 2023
- Neighborhood character
- Predominantly White (86%)
- Race & ethnicity
- White 86% Hispanic / Latino 5% Two or more races 5% Asian 3% Black 3%
- Common ancestry
- Slovak 5% Lithuanian 4% Romanian 3%
- Foreign-born
- 10% · Canada, China
- Languages at home
- 92% English-only · Spanish 3% Russian/Polish/Slavic 1% Tagalog/Filipino 1%
Political lean MEDSL · Riverside
- 2024 margin
- Toss-up / Even · D 48.0% · R 49.3% · Other 2.6%
- 2008→2024 swing
- -3.6pp toward R · 2008: 2.3pp · 2024: -1.3pp
- All cycles
- 2024: R+1.3 2020: D+8.0 2016: D+4.3 2012: R+0.4 2008: D+2.3
Not yet ingested
- Civics
- —
Market trends
- HPI YoY
- ▲ 3.76%
- Current HPI
- 299.2632
- Rent YoY
- —
- Metro
- Riverside-San Bernardino-Ontario, CA
- State GDP YoY
- ▲ 3.21%
- F500 in state
- 116
Industry mix (Fortune 500 HQ in CA)
| Industry | F500 HQs | Revenue |
|---|---|---|
| Technology | 27 | $1,492B |
|
||
| Financial Services | 3 | $174B |
|
||
| Retail | 3 | $44B |
|
||
| Insurance | 3 | $26B |
|
||
| Media / Entertainment | 2 | $115B |
|
||
| Pharmaceuticals / Biotech | 2 | $62B |
|
||
Price history
-83.3% since first listed9 events — show timeline
- 2026-06-06 Price Changed $319,000 GPSMLS
- 2026-05-06 Listed $336,000 GPSMLS
- 2004-07-02 Sold (Public Records) $123,000 Public Records
- 2004-06-14 Listing Removed — GPSMLS
- 2004-06-11 Listed $122,900 GPSMLS
- 2001-06-19 Sold (Public Records) $90,000 Public Records
- 2001-06-15 Listing Removed — GPSMLS
- 2001-04-22 Listed $92,500 GPSMLS
- 1999-09-20 Sold (Public Records) $1,914,000 Public Records
Property tax history
+2.0%/yrLatest (2025): $2,687 · +2.8% YoY. Source: county tax records.
Cash-flow waterfall
monthlySold comps — $/sqft
last 12 mo · ≤1 miLoading sold comps…