1521 NW 18th Ave #101 · Delray Beach, FL
Flood risk 1/10 · Minimal
- FEMA flood zone
- X (unshaded)
- Chance of flooding over 30 yrs
- 0.0%
- Est. flood insurance / yr
- $507 – $1,088
Fire risk 1/10 · Minimal
- Est. fire insurance / yr
- $947 – $1,759
Heat risk 10/10 · Severe
- Hot days now (above 105°F)
- 7 days/yr
- Hot days in 30 yrs
- 26 days/yr
Wind risk 10/10 · Severe
- Chance of severe wind over 30 yrs
- 99.0%
Air-quality risk 2/10 · Minimal
- Unhealthy air days now
- 1 days/yr
- Unhealthy air days in 30 yrs
- 2 days/yr
Risk factors via First Street. Map © Google.
Why this score? — see what drove the C grade
The composite is a weighted blend of 9 inputs, each scored 0–100. Each bar is that input's sub-score; the figure is the points it added to the 100-point composite (weight × sub-score).
- Cash flow +21.9/30.0
- 1% rule +10.0/10.0
- ARV discount +7.5/15.0
- DSCR +7.0/10.0
- Schools +4.3/10.0
- Livability +3.9/5.0
- Rent growth +3.0/5.0
- Condition / age +2.5/5.0
- Appreciation +0.0/10.0
$149,000
🖨 Deal sheet 📄 Offer letter ✓ Due diligence
Listing remarks
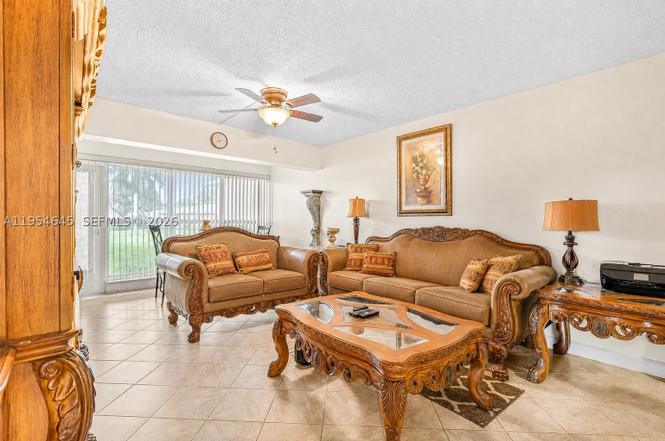
BEST VALUE FIRST-FLOOR CORNER UNIT IN PINES OF DELRAY NORTH! Move right into this spacious 2-bedroom, 2-bath condo located in one of Delray Beach’s most active and desirable 55+ gated communities. This bright corner residence features a NEW roof, newer A/C system, tile flooring throughout, walk-in closets, and convenient first-floor access with no stairs. Enjoy a peaceful Florida lifestyle with resort-style amenities including heated pools, tennis, pickleball, clubhouse activities, walking trails, and gated security. Minutes from Downtown Delray Beach, Atlantic Avenue dining, shopping, entertainment, and beaches. Excellent opportunity for seasonal or full-time living at an incredible
Key facts
- Brand new roof
- Elegant tile floors
- Tennis courts
Tags
Property features AI
Finance
- Other: Pets allowed with restrictions or conditional approval
- Financial info: Association fee: $599 per month
- HOA & community: Monthly association fee; Association fee covers amenities, cable TV, insurance, internet, structural maintenance, pools, recreation facilities, sewer, security, trash and water; Community amenities include pool, tennis courts and pickleball; Senior community
Exterior
- Parking: Assigned parking; Guest parking; One designated space
- Security: Gated/fenced complex; Security guard
- Utilities: Cable available
- Home design: 2-story building; Entry on level 1
- Construction: Block construction; Resale property
- Exterior features: Barbecue area; Fenced complex; Tennis courts; Heated pool
Interior
- Kitchen: Electric range; Microwave; Refrigerator; Dishwasher
- Bedrooms: At least one bedroom on the main level
- Flooring: Tile
- Bathrooms: 2 full bathrooms
- Heating & cooling: Central heating (electric); Central air conditioning (electric)
- Interior features: First-floor entry; Bedroom on main level; Handicap access; Living/dining room; Split bedroom layout; Walk-in closet(s)
- Laundry & utility: Washer; Dryer; Electric water heater
Neighborhood map
What this means for you Summary
Snapshot
- This is a 2-bed/2.0-bath condo listed at $149k.
Deal economics
- At list price, monthly cash flow is $234 ($3k/yr) — positive.
- The deal already cash-flows at list — no discount required.
- Meets the 1% rule at list price ($2k rent vs $149k).
- Recommended offer: $131k (12.0% below list) — sets the bar for market timing.
- Cap rate 8.2% vs local median 4.3% in Delray Beach — top-decile yield for the area; either an underpriced asset or a hidden risk that comps aren't pricing in. Stress-test before assuming the spread holds.
Location & tenants
- Location reads 77/100 on livability (#202 in FL, #3,160 nationally) — a middle-class / working-renter tenant base. Strengths: housing A+, health & safety A+, commute A-; Watch: cost of living C-, crime D-, amenities F.
- Palm Beach (suburban): math 46% / reading 53% proficiency, ranked #34 of 73 in FL (top 47%) — families likely to look elsewhere, expect single-tenant / working-renter base with shorter leases.
- Market conditions: Rents rising (+1.8%/yr); 354 active listings in the ZIP; 40 comparable units currently listed for rent nearby; rentals at typical pace (median 22d on market — plan ~3-4 weeks tenant-placement turnaround); solid renter incomes; 3,974 units permitted in Palm Beach County in 2024 (1,012 in 5+ unit buildings).
- This rent runs 37% of the median local income ($78k/yr) — at the standard rent-burdened threshold; future hikes will face affordability resistance.
Forward outlook
- Local home prices are declining (-3.0%/yr); year-one equity from $1k of loan paydown is wiped out by about $4k of value loss. Plan a longer hold.
- Palm Beach County population projected at +30% by 2050 — long-run rental-demand tailwind backs the buy-and-hold thesis.
Negotiation context
- It's been on market 141 days — a 12% lower offer ($131k) is reasonable based on typical stale-listing flexibility.
- 8 sale attempts since 19y ago; this cycle's ask has dropped $41k (22%) from the opening price — seller is motivated, your offer sets the floor, not the list.
- Current owner paid $36k; list at $149k implies a 311% gain — meaningful room to come down on a strong offer.
Risks & watch-outs
- Watch-outs: HOA is 25% of rent.
- Climate carrying-cost: severe wind risk, 99% chance of damaging wind over 30y; extreme-heat days projected 7→26/yr by 2055 (HVAC capex compounding) — expect insurance premiums to compound above CPI over the hold.
Questions for the listing agent
- It's been on market 141 days. Have you received any prior offers? Is the seller open to a 12% concession, seller financing, or rate buy-down credit?
- What does the HOA fee cover, when was the last increase, and are there any pending special assessments or reserve-fund shortfalls?
- Any open or pending special assessments — roof, HVAC, plumbing, elevator, façade? What's the per-unit balance and payoff schedule, and is the seller paying it off at close or rolling it to the buyer?
- Why hasn't it sold? Are there any deal-killer items the seller is aware of (foundation, flood, title, zoning, code violations)?
- Is there a deadline driving the sale (1031 exchange, divorce, estate, relocation)? That informs how much negotiation room exists.
- Schools are B-rated — typically a magnet for longer-tenancy family renters. What's the average tenant stay here, and is there a school-zone premium baked into asking?
- Crime grade is D in this area — have there been break-ins, vandalism, or insurance claims at this property in the last 3 years? What carrier currently insures it and at what premium?
- What's the average days-on-market for RENTAL listings here right now (not sales)? A rising rental-DOM trend means longer vacancies and softer asking-rent achievability than the comps imply.
- What's the recent tenant-quality profile in this submarket — average credit score on applications, eviction rate, late-payment / NSF rate, and stable-employment percentage? A property-management company in the area should have these aggregated.
- How much new apartment / multifamily construction is in the pipeline within 1–3 miles? Heavy new supply (>2% of stock underway) typically softens rents 12–24 months out; light construction supports rent growth.
Investment metrics
- 1% rule
- 1.63% ✓
- Cap rate
- 8.17%
- Cash-on-cash
- 6.72%
- DSCR
- 1.30
- GRM
- 5.1
CMA / ARV
No comps found within radius.
Projected returns pro-forma
-3.0% appreciation · 1.83% rent growth · sell at horizon
- IRR
- -7.7%
- Equity multiple
- 0.72×
- Total profit
- $-11,662
- Equity at exit
- $22,216
- IRR
- -0.2%
- Equity multiple
- 0.99×
- Total profit
- $-561
- Equity at exit
- $12,883
Cash invested: $41,720 (down + closing). Projections, not guarantees.
Landlord ↔ Tenant lean methodology
- Overall (STATE)
- 87 Strongly Landlord-Friendly
- State Florida
- 87 Strongly Landlord-Friendly · R+3
- County
- — inherits STATE
- City
- — inherits STATE
ZIP-level market 33445
- Rents YoY
- 1.8%
- Active inventory
- 354
- Price-to-rent
- 5.1×
Monthly cashflow live
- Estimated rent
- $2,435 high interval (Pro) →
- Mortgage (P&I)
- −$781
- Tax from tax record
- −$247 /mo · $2,968/yr
- Insurance
- −$62
- HOA
- −$599
- Vacancy / Maint / Mgmt
- −$511
- Net cashflow
- $234
Break-even live
UW: 25.0% down · 7.5% · 30yr · 1.5% tax · 5.0% vac · 8.0% maint · 8.0% mgmt
Financing live
Cash to close
- Down payment
- $37,250
- Closing costs
- $4,470
- Reserves months
- —
- Total cash needed
- —
Loan-product check · same deal, 3 products live
Conventional
25% down · 7.5% · 30yr
- Down + closing
- —
- Monthly P&I
- —
- Monthly cashflow
- —
- DSCR
- —
- Eligible?
- —
Personal DTI + credit; lowest rate.
DSCR
20% down · 8.5% · 30yr
- Down + closing
- —
- Monthly P&I
- —
- Monthly cashflow
- —
- DSCR
- —
- Eligible?
- —
No personal income docs; deal must DSCR.
Hard money
10% down · 12.0% · 12mo
- Down + closing
- —
- Monthly P&I
- —
- Monthly cashflow
- —
- DSCR
- —
- Eligible?
- —
Short-term bridge; refi at stabilization.
Rent comps 40 comps
| Address | Beds | Baths | Sqft | Rent | $/sqft | DOM | Units | Dist |
|---|---|---|---|---|---|---|---|---|
| 1551 NW 20th Ave #102 Delray Beach, FL | 2.0 | 2.0 | 1148 | $1,995 | $1.74 | 24d | 1 | 0.02mi |
| 1860 NW 13th St #201 Delray Beach, FL | 2.0 | 2.0 | 1335 | $2,800 | $2.10 | 24d | 1 | 0.04mi |
| 1520 NW 19th Ter #203 Delray Beach, FL | 2.0 | 2.0 | 1335 | $2,200 | $1.65 | 24d | 1 | 0.04mi |
| 1560 NW 18th Ave #104 Delray Beach, FL | 2.0 | 2.0 | 1148 | $2,100 | $1.83 | 22d | 1 | 0.05mi |
| 1560 NW 18th Ave #104 Delray Beach, FL | 2.0 | 2.0 | 1148 | $2,100 | $1.83 | 20d | 1 | 0.05mi |
| 1441 NW 19th Ter #201 Delray Beach, FL | 2.0 | 2.0 | 1148 | $2,250 | $1.96 | 24d | 1 | 0.06mi |
| 1640 NW 19th Ter #103 Delray Beach, FL | 2.0 | 2.0 | 1148 | $1,950 | $1.70 | 7d | 1 | 0.06mi |
| 1640 NW 19th Ter #103 Delray Beach, FL | 2.0 | 2.0 | 1148 | $1,950 | $1.70 | 22d | 1 | 0.06mi |
| 1440 NW 20th Ave #104 Delray Beach, FL | 2.0 | 2.0 | 1335 | $2,650 | $1.99 | 13d | 1 | 0.09mi |
| 1641 NW 19th Ter Unit 46A Delray Beach, FL | 2.0 | 2.0 | 1104 | $2,000 | $1.81 | 18d | 1 | 0.09mi |
| 1631 NW 18th Ave #201 Delray Beach, FL | 2.0 | 2.0 | 1148 | $3,300 | $2.87 | 24d | 1 | 0.17mi |
| 340 Lake Monterey Cir Boynton Beach, FL | 2.0 | 2.5 | 1188 | $2,350 | $1.98 | 24d | 1 | 0.34mi |
| 169 Monterey Bay Dr Boynton Beach, FL | 3.0 | 2.5 | 1389 | $2,800 | $2.02 | 24d | 1 | 0.36mi |
| 169 Monterey Bay Dr Boynton Beach, FL | 3.0 | 2.5 | 1389 | $2,800 | $2.02 | 14d | 1 | 0.36mi |
| 161 Monterey Bay Dr #161 Boynton Beach, FL | 2.0 | 2.5 | 1188 | $2,300 | $1.94 | 24d | 1 | 0.37mi |
| 161 Monterey Bay Dr #161 Boynton Beach, FL | 2.0 | 2.5 | 1188 | $2,250 | $1.89 | 13d | 1 | 0.37mi |
| 161 Monterey Bay Dr #161 Boynton Beach, FL | 2.0 | 2.5 | 1188 | $2,200 | $1.85 | 3d | 1 | 0.37mi |
| 161 Monterey Bay Dr Boynton Beach, FL | 2.0 | 2.5 | 1188 | $2,300 | $1.94 | 18d | 1 | 0.37mi |
| 161 Monterey Bay Dr Boynton Beach, FL | 2.0 | 2.5 | 1188 | $2,300 | $1.94 | 3d | 1 | 0.37mi |
| 400 Lake Monterey Cir Boynton Beach, FL | 2.0 | 2.5 | 1144 | $2,400 | $2.10 | 10d | 1 | 0.43mi |
| 182 Lake Monterey Cir Boynton Beach, FL | 2.0 | 2.5 | 1423 | $2,500 | $1.76 | 24d | 1 | 0.51mi |
| 182 Lake Monterey Cir Boynton Beach, FL | 2.0 | 2.5 | 1423 | $2,500 | $1.76 | 22d | 1 | 0.51mi |
| 2583 NW 13th St Delray Beach, FL | 2.0 | 2.0 | 1466 | $2,600 | $1.77 | 17d | 1 | 0.52mi |
| 500 N Congress Ave Delray Beach, FL | 2.0–3.0 | 1.0–2.0 | 989 | $2,295 | $2.32 | 1d | 6 | 0.68mi |
| 2915 NW 12th St Unit D Delray Beach, FL | 2.0 | 2.0 | 1499 | $3,200 | $2.13 | 7d | 1 | 0.69mi |
| 2622 NW 7th Ct Delray Beach, FL | 2.0 | 2.5 | 1384 | $2,750 | $1.99 | 24d | 1 | 0.73mi |
| 872 NW 29th Ave Unit A Delray Beach, FL | 2.0 | 2.0 | 1188 | $2,700 | $2.27 | 24d | 1 | 0.76mi |
| 797 NW 32nd Ave Delray Beach, FL | 2.0 | 2.0 | 1480 | $2,800 | $1.89 | 24d | 1 | 0.88mi |
| 797 NW 32nd Ave Delray Beach, FL | 2.0 | 2.0 | 1480 | $2,800 | $1.89 | 17d | 1 | 0.88mi |
| 1720 Depot Ave Delray Beach, FL | 2.0 | 2.0 | 1199 | $2,874 | $2.40 | 13d | 1 | 0.89mi |
| 1720 Depot Ave Delray Beach, FL | 2.0 | 2.0 | 1189 | $2,650 | $2.23 | 24d | 1 | 0.89mi |
| 1335 Lee St Delray Beach, FL | 3.0 | 2.0 | 1000 | $3,200 | $3.20 | 24d | 1 | 0.90mi |
| 1502 NW 4th Ave Delray Beach, FL | 3.0 | 2.0 | 1468 | $6,800 | $4.63 | 16d | 1 | 0.95mi |
| 231 NW 14th Ave Delray Beach, FL | 3.0 | 2.0 | 1250 | $4,950 | $3.96 | 7d | 1 | 1.05mi |
| 227 Coral Trace Ln Unit 227 Delray Beach, FL | 2.0 | 2.0 | 1376 | $3,100 | $2.25 | 24d | 1 | 1.06mi |
| 2480 S Coral Trace Cir Delray Beach, FL | 2.0 | 2.0 | 1379 | $2,900 | $2.10 | 7d | 1 | 1.11mi |
| 210 NW 13th Ave Delray Beach, FL | 2.0 | 1.0 | 800 | $2,200 | $2.75 | 24d | 1 | 1.11mi |
| 351 NW 8th Ave Delray Beach, FL | 3.0 | 2.0 | 1348 | $3,600 | $2.67 | 1d | 1 | 1.12mi |
| 351 NW 8th Ave Delray Beach, FL | 3.0 | 2.0 | 1348 | $3,600 | $2.67 | 10d | 1 | 1.12mi |
| 3996 NW 7th Ct Delray Beach, FL | 3.0 | 2.0 | 1480 | $5,000 | $3.38 | 24d | 1 | 1.17mi |
HOA detail condo
- Monthly dues
- $599 · $7,188/yr
- Likely covers
- poolsecurity
- Assessments
- None detected in remarks — confirm with the listing agent.
Listing history 33 events
-
2026-06-18days on market $149,000 Active 141 DOM
-
2026-06-17days on market $149,000 Active 140 DOM
-
2026-06-16days on market $149,000 Active 139 DOM
-
2026-06-15days on market $149,000 Active 138 DOM
-
2026-06-13days on market $149,000 Active 136 DOM
-
2026-06-09days on market $149,000 Active 132 DOM
-
2026-06-07days on market $149,000 Active 130 DOM
-
2026-06-04days on market $149,000 Active 127 DOM
-
2026-06-03days on market $149,000 Active 126 DOM
-
2026-06-01days on market $149,000 Active 124 DOM
-
2026-05-31days on market $149,000 Active 123 DOM
-
2026-05-02price $154,900
-
2026-03-21price $164,900
-
2026-02-11price $169,900
-
2026-01-28$190,000 Active
-
2024-11-17historical
-
2024-10-31status Active
-
2024-06-20$209,000 Active
-
2024-06-12historical
-
2023-11-16$247,500 Active
-
2014-10-11historical
-
2013-01-02soldstatus $36,250
-
2012-12-28soldstatus $36,250
-
2012-10-01historical
-
2012-04-17$32,500
-
2008-09-25soldstatus $64,700
-
2008-09-05soldstatus $64,700
-
2008-08-24historical
-
2008-08-10historical
-
2008-06-18$69,900
-
2008-04-14$69,900
-
2007-05-30$99,900
-
1995-10-04soldstatus $35,000
ⓘ Source: listings_history table (triggers on properties + properties_extension) + one-shot
backfill from property_details.listing_events for pre-trigger history.
Tax reassessment forecast FL · Resets to sale price
- Current annual tax
- $2,968 · $247/mo
- Projected year-2 tax
- $2,968 · $247/mo
- Expected delta
- $0/yr ($0/mo · 0.0%)
ⓘ Screening estimate from a state-policy table — verify with the county assessor before closing.
Climate risk First Street
- Flood 1/10 Low FEMA zone X (unshaded) · 0% chance over 30 yrs
- Wildfire 1/10 Low
- Heat 10/10 Extreme 7 d/yr ≥105°F today · 26 d/yr by 30 yrs out
- Wind 10/10 Extreme 99% chance of damaging wind over 30 yrs
- Air quality 2/10 Low 1 unhealthy d/yr today · 2 by 30 yrs out
Nearby sold comps map
Loading sold comps map…
Walkable amenities ~0.75 mi
Loading nearby amenities…
Taxation est. · year 1
- Rental income
- $29,214
- − Mortgage interest
- −$8,346
- − Property taxes
- −$2,968
- − Insurance
- −$745
- − Repairs & maintenance
- −$2,337
- − Management
- −$2,337
- − HOA
- −$7,188
- − Depreciation
- −$4,335
- Taxable income
- $959
- Est. tax owed @ 24.0%
- −$230
- After-tax cash flow
- $2,572/yr
For passive investors: Depreciation is non-cash, so a rental often shows a tax loss while cash-flowing — sheltering income. Rental losses are passive: they offset passive income freely, and up to $25,000/yr can offset ordinary (W-2) income if you actively participate and your MAGI is under $100k (phasing out to $0 by $150k); unused losses carry forward. On sale, claimed depreciation is recaptured at up to 25%, and gains may owe capital-gains tax (a 1031 exchange can defer both). Figures are a year-1 estimate at your 24.0% rate — not tax advice; consult a CPA.
Schools (NCES district)
- District
- Palm Beach
- NCES district ID
- 1201500
- Math proficiency
- 46% ▼ -16.00%
- Reading proficiency
- 53% ▼ -4.00%
- Median HH income
- $53,943
- Composite
- 42.72/100
- National rank
- #3160
- State rank
- #34 of 73 in FL
Livability — Delray Beach
- Score
- 77/100
- State rank
- #202
- US rank
- #3160
Category grades
Schools grade is shown separately in the Schools card above.
Census & demographics
- Census place
- Delray Beach, FL
- County
- Palm Beach County · 1,438,312 people
- City population
- 123,167
- Metro
- Miami-Fort Lauderdale-Pompano Beach, FL
- Population (ZIP)
- 33,122
- Household income
- $78,163
- Rent vs Own
- Severe rent burden
- 1649.0
Population outlook (Palm Beach County) Hauer SSP2
- Today (2025)
- 1,637,487 people
- By 2030
- 1,743,255 · +6.5%
- By 2040
- 1,948,712 · +19.0%
- By 2050
- 2,132,979 · +30.3%
- By 2075
- 2,530,027 · +54.5%
- By 2100
- 2,706,979 · +65.3%
Race, ethnicity, and origin ACS 2023
- Neighborhood character
- Diverse neighborhood (Simpson 0.62)
- Race & ethnicity
- White 55% Black 24% Hispanic / Latino 11% Two or more races 11% Asian 4%
- Hispanic origin (detail)
- Puerto Rican 3% Cuban 2%
- Common ancestry
- Hispanic 14% Romanian 3% Scotch-Irish 3%
- Foreign-born
- 27% · Canada, Jamaica, Dominican Republic
- Languages at home
- 66% English-only · French/Haitian/Cajun 18% Spanish 9% Other Indo-European 4%
Political lean MEDSL · Palm Beach
- 2024 margin
- Toss-up / Even · D 50.0% · R 49.2%
- 2008→2024 swing
- -22.1pp toward R · 2008: 22.9pp · 2024: 0.8pp
- All cycles
- 2024: D+0.8 2020: D+12.8 2016: D+15.3 2012: D+17.0 2008: D+22.9
Not yet ingested
- Civics
- —
Market trends
- HPI YoY
- ▼ -258.16%
- Current HPI
- 349.5505
- Rent YoY
- ▲ 1.83%
- Metro
- Miami-Fort Lauderdale-Pompano Beach, FL
- State GDP YoY
- ▲ 3.28%
- F500 in state
- 36
Industry mix (Fortune 500 HQ in FL)
| Industry | F500 HQs | Revenue |
|---|---|---|
| Industrial Technology | 2 | $29B |
|
||
| Insurance | 2 | $17B |
|
||
| Retail | 1 | $60B |
|
||
| Technology Distribution | 1 | $58B |
|
||
| Homebuilding | 1 | $35B |
|
||
| Technology Manufacturing | 1 | $35B |
|
||
Price history
+342.6% since first listed22 events — show timeline
- 2026-05-02 Price Changed $154,900 MARMLS
- 2026-03-21 Price Changed $164,900 MARMLS
- 2026-02-11 Price Changed $169,900 MARMLS
- 2026-01-28 Listed $190,000 MARMLS
- 2024-11-17 Listing Removed — MARMLS
- 2024-10-31 Relisted — MARMLS
- 2024-06-20 Listed $209,000 MARMLS
- 2024-06-12 Listing Removed — Beaches MLS
- 2023-11-16 Listed $247,500 Beaches MLS
- 2014-10-11 Listing Removed — Beaches MLS
- 2013-01-02 Sold (Public Records) $36,250 Public Records
- 2012-12-28 Sold (MLS) $36,250 Beaches MLS
- 2012-10-01 Listing Removed — Beaches MLS
- 2012-04-17 Listed $32,500 Beaches MLS
- 2008-09-25 Sold (Public Records) $64,700 Public Records
- 2008-09-05 Sold (MLS) $64,700 Beaches MLS
- 2008-08-24 Listing Removed — Beaches MLS
- 2008-08-10 Listing Removed — Beaches MLS
- 2008-06-18 Listed $69,900 Beaches MLS
- 2008-04-14 Listed $69,900 Beaches MLS
- 2007-05-30 Listed $99,900 Beaches MLS
- 1995-10-04 Sold (Public Records) $35,000 Public Records
Property tax history
+7.5%/yrLatest (2025): $2,968 · +147.3% YoY. Source: county tax records.
Cash-flow waterfall
monthlySold comps — $/sqft
last 12 mo · ≤1 miLoading sold comps…