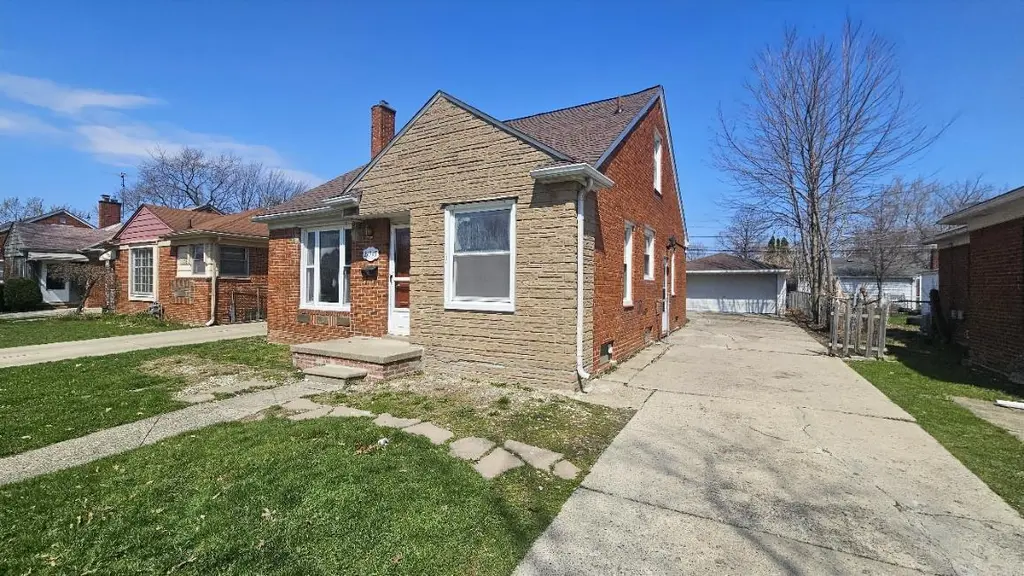
21345 Newcastle Rd · Harper Woods, MI
Flood risk 1/10 · Minimal
- FEMA flood zone
- X (unshaded)
- Chance of flooding over 30 yrs
- 0.0%
- Est. flood insurance / yr
- $507 – $1,088
Fire risk 1/10 · Minimal
- Est. fire insurance / yr
- $784 – $1,456
Heat risk 3/10 · Minor
- Hot days now (above 96°F)
- 7 days/yr
- Hot days in 30 yrs
- 15 days/yr
Wind risk 2/10 · Minimal
- Chance of severe wind over 30 yrs
- —
Air-quality risk 3/10 · Minor
- Unhealthy air days now
- 3 days/yr
- Unhealthy air days in 30 yrs
- 4 days/yr
Risk factors via First Street. Map © Google.
Why this score? — see what drove the D grade
The composite is a weighted blend of 9 inputs, each scored 0–100. Each bar is that input's sub-score; the figure is the points it added to the 100-point composite (weight × sub-score).
- Cash flow +14.9/30.0
- ARV discount +7.5/15.0
- DSCR +4.6/10.0
- 1% rule +3.9/10.0
- Rent growth +3.8/5.0
- Livability +3.7/5.0
- Condition / age +2.5/5.0
- Schools +0.9/10.0
- Appreciation +0.0/10.0
$159,900
🖨 Deal sheet 📄 Offer letter ✓ Due diligence
Listing remarks MLS
Home features newer kitchen with granite counter tops. 2 full baths. Efficient furnace.
Key facts
- 5,227 sq ft lot
- 2 garage spots
- Built 1951
Property features AI
Exterior
- Parking: Detached 2-car garage
- Utilities: Public water; Natural gas connected; High-speed internet
- Home design: Cape Cod style; Single family residence; Residential property
- Construction: Brick construction; Asphalt roof; Built in 1951
- Exterior features: Paved road access; Sidewalk
Interior
- Kitchen: Microwave; Range; Refrigerator
- Bathrooms: 2 full bathrooms
- Heating & cooling: Forced air heating; Has cooling
- Interior features: Full basement; 7 total rooms
- Laundry & utility: Natural gas water heater
Neighborhood map
What this means for you Summary
Snapshot
- This is a 3-bed/1.0-bath single-family listed at $160k.
Deal economics
- At list price, monthly cash flow is $47 ($562/yr) — positive.
- The deal already cash-flows at list — no discount required.
- To meet the 1% rule (rent ≥ 1% of price), the offer needs to be $143k (10.5% below list).
- Recommended offer: $143k (10.5% below list) — sets the bar for 1% rule.
Location & tenants
- Location reads 73/100 on livability (#199 in MI) — a middle-class / working-renter tenant base. Strengths: commute A+, cost of living A+, housing A+; Watch: employment D+, health & safety D+, schools D-.
- Harper Woods School District (suburban): math 4% / reading 15% proficiency, ranked #524 of 540 in MI (top 97%) — low school quality limits family demand, transient renter base, plan for 1-2y turnover; 69% free/reduced lunch — lower-income household profile, screen leases tightly.
- Market conditions: Rents rising fast (+5.1%/yr); 133 active listings in the ZIP; 40 comparable units currently listed for rent nearby; rentals at typical pace (median 18d on market — plan ~3-4 weeks tenant-placement turnaround); 2,639 units permitted in Wayne County in 2024 (1,216 in 5+ unit buildings).
Forward outlook
- Local home prices are declining (-3.0%/yr); year-one equity from $1k of loan paydown is wiped out by about $5k of value loss. Plan a longer hold.
- Wayne County population projected at -17% by 2050 — secular population decline; favor cash flow + early exit over multi-decade hold.
Negotiation context
- It's been on market 55 days — a 3% lower offer ($155k) is reasonable based on typical stale-listing flexibility.
- 14 sale attempts since 24y ago; this cycle's ask has dropped $10k (6%) from the opening price — seller is motivated, your offer sets the floor, not the list.
- Current owner paid $90k; list at $160k implies a 78% gain — meaningful room to come down on a strong offer.
Risks & watch-outs
- Watch-outs: built in 1951 — expect roof / HVAC / electrical / plumbing capex.
Questions for the listing agent
- It's been on market 55 days. Have you received any prior offers? Is the seller open to a 11% concession, seller financing, or rate buy-down credit?
- Built in 1951 — when were the roof, HVAC, electrical panel, plumbing, and water heater last replaced?
- Is there a deadline driving the sale (1031 exchange, divorce, estate, relocation)? That informs how much negotiation room exists.
- Schools are D-rated, which usually means shorter tenancies and higher turnover. Who's the typical renter profile here, and what's been the actual vacancy rate?
- Crime grade is F in this area — have there been break-ins, vandalism, or insurance claims at this property in the last 3 years? What carrier currently insures it and at what premium?
- The area grade is low — what's the realistic commute time and amenity access for the typical tenant pool here? Any planned neighborhood developments (good or bad) we should know about?
- What's the average days-on-market for RENTAL listings here right now (not sales)? A rising rental-DOM trend means longer vacancies and softer asking-rent achievability than the comps imply.
- What's the recent tenant-quality profile in this submarket — average credit score on applications, eviction rate, late-payment / NSF rate, and stable-employment percentage? A property-management company in the area should have these aggregated.
- How much new for-sale + rental construction is in the pipeline within 1–3 miles? Heavy new supply typically softens prices + rents 12–24 months out; constrained supply supports both.
Investment metrics
- 1% rule
- 0.89% ✗
- Cap rate
- 6.64%
- Cash-on-cash
- 1.26%
- DSCR
- 1.06
- GRM
- 9.3
CMA / ARV
- ARV (on-the-fly)
- $86,268
- Comps found
- 12
Show comp detail 12 sales within ~0.75 mi
| Address | Dist | Beds/Ba | Sqft | Sold | Price | $/sf | Match |
|---|---|---|---|---|---|---|---|
| 21211 Newcastle Rd | 0.08mi | 3/1.0 | 1,120 (+3%) | 2mo | $135,000 | $121 | 91 |
| 21628 Newcastle Rd | 0.17mi | 3/1.0 | 1,079 (-1%) | 0mo | $173,500 | $161 | 90 |
| 21553 Bournemouth St | 0.14mi | 3/1.0 | 1,079 (-1%) | 4mo | $185,000 | $171 | 88 |
| 21135 Littlestone Rd | 0.29mi | 3/1.0 | 1,119 (+2%) | 1mo | $187,500 | $168 | 82 |
| 19134 Mallina St | 0.27mi | 3/1.0 | 1,032 (-6%) | 2mo | $179,000 | $173 | 77 |
| 18904 Mallina St | 0.41mi | 3/1.0 | 1,107 (+1%) | 2mo | $85,575 | $77 | 77 |
| 6301 Lodewyck St | 0.58mi | 3/1.0 | 1,084 (-1%) | 4mo | $70,000 | $65 | 68 |
| 20644 Mccormick St | 0.47mi | 3/2.0 | 1,152 (+6%) | 2mo | $91,000 | $79 | 63 |
| 6135 Marseilles St | 0.67mi | 3/1.0 | 988 (-10%) | 0mo | $55,000 | $56 | 53 |
| 20244 Mccormick St | 0.71mi | 3/1.0 | 1,000 (-8%) | 1mo | $75,000 | $75 | 52 |
| 20300 Mccormick St | 0.65mi | 3/1.0 | 940 (-14%) | 1mo | $60,000 | $64 | 46 |
| 20301 Kenosha St | 0.61mi | 3/1.0 | 949 (-13%) | 5mo | $57,000 | $60 | 46 |
Match score weights: distance 35% · size 25% · config 20% · recency 20%. Top-matched comps best support the ARV.
Projected returns pro-forma
-3.0% appreciation · 5.1% rent growth · sell at horizon
- IRR
- -12.0%
- Equity multiple
- 0.56×
- Total profit
- $-19,834
- Equity at exit
- $23,842
- IRR
- -0.1%
- Equity multiple
- 1.00×
- Total profit
- $-177
- Equity at exit
- $13,825
Cash invested: $44,772 (down + closing). Projections, not guarantees.
Landlord ↔ Tenant lean methodology
- Overall (STATE)
- 62 Landlord-Friendly
- State Michigan
- 62 Landlord-Friendly · EVEN
- County
- — inherits STATE
- City
- — inherits STATE
ZIP-level market 48225
- Rents YoY
- 5.1%
- Active inventory
- 133
- Price-to-rent
- 9.3×
Monthly cashflow live
- Estimated rent
- $1,431 high interval (Pro) →
- Mortgage (P&I)
- −$839
- Tax from tax record
- −$178 /mo · $2,137/yr
- Insurance
- −$67
- HOA
- −$0
- Vacancy / Maint / Mgmt
- −$300
- Net cashflow
- $47
Break-even live
UW: 25.0% down · 7.5% · 30yr · 1.5% tax · 5.0% vac · 8.0% maint · 8.0% mgmt
Financing live
Cash to close
- Down payment
- $39,975
- Closing costs
- $4,797
- Reserves months
- —
- Total cash needed
- —
Loan-product check · same deal, 3 products live
Conventional
25% down · 7.5% · 30yr
- Down + closing
- —
- Monthly P&I
- —
- Monthly cashflow
- —
- DSCR
- —
- Eligible?
- —
Personal DTI + credit; lowest rate.
DSCR
20% down · 8.5% · 30yr
- Down + closing
- —
- Monthly P&I
- —
- Monthly cashflow
- —
- DSCR
- —
- Eligible?
- —
No personal income docs; deal must DSCR.
Hard money
10% down · 12.0% · 12mo
- Down + closing
- —
- Monthly P&I
- —
- Monthly cashflow
- —
- DSCR
- —
- Eligible?
- —
Short-term bridge; refi at stabilization.
Rent comps 40 comps
| Address | Beds | Baths | Sqft | Rent | $/sqft | DOM | Units | Dist |
|---|---|---|---|---|---|---|---|---|
| 21401 Kingsville St Harper Woods, MI | 2.0 | 1.0 | 944 | $1,200 | $1.27 | 24d | 1 | 0.18mi |
| 19203 Edgefield St Harper Woods, MI | 2.0 | 1.0 | 1100 | $1,100 | $1.00 | 24d | 1 | 0.25mi |
| 19168 Berden St Grosse Pointe, MI | 3.0 | 1.0 | 1200 | $1,800 | $1.50 | 1d | 1 | 0.26mi |
| 20926 Moross Rd Grosse Pointe, MI | 3.0 | 1.0 | 1200 | $1,350 | $1.12 | 43d | 1 | 0.41mi |
| 20461 Kingsville St Harper Woods, MI | 4.0 | 1.0 | 1100 | $1,399 | $1.27 | 15d | 1 | 0.57mi |
| 6301 Lodewyck St Detroit, MI | 3.0 | 1.0 | 1084 | $1,300 | $1.20 | 12d | 1 | 0.59mi |
| 19000 Chandler Park Dr Grosse Pointe, MI | 2.0 | 1.0 | 1374 | $2,300 | $1.67 | 1d | 1 | 0.61mi |
| 19000 Chandler Park Dr Grosse Pointe, MI | 2.0 | 1.0 | 1374 | $2,300 | $1.67 | 4d | 1 | 0.61mi |
| 22144 Moross Rd Grosse Pointe, MI | 2.0 | 1.0 | 819 | $1,350 | $1.65 | 2d | 1 | 0.61mi |
| 22144 Moross Rd Grosse Pointe, MI | 2.0 | 1.0 | 819 | $1,350 | $1.65 | 18d | 1 | 0.61mi |
| 22148 Moross Rd Grosse Pointe, MI | 2.0 | 1.0 | 819 | $1,250 | $1.53 | 2d | 1 | 0.62mi |
| 22148 Moross Rd Grosse Pointe, MI | 2.0 | 1.0 | 819 | $1,250 | $1.53 | 17d | 1 | 0.62mi |
| 17720 Chester St Detroit, MI | 2.0 | 1.0 | 986 | $1,250 | $1.27 | 43d | 1 | 0.63mi |
| 17710 Chester St Detroit, MI | 2.0 | 1.0 | 984 | $1,250 | $1.27 | 43d | 1 | 0.64mi |
| 6175 Marseilles St Detroit, MI | 3.0 | 1.0 | 1100 | $1,100 | $1.00 | 43d | 1 | 0.66mi |
| 5915 Farmbrook St Detroit, MI | 3.0 | 1.5 | 1000 | $1,250 | $1.25 | 24d | 1 | 0.68mi |
| 10542 Lanark St Detroit, MI | 3.0 | 1.0 | 1023 | $1,250 | $1.22 | 43d | 1 | 0.76mi |
| 10870 Marne St Detroit, MI | 3.0 | 1.0 | 1156 | $1,100 | $0.95 | 17d | 1 | 0.79mi |
| 6325 Neff Ave Detroit, MI | 3.0 | 1.0 | 1000 | $1,500 | $1.50 | 2d | 1 | 0.83mi |
| 6181 Neff Ave Detroit, MI | 3.0 | 1.0 | 1102 | $1,299 | $1.18 | 18d | 1 | 0.85mi |
| 10985 Peerless St Detroit, MI | 3.0 | 1.0 | 1000 | $1,364 | $1.36 | 5d | 1 | 0.86mi |
| 19982 McCormick St Detroit, MI | 3.0 | 1.0 | 866 | $1,200 | $1.39 | 3d | 1 | 0.87mi |
| 6154 Woodhall St Detroit, MI | 2.0 | 1.0 | 1136 | $1,000 | $0.88 | 43d | 1 | 0.89mi |
| 5786 Neff Ave Detroit, MI | 3.0 | 1.5 | 1100 | $1,225 | $1.11 | 16d | 1 | 0.94mi |
| 6304 Bluehill St Detroit, MI | 3.0 | 1.0 | 1088 | $1,500 | $1.38 | 43d | 1 | 0.97mi |
| 5955 Guilford St Detroit, MI | 3.0 | 1.0 | 802 | $1,400 | $1.75 | 17d | 1 | 1.02mi |
| 19661 Kenosha St Harper Woods, MI | 3.0 | 2.0 | 1000 | $1,400 | $1.40 | 24d | 1 | 1.03mi |
| 6225 Oldtown St Detroit, MI | 3.0 | 1.0 | 1330 | $1,199 | $0.90 | 17d | 1 | 1.04mi |
| 19639 Moross Rd Unit 1 Detroit, MI | 2.0 | 1.0 | 900 | $1,100 | $1.22 | 43d | 1 | 1.08mi |
| 10692 Meuse St Detroit, MI | 3.0 | 1.0 | 955 | $1,250 | $1.31 | 12d | 1 | 1.12mi |
| 19442 Kingsville St Harper Woods, MI | 3.0 | 1.0 | 1000 | $1,500 | $1.50 | 17d | 1 | 1.15mi |
| 19435 McCormick St Detroit, MI | 3.0 | 2.0 | 1148 | $1,300 | $1.13 | 17d | 1 | 1.17mi |
| 20015 Lochmoor St Harper Woods, MI | 3.0 | 1.0 | 1006 | $1,500 | $1.49 | 16d | 1 | 1.17mi |
| 10370 Britain St Detroit, MI | 3.0 | 1.0 | 1100 | $1,100 | $1.00 | 43d | 1 | 1.18mi |
| 9313 Harvard Rd Detroit, MI | 3.0 | 1.5 | 1329 | $1,200 | $0.90 | 17d | 1 | 1.20mi |
| 10400 Britain St Detroit, MI | 3.0 | 1.0 | 890 | $1,100 | $1.24 | 43d | 1 | 1.20mi |
| 9241 Boleyn St Detroit, MI | 3.0 | 1.0 | 1350 | $1,350 | $1.00 | 43d | 1 | 1.22mi |
| 19365 Kingsville St Harper Woods, MI | 4.0 | 1.5 | 996 | $1,650 | $1.66 | 15d | 1 | 1.22mi |
| 10177 Boleyn St Detroit, MI | 3.0 | 1.0 | 767 | $1,250 | $1.63 | 43d | 1 | 1.30mi |
| 10037 Grayton St Detroit, MI | 3.0 | 1.0 | 1000 | $1,400 | $1.40 | 3d | 1 | 1.32mi |
Listing history 45 events
-
2026-06-04status $159,900 Pending 55 DOM
-
2026-06-03days on market $159,900 Active - Contingent 55 DOM
-
2026-06-02days on market $159,900 Active - Contingent 54 DOM
-
2026-06-01days on market $159,900 Active - Contingent 53 DOM
-
2026-05-31days on market $159,900 Active - Contingent 52 DOM
-
2026-05-12historical Active Under Contract 87-char remark
Show marketing remark (87 chars)
Home features newer kitchen with granite counter tops. 2 full baths. Efficient furnace.
-
2026-05-12historical Keep Showing-Contgcy Appl 87-char remark
Show marketing remark (87 chars)
Home features newer kitchen with granite counter tops. 2 full baths. Efficient furnace.
-
2026-05-12historical Active - Contingent
Show marketing remark (87 chars)
Home features newer kitchen with granite counter tops. 2 full baths. Efficient furnace.
-
2026-04-30price $159,900 87-char remark
Show marketing remark (87 chars)
Home features newer kitchen with granite counter tops. 2 full baths. Efficient furnace.
-
2026-04-29price $159,900 87-char remark
Show marketing remark (87 chars)
Home features newer kitchen with granite counter tops. 2 full baths. Efficient furnace.
-
2026-04-29price $159,900
Show marketing remark (87 chars)
Home features newer kitchen with granite counter tops. 2 full baths. Efficient furnace.
-
2026-04-18price $164,900 87-char remark
Show marketing remark (87 chars)
Home features newer kitchen with granite counter tops. 2 full baths. Efficient furnace.
-
2026-04-17price $164,900 87-char remark
Show marketing remark (87 chars)
Home features newer kitchen with granite counter tops. 2 full baths. Efficient furnace.
-
2026-04-17price $164,900
Show marketing remark (87 chars)
Home features newer kitchen with granite counter tops. 2 full baths. Efficient furnace.
-
2026-04-09$169,900 Active 87-char remark
Show marketing remark (87 chars)
Home features newer kitchen with granite counter tops. 2 full baths. Efficient furnace.
-
2026-04-09$169,900 Active
Show marketing remark (87 chars)
Home features newer kitchen with granite counter tops. 2 full baths. Efficient furnace.
-
2026-04-09$169,900 Active 87-char remark
Show marketing remark (87 chars)
Home features newer kitchen with granite counter tops. 2 full baths. Efficient furnace.
-
2026-04-07historical $169,900 87-char remark
Show marketing remark (87 chars)
Home features newer kitchen with granite counter tops. 2 full baths. Efficient furnace.
-
2026-04-07historical $169,900
Show marketing remark (87 chars)
Home features newer kitchen with granite counter tops. 2 full baths. Efficient furnace.
-
2018-01-30soldstatus $89,900
-
2010-10-14soldstatus $41,000
-
2010-10-12soldstatus $41,000
-
2010-09-11historical
-
2010-08-20$49,900
-
2010-08-20$49,900
-
2010-08-20historical
-
2010-08-20historical
-
2010-06-24$49,900
-
2010-06-24$49,900
-
2010-05-27historical
-
2010-05-27historical
-
2010-05-06$39,900
-
2010-05-06$39,900
-
2010-05-06historical
-
2010-05-06historical
-
2010-04-09soldstatus $27,000
-
2010-04-09$42,900
-
2010-04-09$42,900
-
2010-03-23soldstatus $27,000
-
2010-03-17$29,900
-
2010-03-17$29,900
-
2003-04-16soldstatus $113,000
-
2003-02-18soldstatus $113,000
-
2002-10-10historical
-
2002-09-08$119,900
ⓘ Source: listings_history table (triggers on properties + properties_extension) + one-shot
backfill from property_details.listing_events for pre-trigger history.
Tax reassessment forecast MI · Partial reset (capped growth)
- Current annual tax
- $2,137 · $178/mo
- Projected year-2 tax
- $2,300 · $192/mo
- Expected delta
- +$162/yr (+$14/mo · 7.6%)
ⓘ Screening estimate from a state-policy table — verify with the county assessor before closing.
Climate risk First Street
- Flood 1/10 Low FEMA zone X (unshaded) · 0% chance over 30 yrs
- Wildfire 1/10 Low
- Heat 3/10 Moderate 7 d/yr ≥96°F today · 15 d/yr by 30 yrs out
- Wind 2/10 Low
- Air quality 3/10 Moderate 3 unhealthy d/yr today · 4 by 30 yrs out
Nearby sold comps map
Loading sold comps map…
Walkable amenities ~0.75 mi
Loading nearby amenities…
Taxation est. · year 1
- Rental income
- $17,166
- − Mortgage interest
- −$8,957
- − Property taxes
- −$2,137
- − Insurance
- −$800
- − Repairs & maintenance
- −$1,373
- − Management
- −$1,373
- − Depreciation
- −$4,652
- Taxable loss
- −$2,126
- Est. tax savings @ 24.0%
- +$510
- After-tax cash flow
- $1,072/yr
For passive investors: Depreciation is non-cash, so a rental often shows a tax loss while cash-flowing — sheltering income. Rental losses are passive: they offset passive income freely, and up to $25,000/yr can offset ordinary (W-2) income if you actively participate and your MAGI is under $100k (phasing out to $0 by $150k); unused losses carry forward. On sale, claimed depreciation is recaptured at up to 25%, and gains may owe capital-gains tax (a 1031 exchange can defer both). Figures are a year-1 estimate at your 24.0% rate — not tax advice; consult a CPA.
Schools (NCES district)
- District
- Harper Woods School District
- NCES district ID
- 2617760
- Math proficiency
- 4% ▼ -7.00%
- Reading proficiency
- 15% ▼ -9.00%
- Median HH income
- $46,155
- Composite
- 8.8/100
- National rank
- #9892
- State rank
- #524 of 540 in MI
Livability — Harper Woods
- Score
- 73/100
- State rank
- #199
- US rank
- #5054
Category grades
Schools grade is shown separately in the Schools card above.
Census & demographics
- Census place
- Harper Woods, MI
- County
- Wayne County · 1,562,939 people
- City population
- 16,098
- Metro
- Detroit-Warren-Dearborn, MI
- Population (ZIP)
- 16,098
- Household income
- $61,750
- Rent vs Own
- Severe rent burden
- 410.0
Population outlook (Wayne County) Hauer SSP2
- Today (2025)
- 1,675,273 people
- By 2030
- 1,620,300 · -3.3%
- By 2040
- 1,502,341 · -10.3%
- By 2050
- 1,384,039 · -17.4%
- By 2075
- 1,124,592 · -32.9%
- By 2100
- 881,193 · -47.4%
Race, ethnicity, and origin ACS 2023
- Neighborhood character
- Predominantly Black (65%)
- Race & ethnicity
- Black 65% White 28% Two or more races 4% Hispanic / Latino 1%
- Common ancestry
- Romanian 4% Lithuanian 1% German 1%
- Foreign-born
- 2% · Canada
- Languages at home
- 95% English-only · Arabic 2% Spanish 1%
Political lean MEDSL · Wayne
- 2024 margin
- Strong D (+29.0) · D 62.7% · R 33.7% · Other 3.6%
- 2008→2024 swing
- -20.5pp toward R · 2008: 49.5pp · 2024: 29.0pp
- All cycles
- 2024: D+29.0 2020: D+38.1 2016: D+37.3 2012: D+46.9 2008: D+49.5
Not yet ingested
- Civics
- —
Market trends
- HPI YoY
- ▼ -150.40%
- Current HPI
- 181.4961
- Rent YoY
- ▲ 5.10%
- Metro
- Detroit-Warren-Dearborn, MI
- State GDP YoY
- ▲ 1.37%
- F500 in state
- 28
Industry mix (Fortune 500 HQ in MI)
| Industry | F500 HQs | Revenue |
|---|---|---|
| Automotive Parts | 3 | $48B |
|
||
| Automotive | 2 | $372B |
|
||
| Chemicals | 1 | $45B |
|
||
| Automotive Retail | 1 | $29B |
|
||
| Healthcare / Medical Devices | 1 | $23B |
|
||
| Automotive Technology | 1 | $20B |
|
||
Price history
+33.4% since first listed40 events — show timeline
- 2026-05-12 Contingent — REALCOMP
- 2026-05-12 Contingent — MiRealSource-MiMLS
- 2026-05-12 Contingent — SW Michigan MLS
- 2026-04-30 Price Changed $159,900 MiRealSource-MiMLS
- 2026-04-29 Price Changed $159,900 REALCOMP
- 2026-04-29 Price Changed $159,900 SW Michigan MLS
- 2026-04-18 Price Changed $164,900 MiRealSource-MiMLS
- 2026-04-17 Price Changed $164,900 REALCOMP
- 2026-04-17 Price Changed $164,900 SW Michigan MLS
- 2026-04-09 Listed $169,900 REALCOMP
- 2026-04-09 Listed $169,900 SW Michigan MLS
- 2026-04-09 Listed $169,900 MiRealSource-MiMLS
- 2026-04-07 Coming Soon $169,900 MiRealSource-MiMLS
- 2026-04-07 Coming Soon $169,900 SW Michigan MLS
- 2018-01-30 Sold (Public Records) $89,900 Public Records
- 2010-10-14 Sold (MLS) $41,000 REALCOMP
- 2010-10-12 Sold (MLS) $41,000 MiRealSource-MiMLS
- 2010-09-11 Listing Removed — MiRealSource-MiMLS
- 2010-08-20 Listing Removed — MiRealSource-MiMLS
- 2010-08-20 Listing Removed — REALCOMP
- 2010-08-20 Listed $49,900 MiRealSource-MiMLS
- 2010-08-20 Listed $49,900 REALCOMP
- 2010-06-24 Listed $49,900 MiRealSource-MiMLS
- 2010-06-24 Listed $49,900 REALCOMP
- 2010-05-27 Listing Removed — MiRealSource-MiMLS
- 2010-05-27 Listing Removed — REALCOMP
- 2010-05-06 Listing Removed — REALCOMP
- 2010-05-06 Listing Removed — MiRealSource-MiMLS
- 2010-05-06 Listed $39,900 MiRealSource-MiMLS
- 2010-05-06 Listed $39,900 REALCOMP
- 2010-04-09 Listed $42,900 REALCOMP
- 2010-04-09 Listed $42,900 MiRealSource-MiMLS
- 2010-04-09 Sold (MLS) $27,000 REALCOMP
- 2010-03-23 Sold (MLS) $27,000 MiRealSource-MiMLS
- 2010-03-17 Listed $29,900 MiRealSource-MiMLS
- 2010-03-17 Listed $29,900 REALCOMP
- 2003-04-16 Sold (MLS) $113,000 MiRealSource-MiMLS
- 2003-02-18 Sold (Public Records) $113,000 Public Records
- 2002-10-10 Listing Removed — MiRealSource-MiMLS
- 2002-09-08 Listed $119,900 MiRealSource-MiMLS
Property tax history
-0.5%/yrLatest (2025): $2,137 · -46.7% YoY. Source: county tax records.
Cash-flow waterfall
monthlySold comps — $/sqft
last 12 mo · ≤1 miLoading sold comps…