428 N 68th Ave #233 · Phoenix, AZ
Flood risk 1/10 · Minimal
- FEMA flood zone
- X (shaded)
- Chance of flooding over 30 yrs
- 0.0%
- Est. flood insurance / yr
- $507 – $1,088
Fire risk 1/10 · Minimal
- Est. fire insurance / yr
- $610 – $1,132
Heat risk 9/10 · Severe
- Hot days now (above 112°F)
- 7 days/yr
- Hot days in 30 yrs
- 18 days/yr
Wind risk 1/10 · Minimal
- Chance of severe wind over 30 yrs
- —
Air-quality risk 2/10 · Minimal
- Unhealthy air days now
- 0 days/yr
- Unhealthy air days in 30 yrs
- 1 days/yr
Risk factors via First Street. Map © Google.
Why this score? — see what drove the B+ grade
The composite is a weighted blend of 9 inputs, each scored 0–100. Each bar is that input's sub-score; the figure is the points it added to the 100-point composite (weight × sub-score).
- Cash flow +30.0/30.0
- ARV discount +15.0/15.0
- 1% rule +10.0/10.0
- DSCR +10.0/10.0
- Livability +3.8/5.0
- Condition / age +3.8/5.0
- Rent growth +2.0/5.0
- Schools +1.6/10.0
- Appreciation +0.0/10.0
$97,000
🖨 Deal sheet (PDF) 📄 Offer letter ✓ Due diligence
Listing remarks
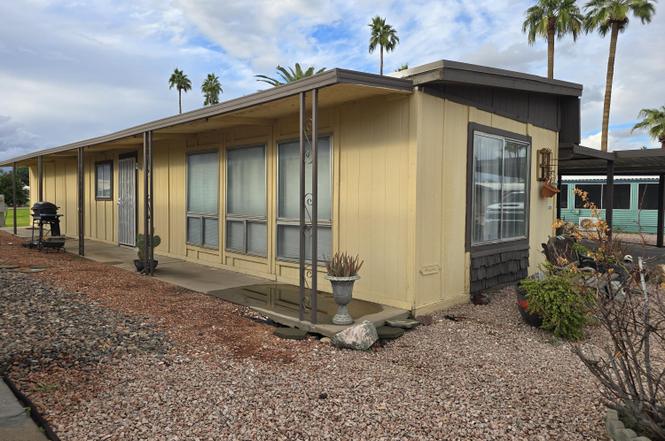
Welcome to 428 N 68th Ave #233, Phoenix, AZ 85043. A rare 4-bedroom, 2-bathroom double-wide manufactured home for sale in the highly sought-after gated community of San Estrella Estates. With 1,792 sq. ft. of living space, this is one of the largest and most versatile floor plans available in Phoenix manufactured housing at this price. This move-in-ready manufactured home in Phoenix has been extensively updated over the last decade, including new flooring, fresh interior paint, HVAC system (2020), roof, and a remodeled kitchen and bathrooms. Whether you're a first-time homebuyer, a growing family, or simply looking for affordable housing in Phoenix, AZ, this home delivers exceptional value
Key facts
- New a/c unit
- Massive workshop
- New flooring
Tags
Property features AI
Finance
- HOA & community: Community pool; Gated community; Near bus stop; Community media room; Biking/walking path; Association covers street maintenance; Land lease of $1,026 per month
Exterior
- Parking: 2 covered parking spaces; 2 carport spaces
- Utilities: City water; Public sewer
- Home design: Manufactured/mobile home; Leasehold ownership
- Construction: Wood frame construction; Painted exterior; Composition roof
- Exterior features: Storage; Gravel/stone front yard; Grass in back yard; No fencing
Interior
- Kitchen: Built-in microwave; Pantry
- Bedrooms: Up to 4 bedrooms
- Bathrooms: 2 full bathrooms
- Heating & cooling: Electric heating; Central air conditioning; Ceiling fans
- Interior features: Granite counters; Breakfast bar; Pantry; 3/4 bath in master bedroom; Refrigerator included
- Laundry & utility: Laundry in garage
Neighborhood map
What this means for you Summary
Snapshot
- This is a 4-bed/2.0-bath manufactured listed at $97k. Condition is rated good.
Deal economics
- At list price, monthly cash flow is $1k ($13k/yr) — positive.
- The deal already cash-flows at list — no discount required.
- Meets the 1% rule at list price ($2k rent vs $97k).
- Recommended offer: $91k (6.0% below list) — sets the bar for market timing.
- Cap rate 19.7% vs local median 3.3% in Phoenix — top-decile yield for the area; either an underpriced asset or a hidden risk that comps aren't pricing in. Stress-test before assuming the spread holds.
Location & tenants
- Location reads 75/100 on livability (#16 in AZ, #3,924 nationally) — a middle-class / working-renter tenant base. Strengths: amenities A+, commute A+, housing A+; Watch: health & safety C-, crime F.
- Tolleson Union High School District (4288) (suburban): math 14% / reading 22% proficiency, ranked #188 of 249 in AZ (top 76%) — low school quality limits family demand, transient renter base, plan for 1-2y turnover.
- Zoned schools: Fowler Elementary School (math 12% / reading 22%, grade F, #814 of 1,109 statewide, top 76%, 407 students, 85% FRL); Western Valley Middle School (math 8% / reading 12%, grade F, #194 of 218 statewide, top 90%, 550 students, 61% FRL); Sierra Linda High School (math 10% / reading 14%, grade F, #287 of 381 statewide, top 76%, 1,975 students, 58% FRL).
- Market conditions: Rents soft (-1.8%/yr); 122 active listings in the ZIP; 9 comparable units currently listed for rent nearby; rentals leasing fast (median 0d on market — plan ~1-2 weeks tenant-placement turnaround); solid renter incomes; 36,011 units permitted in Maricopa County in 2024 (12,801 in 5+ unit buildings).
- This rent runs 34% of the median local income ($78k/yr) — at the standard rent-burdened threshold; future hikes will face affordability resistance.
Forward outlook
- Local home prices are declining (-3.0%/yr); year-one equity from $671 of loan paydown is wiped out by about $3k of value loss. Plan a longer hold.
- Maricopa County population projected at +38% by 2050 — long-run rental-demand tailwind backs the buy-and-hold thesis.
- At projected returns (-3.0% appreciation + 0.0% rent growth), your $27k cash investment doubles in ~3 years — after that, you're playing with house money.
Negotiation context
- It's been on market 83 days — a 6% lower offer ($91k) is reasonable based on typical stale-listing flexibility.
Risks & watch-outs
- Climate carrying-cost: extreme-heat days projected 7→18/yr by 2055 (HVAC capex compounding) — expect insurance premiums to compound above CPI over the hold.
Questions for the listing agent
- It's been on market 83 days. Have you received any prior offers? Is the seller open to a 6% concession, seller financing, or rate buy-down credit?
- Built in 1974 — when were the roof, HVAC, electrical panel, plumbing, and water heater last replaced?
- Why hasn't it sold? Are there any deal-killer items the seller is aware of (foundation, flood, title, zoning, code violations)?
- Is there a deadline driving the sale (1031 exchange, divorce, estate, relocation)? That informs how much negotiation room exists.
- Crime grade is F in this area — have there been break-ins, vandalism, or insurance claims at this property in the last 3 years? What carrier currently insures it and at what premium?
- What's the average days-on-market for RENTAL listings here right now (not sales)? A rising rental-DOM trend means longer vacancies and softer asking-rent achievability than the comps imply.
- What's the recent tenant-quality profile in this submarket — average credit score on applications, eviction rate, late-payment / NSF rate, and stable-employment percentage? A property-management company in the area should have these aggregated.
- How much new for-sale + rental construction is in the pipeline within 1–3 miles? Heavy new supply typically softens prices + rents 12–24 months out; constrained supply supports both.
Investment metrics
- 1% rule
- 2.29% ✓
- Cap rate
- 19.74%
- Cash-on-cash
- 48.02%
- DSCR
- 3.14
- GRM
- 3.6
CMA / ARV
- ARV (on-the-fly)
- $136,192
- Comps found
- 1
Show comp detail 1 sale within ~0.75 mi
| Address | Dist | Beds/Ba | Sqft | Sold | Price | $/sf | Match |
|---|---|---|---|---|---|---|---|
| 605 N 68th Dr #131 | 0.08mi | 3/2.0 (-1) | 1,640 (-8%) | 19mo | $125,000 | $76 | 61 |
Match score weights: distance 35% · size 25% · config 20% · recency 20%. Top-matched comps best support the ARV.
Projected returns pro-forma
-3.0% appreciation · 0.0% rent growth · sell at horizon
- IRR
- 42.1%
- Equity multiple
- 2.73×
- Total profit
- $47,019
- Equity at exit
- $14,463
- IRR
- 46.8%
- Equity multiple
- 4.87×
- Total profit
- $105,024
- Equity at exit
- $8,387
Cash invested: $27,160 (down + closing). Projections, not guarantees.
Landlord ↔ Tenant lean methodology
- Overall (STATE)
- 87 Strongly Landlord-Friendly
- State Arizona
- 87 Strongly Landlord-Friendly · R+3
- County
- — inherits STATE
- City
- — inherits STATE
ZIP-level market 85043
- Home prices YoY
- -28.6%
- Rents YoY
- -1.8%
- Active inventory
- 122
- Price-to-rent
- 3.6×
Monthly cashflow live
- Estimated rent
- $2,224 high interval (Pro) →
- Mortgage (P&I)
- −$509
- Tax est. 1.5%
- −$121 /mo · $1,455/yr
- Insurance
- −$40
- HOA
- −$0
- Vacancy / Maint / Mgmt
- −$467
- Net cashflow
- $1,087
Break-even live
Sensitivity live
| Price | -10% $1,154 | -5% $1,120 | +0% $1,087 | +5% $1,053 | +10% $1,020 |
|---|---|---|---|---|---|
| Rent | -10% $911 | -5% $999 | +0% $1,087 | +5% $1,175 | +10% $1,263 |
| Rate | -1.0pp $1,136 | -0.5pp $1,112 | base $1,087 | +0.5pp $1,062 | +1.0pp $1,036 |
UW: 25.0% down · 7.5% · 30yr · 1.5% tax · 5.0% vac · 8.0% maint · 8.0% mgmt
Financing live
Cash to close
- Down payment
- $24,250
- Closing costs
- $2,910
- Reserves months
- —
- Total cash needed
- —
Loan-product check · same deal, 3 products live
Conventional
25% down · 7.5% · 30yr
- Down + closing
- —
- Monthly P&I
- —
- Monthly cashflow
- —
- DSCR
- —
- Eligible?
- —
Personal DTI + credit; lowest rate.
DSCR
20% down · 8.5% · 30yr
- Down + closing
- —
- Monthly P&I
- —
- Monthly cashflow
- —
- DSCR
- —
- Eligible?
- —
No personal income docs; deal must DSCR.
Hard money
10% down · 12.0% · 12mo
- Down + closing
- —
- Monthly P&I
- —
- Monthly cashflow
- —
- DSCR
- —
- Eligible?
- —
Short-term bridge; refi at stabilization.
Rent comps 9 comps
| Address | Beds | Baths | Sqft | Rent | $/sqft | DOM | Units | Dist |
|---|---|---|---|---|---|---|---|---|
| 7044 W Taylor St Phoenix, AZ | 4.0 | 2.0 | 1588 | $1,869 | $1.18 | 12d | 1 | 0.39mi |
| 6628 W Monroe St Phoenix, AZ | 3.0 | 2.0 | 1656 | $2,100 | $1.27 | 0d | 1 | 0.44mi |
| 6616 W Adams St Phoenix, AZ | 3.0 | 2.5 | 1820 | $1,799 | $0.99 | 0d | 1 | 0.48mi |
| 7205 W McDowell Rd Phoenix, AZ | 2.0–3.0 | 2.0 | 1291 | $1,915 | $1.48 | 0d | 6 | 0.84mi |
| 1801 N 63rd Dr Phoenix, AZ | 3.0 | 2.0 | 1770 | $1,845 | $1.04 | 16d | 1 | 1.02mi |
| 6161 W McDowell Rd Phoenix, AZ | 1.0–3.0 | 1.0–2.0 | 987 | $1,735 | $1.76 | 0d | 40 | 1.07mi |
| 7361 W Coronado Rd Phoenix, AZ | 3.0 | 2.0 | 1493 | $1,795 | $1.20 | 12d | 1 | 1.18mi |
| 6343 W Cypress St Phoenix, AZ | 3.0 | 2.0 | 1280 | $1,780 | $1.39 | 0d | 1 | 1.28mi |
| 5821 W McDowell Rd Phoenix, AZ | 1.0–3.0 | 1.0–2.0 | 998 | $2,324 | $2.33 | 0d | 11 | 1.33mi |
Listing history 3 events
-
2026-05-01status Pending
-
2026-03-16price $97,000
-
2026-02-06$100,000 Active
ⓘ Source: listings_history table (triggers on properties + properties_extension) + one-shot
backfill from property_details.listing_events for pre-trigger history.
Climate risk First Street
- Flood 1/10 Low FEMA zone X (shaded) · 0% chance over 30 yrs
- Wildfire 1/10 Low
- Heat 9/10 Extreme 7 d/yr ≥112°F today · 18 d/yr by 30 yrs out
- Wind 1/10 Low
- Air quality 2/10 Low 0 unhealthy d/yr today · 1 by 30 yrs out
Nearby sold comps map
Loading sold comps map…
Walkable amenities ~0.75 mi
Loading nearby amenities…
Taxation est. · year 1
- Rental income
- $26,692
- − Mortgage interest
- −$5,434
- − Property taxes
- −$1,455
- − Insurance
- −$485
- − Repairs & maintenance
- −$2,135
- − Management
- −$2,135
- − Depreciation
- −$2,822
- Taxable income
- $12,226
- Est. tax owed @ 24.0%
- −$2,934
- After-tax cash flow
- $10,108/yr
For passive investors: Depreciation is non-cash, so a rental often shows a tax loss while cash-flowing — sheltering income. Rental losses are passive: they offset passive income freely, and up to $25,000/yr can offset ordinary (W-2) income if you actively participate and your MAGI is under $100k (phasing out to $0 by $150k); unused losses carry forward. On sale, claimed depreciation is recaptured at up to 25%, and gains may owe capital-gains tax (a 1031 exchange can defer both). Figures are a year-1 estimate at your 24.0% rate — not tax advice; consult a CPA.
Condition & rehab AI · 13 photos
This move-in-ready manufactured home in Phoenix, AZ, has been extensively updated over the last decade, including new flooring, fresh interior paint, HVAC system (2020), roof, and a remodeled kitchen and bathrooms. The home is in good condition with no visible repairs needed, and it offers a great opportunity for an investor to increase its value through cosmetic updates and energy-efficient upgrades.
Value-add opportunities
- Both Paint the exterior siding and trim to enhance curb appeal and protect against weathering. — Painting the exterior can improve the home's appearance and protect the siding from the elements, which can increase its resale and rental value.
- Both Replace the HVAC system with a more energy-efficient model. — Upgrading the HVAC system can improve energy efficiency, reduce utility costs, and enhance the home's comfort, which can increase its resale and rental value.
Renovation cost estimate screening
Value-add ROI direction
- Both Paint the exterior siding and trim to enhance curb appeal and protect against weathering. — Painting the exterior can improve the home's appearance and protect the siding from the elements, which can increase its resale and rental value. ↑
- Both Replace the HVAC system with a more energy-efficient model. — Upgrading the HVAC system can improve energy efficiency, reduce utility costs, and enhance the home's comfort, which can increase its resale and rental value. ↑
ⓘ Cost ranges are severity-bucket heuristics (US national rule-of-thumb). Get contractor quotes + a written scope before underwriting a rehab budget.
Schools (NCES district)
- District
- Tolleson Union High School District (4288)
- NCES district ID
- 0408520
- Math proficiency
- 14% ▼ -21.00%
- Reading proficiency
- 22% ▼ -14.00%
- Median HH income
- $51,925
- Composite
- 16.41/100
- National rank
- #9193
- State rank
- #188 of 249 in AZ
Livability — Phoenix
- Score
- 75/100
- State rank
- #16
- US rank
- #3924
Category grades
Schools grade is shown separately in the Schools card above.
Census & demographics
- Census place
- Phoenix, AZ
- County
- Maricopa County · 4,537,380 people
- City population
- 1,500,198
- Metro
- Phoenix-Mesa-Chandler, AZ
- Population (ZIP)
- 41,331
- Household income
- $78,257
- Rent vs Own
- Severe rent burden
- 1019.0
Population outlook (Maricopa County) Hauer SSP2
- Today (2025)
- 4,979,203 people
- By 2030
- 5,378,229 · +8.0%
- By 2040
- 6,156,598 · +23.6%
- By 2050
- 6,872,376 · +38.0%
- By 2075
- 8,401,270 · +68.7%
- By 2100
- 9,247,439 · +85.7%
Race, ethnicity, and origin ACS 2023
- Neighborhood character
- Predominantly Hispanic (75%)
- Race & ethnicity
- Hispanic / Latino 75% Two or more races 33% White 11% Black 11% Native American 3%
- Hispanic origin (detail)
- Mexican 72%
- Common ancestry
- Lithuanian 1% Iranian 1%
- Foreign-born
- 27% · Canada
- Languages at home
- 41% English-only · Spanish 57%
Political lean MEDSL · Maricopa
- 2024 margin
- Toss-up / Even · D 47.7% · R 51.2% · Other 1.1%
- 2008→2024 swing
- +7.1pp toward D · 2008: -10.6pp · 2024: -3.5pp
- All cycles
- 2024: R+3.5 2020: D+2.2 2016: R+3.5 2012: R+12.0 2008: R+10.6
Not yet ingested
- Civics
- —
Market trends
- HPI YoY
- ▼ -124.22%
- Current HPI
- 309.495
- Rent YoY
- ▼ -1.83%
- Metro
- Phoenix-Mesa-Chandler, AZ
- State GDP YoY
- ▲ 4.54%
- F500 in state
- 20
Industry mix (Fortune 500 HQ in AZ)
| Industry | F500 HQs | Revenue |
|---|---|---|
| Technology | 2 | $13B |
|
||
| Mining / Metals | 1 | $23B |
|
||
| Environmental Services | 1 | $16B |
|
||
| Metals / Steel | 1 | $14B |
|
||
| Technology Distribution | 1 | $9B |
|
||
| Homebuilding | 1 | $8B |
|
||
Price history
-3.0% since first listed3 events — show timeline
- 2026-05-01 Pending — ARMLS
- 2026-03-16 Price Changed $97,000 ARMLS
- 2026-02-06 Listed $100,000 ARMLS
Cash-flow waterfall
monthlySold comps — $/sqft
last 12 mo · ≤1 miLoading sold comps…