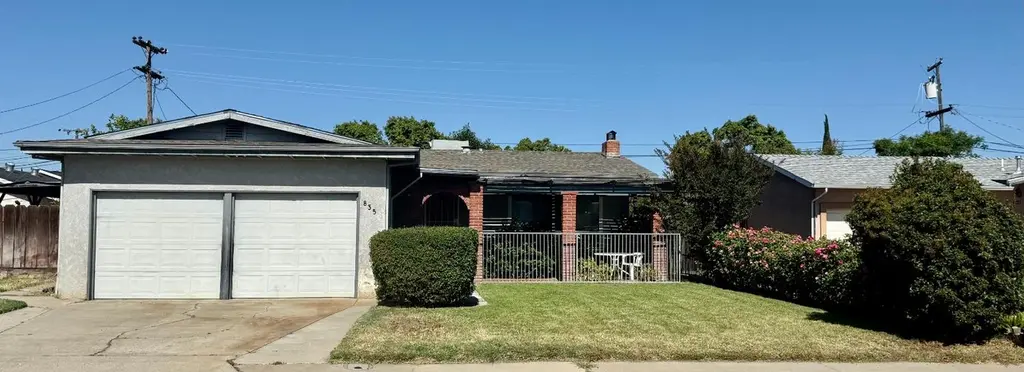
835 Nevada Ave · Los Banos, CA
Flood risk 6/10 · Moderate
- FEMA flood zone
- X (unshaded)
- Chance of flooding over 30 yrs
- 0.68%
- Est. flood insurance / yr
- $507 – $1,088
Fire risk 1/10 · Minimal
- Est. fire insurance / yr
- $659 – $1,223
Heat risk 7/10 · Major
- Hot days now (above 104°F)
- 7 days/yr
- Hot days in 30 yrs
- 16 days/yr
Wind risk 1/10 · Minimal
- Chance of severe wind over 30 yrs
- —
Air-quality risk 10/10 · Severe
- Unhealthy air days now
- 22 days/yr
- Unhealthy air days in 30 yrs
- 24 days/yr
Risk factors via First Street. Map © Google.
Why this score? — see what drove the C grade
The composite is a weighted blend of 9 inputs, each scored 0–100. Each bar is that input's sub-score; the figure is the points it added to the 100-point composite (weight × sub-score).
- Cash flow +21.6/30.0
- ARV discount +15.0/15.0
- DSCR +6.9/10.0
- 1% rule +4.4/10.0
- Rent growth +4.1/5.0
- Livability +3.4/5.0
- Condition / age +2.5/5.0
- Schools +0.9/10.0
- Appreciation +0.0/10.0
$214,900
🖨 Deal sheet (PDF) 📄 Offer letter ✓ Due diligence
Listing remarks
In the right hands, this rough gem will be someone's cozy sanctuary. There are 2 living areas, 3 large bedrooms, original wood floors, dual-pane windows, a front porch for relaxing, a large backyard with established landscaping & a sturdy tree house. It's in an established neighborhood within walking distance to schools, parks, downtown, stores & restaurants. Though the inspection reports show the work needed is mostly cosmetic, this is a cash or hard money only property. Reports available upon request.
Key facts
- Dual-pane windows
- Front porch
- Large backyard
Tags
Property features AI
Finance
- Other: Located in Merced County, Los Banos area; Street address: 835 Nevada Ave, Los Banos, CA 93635; Cross street: I Street; Directions: Take I Street to Nevada Street
- HOA & community: No association; Not a senior community
Exterior
- Parking: Attached garage with garage door opener; Garage faces the front; 2 garage spaces; Sidewalk/curb/gutter along driveway
- Security: Fenced front and back yard
- Utilities: Public water; Public sewer; Natural gas connected; 220 volt electric service; No irrigation system
- Home design: Detached single-family residence; Residential property; Fixer condition; Built in 1956; Composition roof
- Construction: Detached construction
- Exterior features: Front and back yard landscaping; Curb(s); Fenced yard (wood and metal)
Interior
- Kitchen: Counter with non-standard/other counter material
- Bedrooms: 3 bedrooms (all on the main level)
- Flooring: Carpet; Linoleum; Wood
- Bathrooms: 1 full bathroom; 1 partial bathroom; Tub with shower over; Bathroom window
- Heating & cooling: Central heating; Central air conditioning; Ceiling fans
- Interior features: One-story layout; Living room fireplace; Street entrance; Family room; Dining room
- Laundry & utility: Laundry area located in the garage
Neighborhood map
What this means for you Summary
Snapshot
- This is a 3-bed/1.5-bath single-family listed at $215k.
Deal economics
- At list price, monthly cash flow is $327 ($4k/yr) — positive.
- The deal already cash-flows at list — no discount required.
- To meet the 1% rule (rent ≥ 1% of price), the offer needs to be $201k (6.4% below list).
- Recommended offer: $201k (6.4% below list) — sets the bar for 1% rule.
- Cap rate 8.1% vs local median 3.4% in Los Banos — top-decile yield for the area; either an underpriced asset or a hidden risk that comps aren't pricing in. Stress-test before assuming the spread holds.
Location & tenants
- Location reads 68/100 on livability (#270 in CA) — a middle-class / working-renter tenant base. Strengths: housing A+, health & safety A+, amenities B; Watch: commute F, cost of living F.
- Los Banos Unified (town): math 3% / reading 16% proficiency, ranked #503 of 517 in CA (top 97%) — low school quality limits family demand, transient renter base, plan for 1-2y turnover; 62% free/reduced lunch — lower-income household profile, screen leases tightly.
- Zoned schools: Henry Miller Elementary (712 students, 85% FRL); Los Banos Junior High (862 students, 79% FRL); Pacheco High (1,799 students, 82% FRL) — zoned schools average 82% FRL vs 62% district-wide (19 pts higher); higher-poverty schools than district average — tighter screening recommended.
- Market conditions: Rents rising fast (+6.5%/yr); 219 active listings in the ZIP; 13 comparable units currently listed for rent nearby; rentals lingering (median 46d on market — plan ~5-8 weeks vacancy on turnover, expect pricing pressure); 62% of comp listings sitting > 30 days — soft ceiling on asking rent; 459 units permitted in Merced County in 2024 (0 in 5+ unit buildings).
- This rent runs 36% of the median local income ($67k/yr) — at the standard rent-burdened threshold; future hikes will face affordability resistance.
Forward outlook
- Local home prices are declining (-3.0%/yr); year-one equity from $1k of loan paydown is wiped out by about $6k of value loss. Plan a longer hold.
- Merced County population projected at +12% by 2050 — modest demand growth; plan on rents tracking national, not racing it.
- At projected returns (-3.0% appreciation + 6.5% rent growth), your $60k cash investment doubles in ~10 years — after that, you're playing with house money.
Negotiation context
- Only 2 days on market — expect competitive offers; lowballing is unlikely to land.
Risks & watch-outs
- Watch-outs: built in 1956 — expect roof / HVAC / electrical / plumbing capex.
- Climate carrying-cost: major flood risk; extreme-heat days projected 7→16/yr by 2055 (HVAC capex compounding) — expect insurance premiums to compound above CPI over the hold.
Questions for the listing agent
- Built in 1956 — when were the roof, HVAC, electrical panel, plumbing, and water heater last replaced?
- Is there a deadline driving the sale (1031 exchange, divorce, estate, relocation)? That informs how much negotiation room exists.
- Schools are D-rated, which usually means shorter tenancies and higher turnover. Who's the typical renter profile here, and what's been the actual vacancy rate?
- What's the average days-on-market for RENTAL listings here right now (not sales)? A rising rental-DOM trend means longer vacancies and softer asking-rent achievability than the comps imply.
- What's the recent tenant-quality profile in this submarket — average credit score on applications, eviction rate, late-payment / NSF rate, and stable-employment percentage? A property-management company in the area should have these aggregated.
- How much new for-sale + rental construction is in the pipeline within 1–3 miles? Heavy new supply typically softens prices + rents 12–24 months out; constrained supply supports both.
Investment metrics
- 1% rule
- 0.94% ✗
- Cap rate
- 8.12%
- Cash-on-cash
- 6.51%
- DSCR
- 1.29
- GRM
- 8.9
CMA / ARV
- ARV (on-the-fly)
- $361,746
- Comps found
- 12
Show comp detail 12 sales within ~0.75 mi
| Address | Dist | Beds/Ba | Sqft | Sold | Price | $/sf | Match |
|---|---|---|---|---|---|---|---|
| 835 Nevada Ave | 0.00mi | 3/1.5 | 1,218 (0%) | 0mo | $245,000 | $201 | 100 |
| 465 Meyers Ln | 0.52mi | 3/2.0 | 1,213 (-0%) | 3mo | $419,407 | $346 | 70 |
| 469 Meyers Ln | 0.52mi | 3/2.0 | 1,213 (-0%) | 3mo | $429,122 | $354 | 70 |
| 925 W J St | 0.48mi | 3/2.0 | 1,226 (+1%) | 5mo | $330,000 | $269 | 70 |
| 1257 Arizona Ave | 0.42mi | 3/2.0 | 1,291 (+6%) | 2mo | $414,000 | $321 | 67 |
| 1130 Delaware Ave | 0.30mi | 3/2.0 | 1,311 (+8%) | 8mo | $390,000 | $297 | 65 |
| 840 W Maryland Ave | 0.36mi | 3/2.0 | 1,102 (-10%) | 4mo | $285,000 | $259 | 62 |
| 1117 Iowa Ave | 0.37mi | 3/1.0 | 1,117 (-8%) | 6mo | $255,000 | $228 | 62 |
| 410 Orange Ave | 0.68mi | 3/2.0 | 1,220 (+0%) | 7mo | $389,900 | $320 | 60 |
| 127 Willmott Ave | 0.47mi | 3/2.0 | 1,141 (-6%) | 8mo | $399,900 | $350 | 59 |
| 441 Lime Ave | 0.67mi | 3/2.0 | 1,145 (-6%) | 3mo | $290,000 | $253 | 54 |
| 941 Granada | 0.54mi | 3/2.0 | 1,382 (+14%) | 4mo | $405,000 | $293 | 47 |
Match score weights: distance 35% · size 25% · config 20% · recency 20%. Top-matched comps best support the ARV.
Projected returns pro-forma
-3.0% appreciation · 6.53% rent growth · sell at horizon
- IRR
- -2.9%
- Equity multiple
- 0.89×
- Total profit
- $-6,735
- Equity at exit
- $32,042
- IRR
- 10.0%
- Equity multiple
- 1.88×
- Total profit
- $53,117
- Equity at exit
- $18,581
Cash invested: $60,172 (down + closing). Projections, not guarantees.
Landlord ↔ Tenant lean methodology
- Overall (STATE)
- 18 Strongly Tenant-Friendly
- State California
- 18 Strongly Tenant-Friendly · D+13
- County
- — inherits STATE
- City
- — inherits STATE
ZIP-level market 93635
- Rents YoY
- 6.5%
- Active inventory
- 219
- Price-to-rent
- 8.9×
Monthly cashflow live
- Estimated rent
- $2,011 high interval (Pro) →
- Mortgage (P&I)
- −$1,127
- Tax from tax record
- −$45 /mo · $545/yr
- Insurance
- −$90
- HOA
- −$0
- Vacancy / Maint / Mgmt
- −$422
- Net cashflow
- $327
Break-even live
Sensitivity live
| Price | -10% $448 | -5% $387 | +0% $327 | +5% $266 | +10% $205 |
|---|---|---|---|---|---|
| Rent | -10% $168 | -5% $247 | +0% $327 | +5% $406 | +10% $485 |
| Rate | -1.0pp $435 | -0.5pp $381 | base $327 | +0.5pp $271 | +1.0pp $214 |
UW: 25.0% down · 7.5% · 30yr · 1.5% tax · 5.0% vac · 8.0% maint · 8.0% mgmt
Financing live
Cash to close
- Down payment
- $53,725
- Closing costs
- $6,447
- Reserves months
- —
- Total cash needed
- —
Loan-product check · same deal, 3 products live
Conventional
25% down · 7.5% · 30yr
- Down + closing
- —
- Monthly P&I
- —
- Monthly cashflow
- —
- DSCR
- —
- Eligible?
- —
Personal DTI + credit; lowest rate.
DSCR
20% down · 8.5% · 30yr
- Down + closing
- —
- Monthly P&I
- —
- Monthly cashflow
- —
- DSCR
- —
- Eligible?
- —
No personal income docs; deal must DSCR.
Hard money
10% down · 12.0% · 12mo
- Down + closing
- —
- Monthly P&I
- —
- Monthly cashflow
- —
- DSCR
- —
- Eligible?
- —
Short-term bridge; refi at stabilization.
Rent comps 13 comps
| Address | Beds | Baths | Sqft | Rent | $/sqft | DOM | Units | Dist |
|---|---|---|---|---|---|---|---|---|
| 918 Illinois Ave Unit 07 Los Banos, CA | 2.0 | 1.0 | 774 | $1,495 | $1.93 | 45d | 1 | 0.12mi |
| 728 Illinois Ave Unit 4 Los Banos, CA | 2.0 | 1.0 | 760 | $1,375 | $1.81 | 15d | 1 | 0.13mi |
| 938 Illinois Ave Unit 11 Los Banos, CA | 2.0 | 1.0 | 774 | $1,395 | $1.80 | 45d | 1 | 0.15mi |
| 415 W J St Los Banos, CA | 3.0 | 2.0 | 1320 | $2,300 | $1.74 | 15d | 1 | 0.21mi |
| 737 Betten St Los Banos, CA | 2.0 | 2.0 | 1492 | $2,300 | $1.54 | 45d | 1 | 0.54mi |
| 406 Adams Ave Los Banos, CA | 2.0 | 1.0 | 1116 | $1,900 | $1.70 | 15d | 1 | 0.61mi |
| 645 E St Los Banos, CA | 3.0 | 2.0 | 1104 | $1,900 | $1.72 | 15d | 1 | 0.64mi |
| 473 Driftwood Ave Los Banos, CA | 3.0 | 2.0 | 1070 | $1,950 | $1.82 | 45d | 1 | 0.95mi |
| 254 Driftwood Ave Los Banos, CA | 3.0 | 2.0 | 1322 | $2,300 | $1.74 | 45d | 1 | 0.96mi |
| 115 N Santa Rita St Los Banos, CA | 2.0 | 1.0 | 756 | $1,600 | $2.12 | 45d | 1 | 1.05mi |
| 1052 Jefferson Ave Los Banos, CA | 3.0 | 2.0 | 1424 | $2,900 | $2.04 | 15d | 1 | 1.07mi |
| 1018 Santa Barbara St Los Banos, CA | 3.0 | 2.0 | 1485 | $2,150 | $1.45 | 45d | 1 | 1.18mi |
| 1306 Canal Farm Ln Los Banos, CA | 2.0 | 1.0 | 766 | $1,775 | $2.32 | 45d | 1 | 1.20mi |
Listing history 3 events
-
2026-06-07statusdays on market $214,900 Pending 2 DOM
-
2026-06-01remarks 512-char remark
-
2026-06-01$214,900 Active 1 DOM
ⓘ Source: listings_history table (triggers on properties + properties_extension) + one-shot
backfill from property_details.listing_events for pre-trigger history.
Tax reassessment forecast CA · Resets to sale price
- Current annual tax
- $545 · $45/mo
- Projected year-2 tax
- $1,633 · $136/mo
- Expected delta
- +$1,088/yr (+$91/mo · 199.7%)
ⓘ Screening estimate from a state-policy table — verify with the county assessor before closing.
Climate risk First Street
- Flood 6/10 Major FEMA zone X (unshaded) · 68% chance over 30 yrs
- Wildfire 1/10 Low
- Heat 7/10 Severe 7 d/yr ≥104°F today · 16 d/yr by 30 yrs out
- Wind 1/10 Low
- Air quality 10/10 Extreme 22 unhealthy d/yr today · 24 by 30 yrs out
Nearby sold comps map
Loading sold comps map…
Walkable amenities ~0.75 mi
Loading nearby amenities…
Taxation est. · year 1
- Rental income
- $24,129
- − Mortgage interest
- −$12,038
- − Property taxes
- −$545
- − Insurance
- −$1,074
- − Repairs & maintenance
- −$1,930
- − Management
- −$1,930
- − Depreciation
- −$6,252
- Taxable income
- $360
- Est. tax owed @ 24.0%
- −$86
- After-tax cash flow
- $3,833/yr
For passive investors: Depreciation is non-cash, so a rental often shows a tax loss while cash-flowing — sheltering income. Rental losses are passive: they offset passive income freely, and up to $25,000/yr can offset ordinary (W-2) income if you actively participate and your MAGI is under $100k (phasing out to $0 by $150k); unused losses carry forward. On sale, claimed depreciation is recaptured at up to 25%, and gains may owe capital-gains tax (a 1031 exchange can defer both). Figures are a year-1 estimate at your 24.0% rate — not tax advice; consult a CPA.
Schools (NCES district)
- District
- Los Banos Unified
- NCES district ID
- 0622740
- Math proficiency
- 3% ▼ -23.00%
- Reading proficiency
- 16% ▼ -23.00%
- Median HH income
- $48,783
- Composite
- 9.04/100
- National rank
- #9875
- State rank
- #503 of 517 in CA
Livability — Los Banos
- Score
- 68/100
- State rank
- #270
- US rank
- #9141
Category grades
Schools grade is shown separately in the Schools card above.
Census & demographics
- Census place
- Los Banos, CA
- County
- Merced County · 205,386 people
- City population
- 50,149
- Metro
- Merced, CA
- Population (ZIP)
- 50,149
- Household income
- $67,129
- Rent vs Own
- Severe rent burden
- 1595.0
Population outlook (Merced County) Hauer SSP2
- Today (2025)
- 285,501 people
- By 2030
- 293,437 · +2.8%
- By 2040
- 308,808 · +8.2%
- By 2050
- 321,011 · +12.4%
- By 2075
- 338,497 · +18.6%
- By 2100
- 330,493 · +15.8%
Race, ethnicity, and origin ACS 2023
- Neighborhood character
- Predominantly Hispanic (73%)
- Race & ethnicity
- Hispanic / Latino 73% White 20% Two or more races 12% Native American 4% Asian 2% Black 2%
- Hispanic origin (detail)
- Mexican 68%
- Common ancestry
- Russian 3% Slovak 1%
- Foreign-born
- 28% · Canada, Vietnam
- Languages at home
- 48% English-only · Spanish 49% Other Indo-European 2%
Political lean MEDSL · Merced
- 2024 margin
- Toss-up / Even · D 46.5% · R 50.9% · Other 2.6%
- 2008→2024 swing
- -12.7pp toward R · 2008: 8.3pp · 2024: -4.4pp
- All cycles
- 2024: R+4.4 2020: D+10.6 2016: D+7.9 2012: D+5.4 2008: D+8.3
Not yet ingested
- Civics
- —
Market trends
- HPI YoY
- ▼ -357.30%
- Current HPI
- 217.6528
- Rent YoY
- ▲ 6.53%
- Metro
- Merced, CA
- State GDP YoY
- ▲ 3.21%
- F500 in state
- 116
Industry mix (Fortune 500 HQ in CA)
| Industry | F500 HQs | Revenue |
|---|---|---|
| Technology | 27 | $1,492B |
|
||
| Financial Services | 3 | $174B |
|
||
| Retail | 3 | $44B |
|
||
| Insurance | 3 | $26B |
|
||
| Media / Entertainment | 2 | $115B |
|
||
| Pharmaceuticals / Biotech | 2 | $62B |
|
||
Property tax history
+1.9%/yrLatest (2025): $545 · -1.0% YoY. Source: county tax records.
Cash-flow waterfall
monthlySold comps — $/sqft
last 12 mo · ≤1 miLoading sold comps…