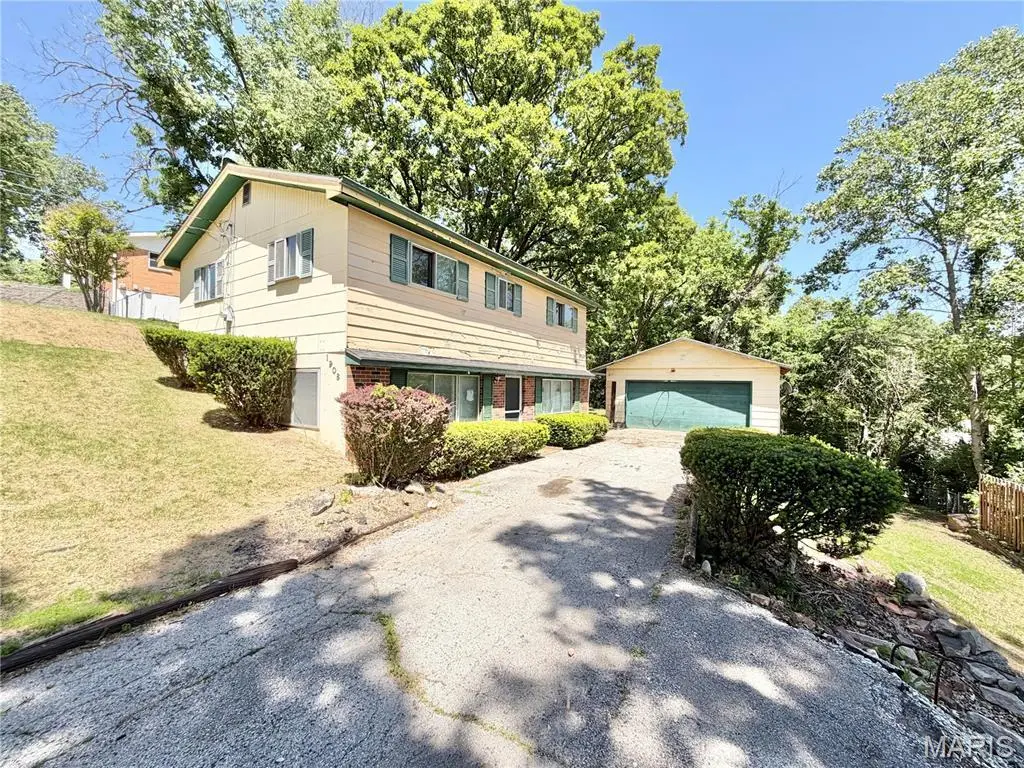
1908 Main Dr · Murphy, MO
Flood risk 1/10 · Minimal
- FEMA flood zone
- X (unshaded)
- Chance of flooding over 30 yrs
- 0.0%
- Est. flood insurance / yr
- $473 – $860
Fire risk 3/10 · Minor
- Est. fire insurance / yr
- $1,054 – $1,958
Heat risk 5/10 · Moderate
- Hot days now (above 106°F)
- 7 days/yr
- Hot days in 30 yrs
- 21 days/yr
Wind risk 2/10 · Minimal
- Chance of severe wind over 30 yrs
- 1.0%
Air-quality risk 3/10 · Minor
- Unhealthy air days now
- 2 days/yr
- Unhealthy air days in 30 yrs
- 4 days/yr
Risk factors via First Street. Map © Google.
Why this score? — see what drove the C grade
The composite is a weighted blend of 9 inputs, each scored 0–100. Each bar is that input's sub-score; the figure is the points it added to the 100-point composite (weight × sub-score).
- Cash flow +19.0/30.0
- ARV discount +15.0/15.0
- DSCR +6.0/10.0
- 1% rule +4.4/10.0
- Schools +3.5/10.0
- Livability +3.0/5.0
- Rent growth +2.5/5.0
- Condition / age +2.5/5.0
- Appreciation +0.0/10.0
$149,900
🖨 Deal sheet (PDF) 📄 Offer letter ✓ Due diligence
Listing remarks
Investment opportunity awaits with this 4-bedroom, 1.5-bath home full of potential! Many of the major updates have already been completed, including a newer roof and HVAC system. The main level features a spacious kitchen, living room, dining room, convenient main-floor laundry, storage space, and a half bath. Upstairs, you’ll find four bedrooms and a full bath. Situated on just over a quarter-acre lot, the property also includes a detached 2-car garage and plenty of room to make it your own. Bring your ideas and finishing touches to transform this home into exactly what you envision. Home is being sold as-is. Seller to perform no inspections or repairs.
Key facts
- Newer roof
- Spacious kitchen
- Storage space
Tags
Property features AI
Finance
- Other: Living area listed as 1,632 (public records)
- Financial info: Lease not considered
Exterior
- Parking: 2-car garage
- Utilities: Public water; Public sewer (sewer connected); Electric service by Ameren
- Home design: Single family residence; Residential property; Private ownership; Fixer condition; Two-story
- Construction: Brick veneer and wood siding construction
- Exterior features: Back yard
Interior
- Bedrooms: 4 bedrooms (all on upper level)
- Bathrooms: 1 full bath; 1 half bath (main level)
- Heating & cooling: Forced air heating; Central air conditioning
- Interior features: Finished full basement with interior entry and a bathroom; Two levels
Neighborhood map
What this means for you Summary
Snapshot
- This is a 4-bed/1.5-bath other listed at $150k.
Deal economics
- At list price, monthly cash flow is $157 ($2k/yr) — positive.
- The deal already cash-flows at list — no discount required.
- To meet the 1% rule (rent ≥ 1% of price), the offer needs to be $140k (6.4% below list).
- Recommended offer: $140k (6.4% below list) — sets the bar for 1% rule.
- Cap rate 7.5% vs local median 3.2% in Murphy — top-decile yield for the area; either an underpriced asset or a hidden risk that comps aren't pricing in. Stress-test before assuming the spread holds.
Location & tenants
- Location reads 60/100 on livability (#461 in MO) — a middle-class / working-renter tenant base. Strengths: cost of living A+, housing A+; Watch: crime D+, employment D+, amenities F.
- Northwest R-I (suburban): math 37% / reading 43% proficiency, ranked #128 of 324 in MO (top 40%) — families likely to look elsewhere, expect single-tenant / working-renter base with shorter leases.
- Zoned schools: Brennan Woods Elem. (math 57% / reading 52%, grade C, #190 of 1,115 statewide, top 19%, 481 students, 31% FRL); Northwest High (math 26% / reading 56%, grade F, #236 of 521 statewide, top 45%, 1,841 students, 27% FRL).
- Market conditions: 92 active listings in the ZIP; 807 units permitted in Jefferson County in 2024 (104 in 5+ unit buildings).
Forward outlook
- Local home prices are declining (-3.0%/yr); year-one equity from $1k of loan paydown is wiped out by about $4k of value loss. Plan a longer hold.
Negotiation context
- It's been on market 38 days — a 3% lower offer ($145k) is reasonable based on typical stale-listing flexibility.
Risks & watch-outs
- Climate carrying-cost: extreme-heat days projected 7→21/yr by 2055 (HVAC capex compounding) — expect insurance premiums to compound above CPI over the hold.
Questions for the listing agent
- It's been on market 38 days. Have you received any prior offers? Is the seller open to a 6% concession, seller financing, or rate buy-down credit?
- Built in 1962 — when were the roof, HVAC, electrical panel, plumbing, and water heater last replaced?
- Is there a deadline driving the sale (1031 exchange, divorce, estate, relocation)? That informs how much negotiation room exists.
- Schools are F-rated, which usually means shorter tenancies and higher turnover. Who's the typical renter profile here, and what's been the actual vacancy rate?
- Crime grade is D in this area — have there been break-ins, vandalism, or insurance claims at this property in the last 3 years? What carrier currently insures it and at what premium?
- What's the average days-on-market for RENTAL listings here right now (not sales)? A rising rental-DOM trend means longer vacancies and softer asking-rent achievability than the comps imply.
- What's the recent tenant-quality profile in this submarket — average credit score on applications, eviction rate, late-payment / NSF rate, and stable-employment percentage? A property-management company in the area should have these aggregated.
- How much new for-sale + rental construction is in the pipeline within 1–3 miles? Heavy new supply typically softens prices + rents 12–24 months out; constrained supply supports both.
Investment metrics
- 1% rule
- 0.94% ✗
- Cap rate
- 7.55%
- Cash-on-cash
- 4.48%
- DSCR
- 1.20
- GRM
- 8.9
CMA / ARV
- ARV (median comp)
- $209,749
- List price
- $149,900
- Delta
- -28.53%
- Verdict
- UNDERPRICED
- Comps
- 20 within 1.0 mi
Projected returns pro-forma
-3.0% appreciation · 3.0% rent growth · sell at horizon
- IRR
- -9.3%
- Equity multiple
- 0.66×
- Total profit
- $-14,339
- Equity at exit
- $22,351
- IRR
- 0.1%
- Equity multiple
- 1.01×
- Total profit
- $242
- Equity at exit
- $12,961
Cash invested: $41,972 (down + closing). Projections, not guarantees.
Landlord ↔ Tenant lean methodology
- Overall (STATE)
- 81 Strongly Landlord-Friendly
- State Missouri
- 81 Strongly Landlord-Friendly · R+10
- County
- — inherits STATE
- City
- — inherits STATE
ZIP-level market 63049
- Active inventory
- 92
- Price-to-rent
- 8.9×
Monthly cashflow live
- Estimated rent
- $1,403 medium interval (Pro) →
- Mortgage (P&I)
- −$786
- Tax from tax record
- −$103 /mo · $1,239/yr
- Insurance
- −$62
- HOA
- −$0
- Vacancy / Maint / Mgmt
- −$295
- Net cashflow
- $157
Break-even live
Sensitivity live
| Price | -10% $242 | -5% $199 | +0% $157 | +5% $114 | +10% $72 |
|---|---|---|---|---|---|
| Rent | -10% $46 | -5% $101 | +0% $157 | +5% $212 | +10% $268 |
| Rate | -1.0pp $232 | -0.5pp $195 | base $157 | +0.5pp $118 | +1.0pp $78 |
UW: 25.0% down · 7.5% · 30yr · 1.5% tax · 5.0% vac · 8.0% maint · 8.0% mgmt
Financing live
Cash to close
- Down payment
- $37,475
- Closing costs
- $4,497
- Reserves months
- —
- Total cash needed
- —
Loan-product check · same deal, 3 products live
Conventional
25% down · 7.5% · 30yr
- Down + closing
- —
- Monthly P&I
- —
- Monthly cashflow
- —
- DSCR
- —
- Eligible?
- —
Personal DTI + credit; lowest rate.
DSCR
20% down · 8.5% · 30yr
- Down + closing
- —
- Monthly P&I
- —
- Monthly cashflow
- —
- DSCR
- —
- Eligible?
- —
No personal income docs; deal must DSCR.
Hard money
10% down · 12.0% · 12mo
- Down + closing
- —
- Monthly P&I
- —
- Monthly cashflow
- —
- DSCR
- —
- Eligible?
- —
Short-term bridge; refi at stabilization.
Listing history 17 events
-
2026-06-21days on market $149,900 Active 38 DOM
-
2026-06-18days on market $149,900 Active 35 DOM
-
2026-06-17days on market $149,900 Active 34 DOM
-
2026-06-16days on market $149,900 Active 33 DOM
-
2026-06-15days on market $149,900 Active 32 DOM
-
2026-06-13days on market $149,900 Active 30 DOM
-
2026-06-13days on market $149,900 Active 29 DOM
-
2026-06-09days on market $149,900 Active 26 DOM
-
2026-06-08days on market $149,900 Active 25 DOM
-
2026-06-07days on market $149,900 Active 24 DOM
-
2026-06-05days on market $149,900 Active 21 DOM
-
2026-06-03days on market $149,900 Active 20 DOM
-
2026-06-02days on market $149,900 Active 19 DOM
-
2026-06-01days on market $149,900 Active 18 DOM
-
2026-05-31days on market $149,900 Active 17 DOM
-
2026-05-14$149,900 Active 668-char remark
-
2026-02-13soldstatus
ⓘ Source: listings_history table (triggers on properties + properties_extension) + one-shot
backfill from property_details.listing_events for pre-trigger history.
Tax reassessment forecast MO · Resets to sale price
- Current annual tax
- $1,239 · $103/mo
- Projected year-2 tax
- $1,454 · $121/mo
- Expected delta
- +$215/yr (+$18/mo · 17.3%)
ⓘ Screening estimate from a state-policy table — verify with the county assessor before closing.
Climate risk First Street
- Flood 1/10 Low FEMA zone X (unshaded) · 0% chance over 30 yrs
- Wildfire 3/10 Moderate
- Heat 5/10 Major 7 d/yr ≥106°F today · 21 d/yr by 30 yrs out
- Wind 2/10 Low 100% chance of damaging wind over 30 yrs
- Air quality 3/10 Moderate 2 unhealthy d/yr today · 4 by 30 yrs out
Nearby sold comps map
Loading sold comps map…
Walkable amenities ~0.75 mi
Loading nearby amenities…
Taxation est. · year 1
- Rental income
- $16,839
- − Mortgage interest
- −$8,397
- − Property taxes
- −$1,239
- − Insurance
- −$750
- − Repairs & maintenance
- −$1,347
- − Management
- −$1,347
- − Depreciation
- −$4,361
- Taxable loss
- −$602
- Est. tax savings @ 24.0%
- +$144
- After-tax cash flow
- $2,025/yr
For passive investors: Depreciation is non-cash, so a rental often shows a tax loss while cash-flowing — sheltering income. Rental losses are passive: they offset passive income freely, and up to $25,000/yr can offset ordinary (W-2) income if you actively participate and your MAGI is under $100k (phasing out to $0 by $150k); unused losses carry forward. On sale, claimed depreciation is recaptured at up to 25%, and gains may owe capital-gains tax (a 1031 exchange can defer both). Figures are a year-1 estimate at your 24.0% rate — not tax advice; consult a CPA.
Schools (NCES district)
- District
- Northwest R-I
- NCES district ID
- 2922890
- Math proficiency
- 37% ▼ -9.00%
- Reading proficiency
- 43% ▼ -9.00%
- Median HH income
- $55,998
- Composite
- 35.05/100
- National rank
- #5034
- State rank
- #128 of 324 in MO
Livability — Murphy
- Score
- 60/100
- State rank
- #461
- US rank
- #18506
Category grades
Schools grade is shown separately in the Schools card above.
Census & demographics
- Census place
- Murphy, MO
- Population (ZIP)
- 17,480
Population outlook (Jefferson County) Hauer SSP2
- Today (2025)
- 235,088 people
- By 2030
- 238,365 · +1.4%
- By 2040
- 240,156 · +2.2%
- By 2050
- 234,651 · -0.2%
- By 2075
- 214,569 · -8.7%
- By 2100
- 179,697 · -23.6%
Race, ethnicity, and origin ACS 2023
- Neighborhood character
- Predominantly White (87%)
- Race & ethnicity
- White 87% Two or more races 7% Hispanic / Latino 5% Asian 2%
- Hispanic origin (detail)
- Mexican 3%
- Common ancestry
- Lithuanian 4% Serbian 2% Slovak 1%
- Foreign-born
- 4% · Canada, Vietnam, South Korea
- Languages at home
- 93% English-only · Spanish 5% Russian/Polish/Slavic 1% Other Asian/Pacific 1%
Political lean MEDSL · Jefferson
- 2024 margin
- Solid R (+36.7) · D 31.0% · R 67.7% · Other 1.3%
- 2008→2024 swing
- -39.3pp toward R · 2008: 2.5pp · 2024: -36.7pp
- All cycles
- 2024: R+36.7 2020: R+33.9 2016: R+35.3 2012: R+12.7 2008: D+2.5
Not yet ingested
- Civics
- —
Market trends
- HPI YoY
- ▼ -222.26%
- Current HPI
- 185.2698
- Rent YoY
- —
- Metro
- —
- State GDP YoY
- ▲ 1.84%
- F500 in state
- 20
Industry mix (Fortune 500 HQ in MO)
| Industry | F500 HQs | Revenue |
|---|---|---|
| Healthcare | 1 | $163B |
|
||
| Insurance | 1 | $21B |
|
||
| Industrial Technology | 1 | $17B |
|
||
| Retail | 1 | $16B |
|
||
| Industrial Distribution | 1 | $10B |
|
||
| Utilities | 1 | $9B |
|
||
Price history
2 events — show timeline
- 2026-05-14 Listed $149,900 MARIS as Distributed by MLS Grid
- 2026-02-13 Sold (Public Records) — Public Records
Property tax history
+2.7%/yrLatest (2025): $1,239 · +6.0% YoY. Source: county tax records.
Cash-flow waterfall
monthlySold comps — $/sqft
last 12 mo · ≤1 miLoading sold comps…