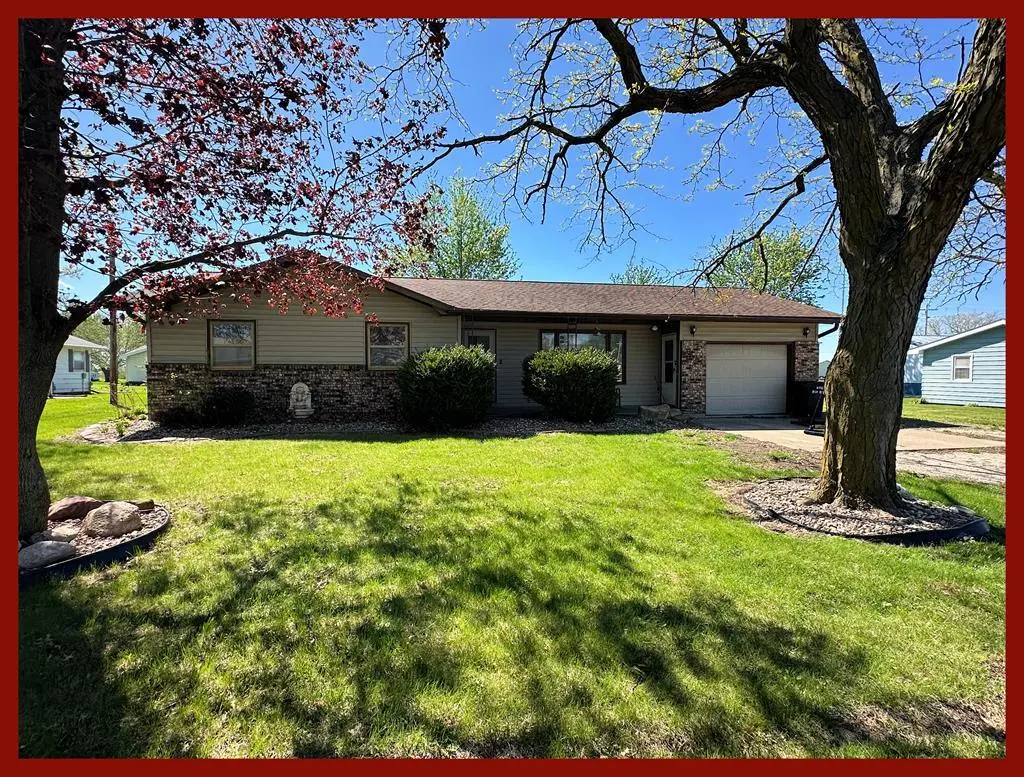
510 S 26th Pl · Unionville, MO
Flood risk 1/10 · Minimal
- FEMA flood zone
- X (unshaded)
- Chance of flooding over 30 yrs
- 0.0%
- Est. flood insurance / yr
- $507 – $1,088
Fire risk 3/10 · Minor
- Est. fire insurance / yr
- $1,054 – $1,958
Heat risk 3/10 · Minor
- Hot days now (above 104°F)
- 7 days/yr
- Hot days in 30 yrs
- 15 days/yr
Wind risk 2/10 · Minimal
- Chance of severe wind over 30 yrs
- —
Air-quality risk 2/10 · Minimal
- Unhealthy air days now
- 0 days/yr
- Unhealthy air days in 30 yrs
- 2 days/yr
Risk factors via First Street. Map © Google.
Why this score? — see what drove the D- grade
The composite is a weighted blend of 9 inputs, each scored 0–100. Each bar is that input's sub-score; the figure is the points it added to the 100-point composite (weight × sub-score).
- Cash flow +9.8/30.0
- Appreciation +6.2/10.0
- ARV discount +5.8/15.0
- Schools +3.8/10.0
- Livability +3.2/5.0
- DSCR +2.8/10.0
- Rent growth +2.5/5.0
- Condition / age +2.5/5.0
- 1% rule +2.1/10.0
$139,900
🖨 Deal sheet (PDF) 📄 Offer letter ✓ Due diligence
Listing remarks
SPRING MARKET SPECIAL! This 3 bedroom, 1.5 bath ranch is ready for new owners! Home has lots of updates in kitchen, baths, flooring & paint. Great floorplan includes big livingroom with picture windows, eat-in kitchen with plenty of cabinet space and mudroom & laundry room off the garage perfect for keeping all of the coats, shoes and bags organized! Step out from the dining room to nice deck and flat yard with established landscaping and plenty of room for relaxing or playing. Oversized storage shed and attached garage offer ample storage. This property is located in a great location with tons of friendly neighbors! Call Megan Roof for your tour! 660-988-2050 or visit Remax.com
Key facts
- Big livingroom
- Laundry room
- Nice deck
Tags
Property features AI
Exterior
- Parking: Attached garage (1 car)
- Utilities: Public water; Public sewer; Cable available; Natural gas available
- Home design: Single family residence; Residential property
- Construction: Brick and vinyl siding exterior; Asphalt roof; Crawl space foundation
- Exterior features: Deck; Storm door(s); 100' x 130' lot
Interior
- Kitchen: Dishwasher; Electric oven; Electric range; Microwave
- Flooring: Laminate flooring; Vinyl flooring
- Bathrooms: 1 full bathroom; 1 half bathroom
- Heating & cooling: Central air; Ceiling fans
- Interior features: Dishwasher; Electric oven; Electric range; Microwave; Electric water heater
- Laundry & utility: Electric water heater
Neighborhood map
What this means for you Summary
Snapshot
- This is a 3-bed/2.0-bath single-family listed at $140k.
Deal economics
- At list price, monthly cash flow is $-88 ($-1k/yr) — negative.
- To cash-flow at today's rent, offer at most $124k (11.2% below list).
- To meet the 1% rule (rent ≥ 1% of price), the offer needs to be $99k (29.0% below list).
- Recommended offer: $99k (29.0% below list) — sets the bar for 1% rule.
Location & tenants
- Location reads 63/100 on livability (#361 in MO) — a middle-class / working-renter tenant base. Strengths: cost of living A+, housing A+, crime B+; Watch: amenities F, commute F, employment F.
- Putnam County R-I (rural): math 43% / reading 48% proficiency, ranked #100 of 324 in MO (top 31%) — families likely to look elsewhere, expect single-tenant / working-renter base with shorter leases.
- Zoned schools: Putnam Co. Elem. (math 37% / reading 52%, grade F, #413 of 1,115 statewide, top 42%, 299 students, 53% FRL); Putnam Co. Middle (math 42% / reading 42%, grade D-, #149 of 391 statewide, top 41%, 146 students, 61% FRL); Putnam Co. High (math 64% / reading 62%, grade B-, #25 of 521 statewide, top 5%, 209 students, 38% FRL).
- Market conditions: 107 active listings in the ZIP.
Forward outlook
- In year one you build about $4k of equity ($967 loan paydown + $3k appreciation (2.5% local appreciation)).
- Putnam County population projected at -21% by 2050 — secular population decline; favor cash flow + early exit over multi-decade hold.
- By year 8, paydown + projected appreciation supports a ~$33k cash-out refi (75% LTV) — recoverable capital for the next deal without selling this one.
Negotiation context
- It's been on market 61 days — a 6% lower offer ($132k) is reasonable based on typical stale-listing flexibility.
- 6 sale attempts since 10y ago with the ask held roughly flat each time — persistent listings suggest the price (not the market) is what's stuck; bring a comps-based counter.
Questions for the listing agent
- What do current leases actually rent for vs. the listed asking? Can we see a recent rent roll and the last 12 months of T-12 income?
- It's been on market 61 days. Have you received any prior offers? Is the seller open to a 29% concession, seller financing, or rate buy-down credit?
- Built in 1977 — when were the roof, HVAC, electrical panel, plumbing, and water heater last replaced?
- Why hasn't it sold? Are there any deal-killer items the seller is aware of (foundation, flood, title, zoning, code violations)?
- Is there a deadline driving the sale (1031 exchange, divorce, estate, relocation)? That informs how much negotiation room exists.
- The area grade is low — what's the realistic commute time and amenity access for the typical tenant pool here? Any planned neighborhood developments (good or bad) we should know about?
- What's the average days-on-market for RENTAL listings here right now (not sales)? A rising rental-DOM trend means longer vacancies and softer asking-rent achievability than the comps imply.
- What's the recent tenant-quality profile in this submarket — average credit score on applications, eviction rate, late-payment / NSF rate, and stable-employment percentage? A property-management company in the area should have these aggregated.
- How much new for-sale + rental construction is in the pipeline within 1–3 miles? Heavy new supply typically softens prices + rents 12–24 months out; constrained supply supports both.
Investment metrics
- 1% rule
- 0.71% ✗
- Cap rate
- 5.53%
- Cash-on-cash
- -2.71%
- DSCR
- 0.88
- GRM
- 11.7
CMA / ARV
- ARV (median comp)
- $134,906
- List price
- $139,900
- Delta
- 3.70%
- Verdict
- FAIR
- Comps
- 6 within 1.0 mi
Show comp detail 2 sales within ~0.75 mi
| Address | Dist | Beds/Ba | Sqft | Sold | Price | $/sf | Match |
|---|---|---|---|---|---|---|---|
| 325 27th St | 0.43mi | 2/1.5 (-1) | 1,100 (-7%) | 1mo | $169,000 | $154 | 60 |
| 510 S 18th St | 0.57mi | 2/1.5 (-1) | 1,026 (-13%) | 4mo | $80,000 | $78 | 41 |
Match score weights: distance 35% · size 25% · config 20% · recency 20%. Top-matched comps best support the ARV.
Projected returns pro-forma
2.49% appreciation · 3.0% rent growth · sell at horizon
- IRR
- 3.4%
- Equity multiple
- 1.19×
- Total profit
- $7,434
- Equity at exit
- $58,922
- IRR
- 6.9%
- Equity multiple
- 2.00×
- Total profit
- $39,076
- Equity at exit
- $87,822
Cash invested: $39,172 (down + closing). Projections, not guarantees.
Landlord ↔ Tenant lean methodology
- Overall (STATE)
- 81 Strongly Landlord-Friendly
- State Missouri
- 81 Strongly Landlord-Friendly · R+10
- County
- — inherits STATE
- City
- — inherits STATE
ZIP-level market 63565
- Home prices YoY
- 1.4%
- Active inventory
- 107
- Price-to-rent
- 11.7×
Monthly cashflow live
- Estimated rent
- $993 medium interval (Pro) →
- Mortgage (P&I)
- −$734
- Tax from tax record
- −$81 /mo · $974/yr
- Insurance
- −$58
- HOA
- −$0
- Vacancy / Maint / Mgmt
- −$209
- Net cashflow
- $-88
Break-even live
Sensitivity live
| Price | -10% $-9 | -5% $-49 | +0% $-88 | +5% $-128 | +10% $-168 |
|---|---|---|---|---|---|
| Rent | -10% $-167 | -5% $-128 | +0% $-88 | +5% $-49 | +10% $-10 |
| Rate | -1.0pp $-18 | -0.5pp $-53 | base $-88 | +0.5pp $-125 | +1.0pp $-162 |
UW: 25.0% down · 7.5% · 30yr · 1.5% tax · 5.0% vac · 8.0% maint · 8.0% mgmt
Financing live
Cash to close
- Down payment
- $34,975
- Closing costs
- $4,197
- Reserves months
- —
- Total cash needed
- —
Loan-product check · same deal, 3 products live
Conventional
25% down · 7.5% · 30yr
- Down + closing
- —
- Monthly P&I
- —
- Monthly cashflow
- —
- DSCR
- —
- Eligible?
- —
Personal DTI + credit; lowest rate.
DSCR
20% down · 8.5% · 30yr
- Down + closing
- —
- Monthly P&I
- —
- Monthly cashflow
- —
- DSCR
- —
- Eligible?
- —
No personal income docs; deal must DSCR.
Hard money
10% down · 12.0% · 12mo
- Down + closing
- —
- Monthly P&I
- —
- Monthly cashflow
- —
- DSCR
- —
- Eligible?
- —
Short-term bridge; refi at stabilization.
Listing history 26 events
-
2026-06-21days on market $139,900 Active 61 DOM
-
2026-06-21days on market $139,900 Active 60 DOM
-
2026-06-18days on market $139,900 Active 58 DOM
-
2026-06-17days on market $139,900 Active 57 DOM
-
2026-06-16days on market $139,900 Active 56 DOM
-
2026-06-15days on market $139,900 Active 55 DOM
-
2026-06-13days on market $139,900 Active 53 DOM
-
2026-06-12days on market $139,900 Active 52 DOM
-
2026-06-09days on market $139,900 Active 49 DOM
-
2026-06-08days on market $139,900 Active 48 DOM
-
2026-06-07days on market $139,900 Active 47 DOM
-
2026-06-07days on market $139,900 Active 46 DOM
-
2026-06-04days on market $139,900 Active 43 DOM
-
2026-06-02days on market $139,900 Active 42 DOM
-
2026-06-01days on market $139,900 Active 41 DOM
-
2026-05-31days on market $139,900 Active 40 DOM
-
2026-04-21$139,900 Active 789-char remark
-
2025-10-14$150,000 Active
-
2019-03-29soldstatus
-
2019-01-15$82,500
-
2018-05-23soldstatus
-
2018-01-27$43,900
-
2018-01-09soldstatus
-
2017-10-19$24,800
-
2016-10-05$73,900
-
2004-05-17soldstatus
ⓘ Source: listings_history table (triggers on properties + properties_extension) + one-shot
backfill from property_details.listing_events for pre-trigger history.
Tax reassessment forecast MO · Resets to sale price
- Current annual tax
- $974 · $81/mo
- Projected year-2 tax
- $1,357 · $113/mo
- Expected delta
- +$383/yr (+$32/mo · 39.3%)
ⓘ Screening estimate from a state-policy table — verify with the county assessor before closing.
Climate risk First Street
- Flood 1/10 Low FEMA zone X (unshaded) · 0% chance over 30 yrs
- Wildfire 3/10 Moderate
- Heat 3/10 Moderate 7 d/yr ≥104°F today · 15 d/yr by 30 yrs out
- Wind 2/10 Low
- Air quality 2/10 Low 0 unhealthy d/yr today · 2 by 30 yrs out
Nearby sold comps map
Loading sold comps map…
Walkable amenities ~0.75 mi
Loading nearby amenities…
Taxation est. · year 1
- Rental income
- $11,920
- − Mortgage interest
- −$7,837
- − Property taxes
- −$974
- − Insurance
- −$700
- − Repairs & maintenance
- −$954
- − Management
- −$954
- − Depreciation
- −$4,070
- Taxable loss
- −$3,568
- Est. tax savings @ 24.0%
- +$856
- After-tax cash flow
- $-205/yr
For passive investors: Depreciation is non-cash, so a rental often shows a tax loss while cash-flowing — sheltering income. Rental losses are passive: they offset passive income freely, and up to $25,000/yr can offset ordinary (W-2) income if you actively participate and your MAGI is under $100k (phasing out to $0 by $150k); unused losses carry forward. On sale, claimed depreciation is recaptured at up to 25%, and gains may owe capital-gains tax (a 1031 exchange can defer both). Figures are a year-1 estimate at your 24.0% rate — not tax advice; consult a CPA.
Schools (NCES district)
- District
- Putnam County R-I
- NCES district ID
- 2925640
- Math proficiency
- 43% ▼ -5.00%
- Reading proficiency
- 48% ▼ -2.00%
- Median HH income
- $37,212
- Composite
- 37.82/100
- National rank
- #4334
- State rank
- #100 of 324 in MO
Livability — Unionville
- Score
- 63/100
- State rank
- #361
- US rank
- #15905
Category grades
Schools grade is shown separately in the Schools card above.
Census & demographics
- Census place
- Unionville, MO
- Population (ZIP)
- 3,975
Population outlook (Putnam County) Hauer SSP2
- Today (2025)
- 4,530 people
- By 2030
- 4,318 · -4.7%
- By 2040
- 3,922 · -13.4%
- By 2050
- 3,563 · -21.3%
- By 2075
- 2,855 · -37.0%
- By 2100
- 2,162 · -52.3%
Race, ethnicity, and origin ACS 2023
- Neighborhood character
- Predominantly White (96%)
- Race & ethnicity
- White 96% Two or more races 3% Hispanic / Latino 2%
- Common ancestry
- Slovak 4% Portuguese 2% Iranian 2%
- Foreign-born
- 2% · Canada
- Languages at home
- 96% English-only · German/W. Germanic 2% Spanish 2%
Political lean MEDSL · Putnam
- 2024 margin
- Solid R (+70.3) · D 14.6% · R 84.9%
- 2008→2024 swing
- -32.0pp toward R · 2008: -38.3pp · 2024: -70.3pp
- All cycles
- 2024: R+70.3 2020: R+68.7 2016: R+67.6 2012: R+47.0 2008: R+38.3
Not yet ingested
- Civics
- —
Market trends
- HPI YoY
- ▲ 2.49%
- Current HPI
- 183.3099
- Rent YoY
- —
- Metro
- —
- State GDP YoY
- ▲ 1.84%
- F500 in state
- 20
Industry mix (Fortune 500 HQ in MO)
| Industry | F500 HQs | Revenue |
|---|---|---|
| Healthcare | 1 | $163B |
|
||
| Insurance | 1 | $21B |
|
||
| Industrial Technology | 1 | $17B |
|
||
| Retail | 1 | $16B |
|
||
| Industrial Distribution | 1 | $10B |
|
||
| Utilities | 1 | $9B |
|
||
Price history
+89.3% since first listed10 events — show timeline
- 2026-04-21 Listed $139,900 NECAR
- 2025-10-14 Listed $150,000 NECAR
- 2019-03-29 Sold (MLS) — NECAR
- 2019-01-15 Listed $82,500 NECAR
- 2018-05-23 Sold (MLS) — Heartland MLS as Distributed by MLS Grid
- 2018-01-27 Listed $43,900 Heartland MLS as Distributed by MLS Grid
- 2018-01-09 Sold (MLS) — Heartland MLS as Distributed by MLS Grid
- 2017-10-19 Listed $24,800 Heartland MLS as Distributed by MLS Grid
- 2016-10-05 Listed $73,900 IAR
- 2004-05-17 Sold (Public Records) — Public Records
Property tax history
+3.8%/yrLatest (2025): $974 · +0.3% YoY. Source: county tax records.
Cash-flow waterfall
monthlySold comps — $/sqft
last 12 mo · ≤1 miLoading sold comps…