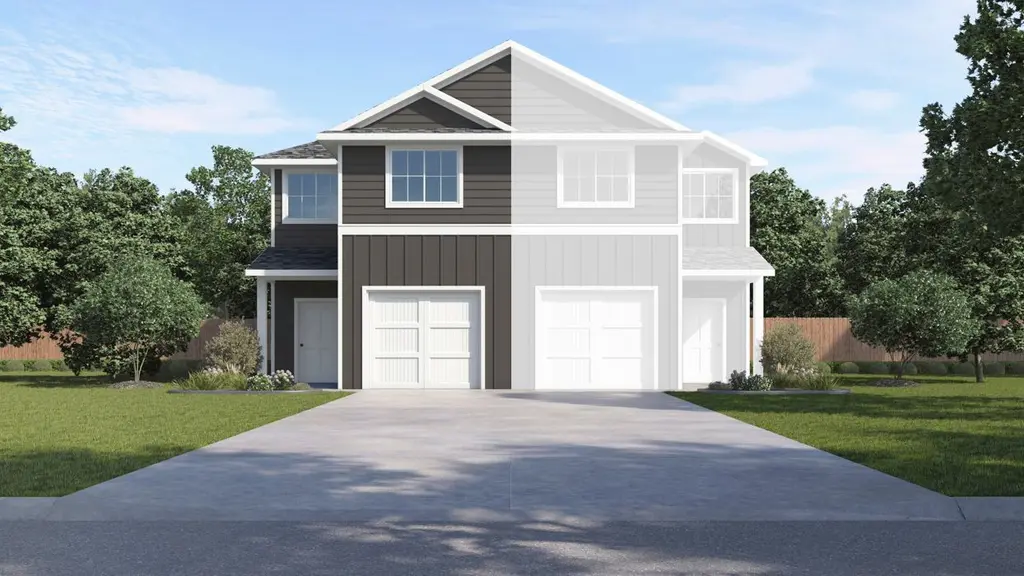
772 Stonewood Dr · Sulphur Springs, TX
Flood risk 1/10 · Minimal
- FEMA flood zone
- X (unshaded)
- Chance of flooding over 30 yrs
- 0.0%
- Est. flood insurance / yr
- $507 – $1,088
Fire risk 4/10 · Minor
- Est. fire insurance / yr
- $1,222 – $2,270
Heat risk 7/10 · Major
- Hot days now (above 109°F)
- 7 days/yr
- Hot days in 30 yrs
- 24 days/yr
Wind risk 6/10 · Moderate
- Chance of severe wind over 30 yrs
- 27.0%
Air-quality risk 2/10 · Minimal
- Unhealthy air days now
- 0 days/yr
- Unhealthy air days in 30 yrs
- 1 days/yr
Risk factors via First Street. Map © Google.
Why this score? — see what drove the D grade
The composite is a weighted blend of 9 inputs, each scored 0–100. Each bar is that input's sub-score; the figure is the points it added to the 100-point composite (weight × sub-score).
- Cash flow +11.5/30.0
- ARV discount +7.5/15.0
- Condition / age +4.8/5.0
- Schools +3.6/10.0
- 1% rule +3.5/10.0
- Livability +3.5/5.0
- DSCR +3.4/10.0
- Rent growth +2.5/5.0
- Appreciation +0.0/10.0
$226,990
🖨 Deal sheet 📄 Offer letter ✓ Due diligence
Listing remarks
This 3 bedroom 2.5 bath is perfect for first time buyers. Home offers an open floor plan with oversized shower in the ensuite. This home has all bedrooms upstairs, along with utility room for ease. These duplexes also make great investment opportunities.
Key facts
- Open floor plan
- Utility room
- Oversized shower
Tags
Property features AI
Finance
- Financial info: List price $226,990
Exterior
- Parking: 1-car garage (1 total parking space)
- Home design: Single-family property; Active listing
- Exterior features: Living area approximately 1,504
Interior
- Bedrooms: 3 bedrooms
- Bathrooms: 2 full bathrooms and 1 half bathroom
- Interior features: Spec home (Chesapeake plan)
Neighborhood map
What this means for you Summary
Snapshot
- This is a 3-bed/2.5-bath townhouse listed at $227k. Condition is rated excellent.
Deal economics
- At list price, monthly cash flow is $-75 ($-905/yr) — negative.
- To cash-flow at today's rent, offer at most $216k (4.8% below list).
- To meet the 1% rule (rent ≥ 1% of price), the offer needs to be $193k (15.1% below list).
- Recommended offer: $193k (15.1% below list) — sets the bar for 1% rule.
- Cap rate 5.9% vs local median 4.3% in Sulphur Springs — top-decile yield for the area; either an underpriced asset or a hidden risk that comps aren't pricing in. Stress-test before assuming the spread holds.
Location & tenants
- Location reads 70/100 on livability (#350 in TX) — a middle-class / working-renter tenant base. Strengths: cost of living A+, housing A+, crime A; Watch: employment D+, schools D, amenities F.
- Sulphur Springs ISD (town): math 46% / reading 40% proficiency, ranked #323 of 826 in TX (top 39%) — families likely to look elsewhere, expect single-tenant / working-renter base with shorter leases.
- Market conditions: 378 active listings in the ZIP; 2 comparable units currently listed for rent nearby; 66 units permitted in Hopkins County in 2024 (0 in 5+ unit buildings).
- This rent runs 33% of the median local income ($70k/yr) — at the standard rent-burdened threshold; future hikes will face affordability resistance.
Forward outlook
- Local home prices are declining (-3.0%/yr); year-one equity from $2k of loan paydown is wiped out by about $7k of value loss. Plan a longer hold.
- Hopkins County population projected at +6% by 2050 — modest demand growth; plan on rents tracking national, not racing it.
Negotiation context
- It's been on market 25 days — a 2% lower offer ($224k) is reasonable based on typical stale-listing flexibility.
Risks & watch-outs
- Climate carrying-cost: major wind risk, 27% chance of damaging wind over 30y; extreme-heat days projected 7→24/yr by 2055 (HVAC capex compounding) — expect insurance premiums to compound above CPI over the hold.
Questions for the listing agent
- What do current leases actually rent for vs. the listed asking? Can we see a recent rent roll and the last 12 months of T-12 income?
- What does the HOA fee cover, when was the last increase, and are there any pending special assessments or reserve-fund shortfalls?
- Is there a deadline driving the sale (1031 exchange, divorce, estate, relocation)? That informs how much negotiation room exists.
- Schools are D-rated, which usually means shorter tenancies and higher turnover. Who's the typical renter profile here, and what's been the actual vacancy rate?
- The area grade is low — what's the realistic commute time and amenity access for the typical tenant pool here? Any planned neighborhood developments (good or bad) we should know about?
- What's the average days-on-market for RENTAL listings here right now (not sales)? A rising rental-DOM trend means longer vacancies and softer asking-rent achievability than the comps imply.
- What's the recent tenant-quality profile in this submarket — average credit score on applications, eviction rate, late-payment / NSF rate, and stable-employment percentage? A property-management company in the area should have these aggregated.
- How much new for-sale + rental construction is in the pipeline within 1–3 miles? Heavy new supply typically softens prices + rents 12–24 months out; constrained supply supports both.
Investment metrics
- 1% rule
- 0.85% ✗
- Cap rate
- 5.89%
- Cash-on-cash
- -1.42%
- DSCR
- 0.94
- GRM
- 9.8
CMA / ARV
No comps found within radius.
Projected returns pro-forma
-3.0% appreciation · 3.0% rent growth · sell at horizon
- IRR
- -18.6%
- Equity multiple
- 0.35×
- Total profit
- $-41,537
- Equity at exit
- $33,845
- IRR
- -11.0%
- Equity multiple
- 0.34×
- Total profit
- $-42,161
- Equity at exit
- $19,626
Cash invested: $63,557 (down + closing). Projections, not guarantees.
Landlord ↔ Tenant lean methodology
- Overall (STATE)
- 87 Strongly Landlord-Friendly
- State Texas
- 87 Strongly Landlord-Friendly · R+5
- County
- — inherits STATE
- City
- — inherits STATE
ZIP-level market 75482
- Active inventory
- 378
- Price-to-rent
- 9.8×
Monthly cashflow live
- Estimated rent
- $1,928 medium interval (Pro) →
- Mortgage (P&I)
- −$1,190
- Tax est. 1.5%
- −$284 /mo · $3,405/yr
- Insurance
- −$95
- HOA
- −$30
- Vacancy / Maint / Mgmt
- −$405
- Net cashflow
- $-75
Break-even live
UW: 25.0% down · 7.5% · 30yr · 1.5% tax · 5.0% vac · 8.0% maint · 8.0% mgmt
Financing live
Cash to close
- Down payment
- $56,748
- Closing costs
- $6,810
- Reserves months
- —
- Total cash needed
- —
Loan-product check · same deal, 3 products live
Conventional
25% down · 7.5% · 30yr
- Down + closing
- —
- Monthly P&I
- —
- Monthly cashflow
- —
- DSCR
- —
- Eligible?
- —
Personal DTI + credit; lowest rate.
DSCR
20% down · 8.5% · 30yr
- Down + closing
- —
- Monthly P&I
- —
- Monthly cashflow
- —
- DSCR
- —
- Eligible?
- —
No personal income docs; deal must DSCR.
Hard money
10% down · 12.0% · 12mo
- Down + closing
- —
- Monthly P&I
- —
- Monthly cashflow
- —
- DSCR
- —
- Eligible?
- —
Short-term bridge; refi at stabilization.
Rent comps 2 comps
| Address | Beds | Baths | Sqft | Rent | $/sqft | DOM | Units | Dist |
|---|---|---|---|---|---|---|---|---|
| 709 Fuller St Sulphur Springs, TX | 3.0 | 2.0 | 1100 | $2,200 | $2.00 | 43d | 1 | 0.31mi |
| 604 W A St Sulphur Springs, TX | 3.0 | 2.0 | 1216 | $1,500 | $1.23 | 43d | 1 | 0.53mi |
HOA detail
- Monthly dues
- $30 · $360/yr
Listing history 16 events
-
2026-06-19days on market $226,990 Active 25 DOM
-
2026-06-18days on market $226,990 Active 24 DOM
-
2026-06-17days on market $226,990 Active 23 DOM
-
2026-06-16days on market $226,990 Active 22 DOM
-
2026-06-15days on market $226,990 Active 21 DOM
-
2026-06-14days on market $226,990 Active 19 DOM
-
2026-06-12days on market $226,990 Active 18 DOM
-
2026-06-09days on market $226,990 Active 15 DOM
-
2026-06-08days on market $226,990 Active 14 DOM
-
2026-06-07days on market $226,990 Active 13 DOM
-
2026-06-07days on market $226,990 Active 12 DOM
-
2026-06-03days on market $226,990 Active 9 DOM
-
2026-06-02days on market $226,990 Active 8 DOM
-
2026-06-01days on market $226,990 Active 7 DOM
-
2026-05-31days on market $226,990 Active 6 DOM
-
2026-05-30days on market $226,990 Active 5 DOM
ⓘ Source: listings_history table (triggers on properties + properties_extension) + one-shot
backfill from property_details.listing_events for pre-trigger history.
Climate risk First Street
- Flood 1/10 Low FEMA zone X (unshaded) · 0% chance over 30 yrs
- Wildfire 4/10 Moderate
- Heat 7/10 Severe 7 d/yr ≥109°F today · 24 d/yr by 30 yrs out
- Wind 6/10 Major 27% chance of damaging wind over 30 yrs
- Air quality 2/10 Low 0 unhealthy d/yr today · 1 by 30 yrs out
Nearby sold comps map
Loading sold comps map…
Walkable amenities ~0.75 mi
Loading nearby amenities…
Taxation est. · year 1
- Rental income
- $23,138
- − Mortgage interest
- −$12,715
- − Property taxes
- −$3,405
- − Insurance
- −$1,135
- − Repairs & maintenance
- −$1,851
- − Management
- −$1,851
- − HOA
- −$360
- − Depreciation
- −$6,603
- Taxable loss
- −$4,782
- Est. tax savings @ 24.0%
- +$1,148
- After-tax cash flow
- $243/yr
For passive investors: Depreciation is non-cash, so a rental often shows a tax loss while cash-flowing — sheltering income. Rental losses are passive: they offset passive income freely, and up to $25,000/yr can offset ordinary (W-2) income if you actively participate and your MAGI is under $100k (phasing out to $0 by $150k); unused losses carry forward. On sale, claimed depreciation is recaptured at up to 25%, and gains may owe capital-gains tax (a 1031 exchange can defer both). Figures are a year-1 estimate at your 24.0% rate — not tax advice; consult a CPA.
Condition & rehab AI · 1 photo
This home is in excellent condition with no visible repairs or maintenance needed. It offers a well-maintained and attractive exterior, making it a strong candidate for both resale and rental markets.
Value-add opportunities
- Both Painting the exterior — Enhances curb appeal and can increase both resale and rental value
- Both Landscaping improvements — Enhances curb appeal and can increase both resale and rental value
Renovation cost estimate screening
Value-add ROI direction
- Both Painting the exterior — Enhances curb appeal and can increase both resale and rental value ↑
- Both Landscaping improvements — Enhances curb appeal and can increase both resale and rental value ↑
ⓘ Cost ranges are severity-bucket heuristics (US national rule-of-thumb). Get contractor quotes + a written scope before underwriting a rehab budget.
Schools (NCES district)
- District
- Sulphur Springs ISD
- NCES district ID
- 4841820
- Math proficiency
- 46% ▼ -7.00%
- Reading proficiency
- 40% ▼ -4.00%
- Median HH income
- $42,871
- Composite
- 36.33/100
- National rank
- #4692
- State rank
- #323 of 826 in TX
Livability — Sulphur Springs
- Score
- 70/100
- State rank
- #350
- US rank
- #7665
Category grades
Schools grade is shown separately in the Schools card above.
Census & demographics
- Census place
- Sulphur Springs, TX
- County
- Hopkins County · 26,483 people
- City population
- 26,483
- Metro
- Sulphur Springs, TX
- Population (ZIP)
- 26,483
- Household income
- $69,970
- Rent vs Own
- Severe rent burden
- 543.0
Population outlook (Hopkins County) Hauer SSP2
- Today (2025)
- 38,107 people
- By 2030
- 38,867 · +2.0%
- By 2040
- 40,009 · +5.0%
- By 2050
- 40,448 · +6.1%
- By 2075
- 40,669 · +6.7%
- By 2100
- 37,234 · -2.3%
Race, ethnicity, and origin ACS 2023
- Neighborhood character
- Predominantly White (70%)
- Race & ethnicity
- White 70% Hispanic / Latino 17% Black 9% Two or more races 7% Asian 1%
- Hispanic origin (detail)
- Mexican 15%
- Common ancestry
- Slovak 2% Lithuanian 2% Iranian 1%
- Foreign-born
- 9% · Canada, Vietnam
- Languages at home
- 84% English-only · Spanish 14% Vietnamese 1%
Political lean MEDSL · Hopkins
- 2024 margin
- Solid R (+64.6) · D 17.4% · R 82.0%
- 2008→2024 swing
- -20.0pp toward R · 2008: -44.7pp · 2024: -64.6pp
- All cycles
- 2024: R+64.6 2020: R+60.7 2016: R+60.8 2012: R+55.4 2008: R+44.7
Not yet ingested
- Civics
- —
Market trends
- HPI YoY
- ▼ -125.79%
- Current HPI
- 156.0526
- Rent YoY
- —
- Metro
- Sulphur Springs, TX
- State GDP YoY
- ▲ 3.95%
- F500 in state
- 110
Industry mix (Fortune 500 HQ in TX)
| Industry | F500 HQs | Revenue |
|---|---|---|
| Energy | 16 | $1,198B |
|
||
| Technology | 5 | $198B |
|
||
| Engineering / Construction | 4 | $72B |
|
||
| Energy Services | 3 | $60B |
|
||
| Utilities | 3 | $41B |
|
||
| Healthcare | 2 | $330B |
|
||
Cash-flow waterfall
monthlySold comps — $/sqft
last 12 mo · ≤1 miLoading sold comps…