308 Fresno Trl · Frazier Park, CA
Flood risk No data
- FEMA flood zone
- —
- Chance of flooding over 30 yrs
- —
- Est. flood insurance / yr
- —
Fire risk No data
- Est. fire insurance / yr
- —
Heat risk No data
- Hot days now (above threshold)
- —
- Hot days in 30 yrs
- —
Wind risk No data
- Chance of severe wind over 30 yrs
- —
Air-quality risk No data
- Unhealthy air days now
- —
- Unhealthy air days in 30 yrs
- —
Risk factors via First Street. Map © Google.
Why this score? — see what drove the C+ grade
The composite is a weighted blend of 9 inputs, each scored 0–100. Each bar is that input's sub-score; the figure is the points it added to the 100-point composite (weight × sub-score).
- Cash flow +25.5/30.0
- ARV discount +15.0/15.0
- DSCR +8.5/10.0
- 1% rule +5.9/10.0
- Livability +2.6/5.0
- Rent growth +2.5/5.0
- Schools +2.5/10.0
- Condition / age +2.5/5.0
- Appreciation +0.0/10.0
$117,500
🖨 Deal sheet 📄 Offer letter ✓ Due diligence
Listing remarks MLS
Property is a Fixer
Key facts
- 3,490 sq ft lot
- Built 1955
- Listed 23 days
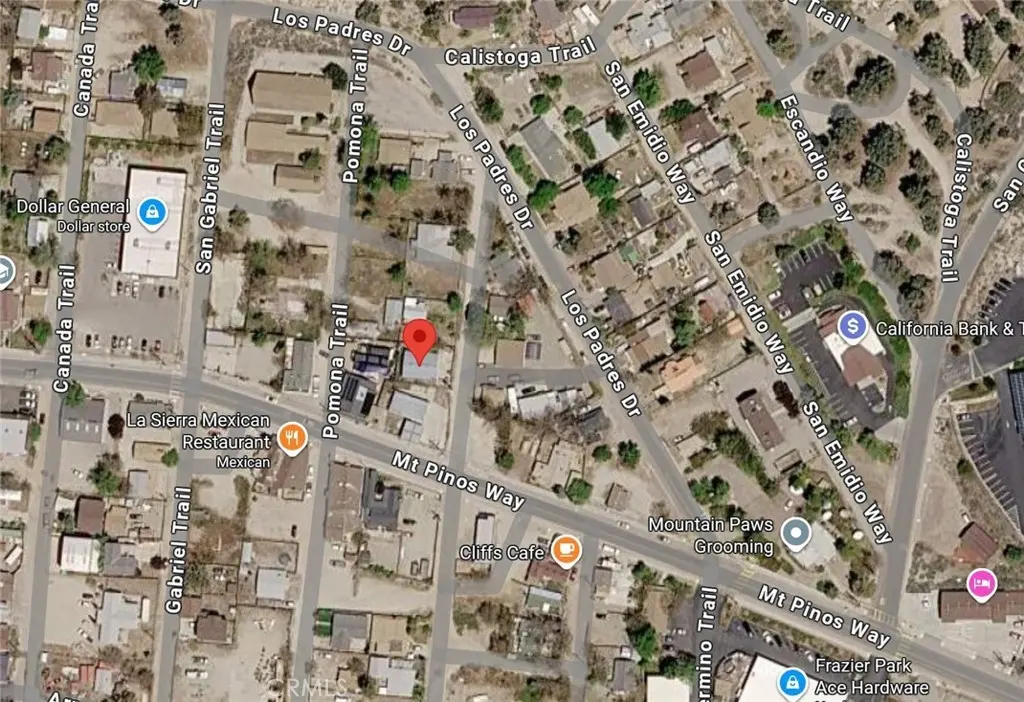
Neighborhood map
What this means for you Summary
Snapshot
- This is a 1-bed/1.0-bath single-family listed at $118k.
Deal economics
- At list price, monthly cash flow is $274 ($3k/yr) — positive.
- The deal already cash-flows at list — no discount required.
- Meets the 1% rule at list price ($1k rent vs $118k).
- Recommended offer: $116k (1.5% below list) — sets the bar for market timing.
- Cap rate 9.1% vs local median 4.6% in Frazier Park — top-decile yield for the area; either an underpriced asset or a hidden risk that comps aren't pricing in. Stress-test before assuming the spread holds.
Location & tenants
- Location reads 51/100 on livability (#1,064 in CA) — a working-class tenant base; expect higher turnover. Strengths: housing A; Watch: schools D+, amenities F, commute F.
- El Tejon Unified (rural): math 13% / reading 45% proficiency, ranked #361 of 517 in CA (top 70%) — low school quality limits family demand, transient renter base, plan for 1-2y turnover.
- Market conditions: 122 active listings in the ZIP; 3,244 units permitted in Kern County in 2024 (73 in 5+ unit buildings).
Forward outlook
- Local home prices are declining (-3.0%/yr); year-one equity from $812 of loan paydown is wiped out by about $4k of value loss. Plan a longer hold.
- Kern County population projected at +17% by 2050 — long-run rental-demand tailwind backs the buy-and-hold thesis.
Negotiation context
- It's been on market 23 days — a 2% lower offer ($116k) is reasonable based on typical stale-listing flexibility.
- Current owner paid $60k; list at $118k implies a 96% gain — meaningful room to come down on a strong offer.
Risks & watch-outs
- Watch-outs: built in 1955 — expect roof / HVAC / electrical / plumbing capex.
Questions for the listing agent
- Built in 1955 — when were the roof, HVAC, electrical panel, plumbing, and water heater last replaced?
- Is there a deadline driving the sale (1031 exchange, divorce, estate, relocation)? That informs how much negotiation room exists.
- Schools are D-rated, which usually means shorter tenancies and higher turnover. Who's the typical renter profile here, and what's been the actual vacancy rate?
- What's the average days-on-market for RENTAL listings here right now (not sales)? A rising rental-DOM trend means longer vacancies and softer asking-rent achievability than the comps imply.
- What's the recent tenant-quality profile in this submarket — average credit score on applications, eviction rate, late-payment / NSF rate, and stable-employment percentage? A property-management company in the area should have these aggregated.
- How much new for-sale + rental construction is in the pipeline within 1–3 miles? Heavy new supply typically softens prices + rents 12–24 months out; constrained supply supports both.
Investment metrics
- 1% rule
- 1.09% ✓
- Cap rate
- 9.10%
- Cash-on-cash
- 10.01%
- DSCR
- 1.45
- GRM
- 7.7
CMA / ARV
- ARV (median comp)
- $202,646
- List price
- $117,500
- Delta
- -40.78%
- Verdict
- UNDERPRICED
- Comps
- 6 within 1.0 mi
Projected returns pro-forma
-3.0% appreciation · 3.0% rent growth · sell at horizon
- IRR
- -1.3%
- Equity multiple
- 0.95×
- Total profit
- $-1,586
- Equity at exit
- $17,520
- IRR
- 8.4%
- Equity multiple
- 1.64×
- Total profit
- $21,016
- Equity at exit
- $10,159
Cash invested: $32,900 (down + closing). Projections, not guarantees.
Landlord ↔ Tenant lean methodology
- Overall (STATE)
- 18 Strongly Tenant-Friendly
- State California
- 18 Strongly Tenant-Friendly · D+13
- County
- — inherits STATE
- City
- — inherits STATE
ZIP-level market 93225
- Home prices YoY
- -5.5%
- Active inventory
- 122
- Price-to-rent
- 7.7×
Monthly cashflow live
- Estimated rent
- $1,279 medium interval (Pro) →
- Mortgage (P&I)
- −$616
- Tax from tax record
- −$71 /mo · $848/yr
- Insurance
- −$49
- HOA
- −$0
- Vacancy / Maint / Mgmt
- −$269
- Net cashflow
- $274
Break-even live
UW: 25.0% down · 7.5% · 30yr · 1.5% tax · 5.0% vac · 8.0% maint · 8.0% mgmt
Financing live
Cash to close
- Down payment
- $29,375
- Closing costs
- $3,525
- Reserves months
- —
- Total cash needed
- —
Loan-product check · same deal, 3 products live
Conventional
25% down · 7.5% · 30yr
- Down + closing
- —
- Monthly P&I
- —
- Monthly cashflow
- —
- DSCR
- —
- Eligible?
- —
Personal DTI + credit; lowest rate.
DSCR
20% down · 8.5% · 30yr
- Down + closing
- —
- Monthly P&I
- —
- Monthly cashflow
- —
- DSCR
- —
- Eligible?
- —
No personal income docs; deal must DSCR.
Hard money
10% down · 12.0% · 12mo
- Down + closing
- —
- Monthly P&I
- —
- Monthly cashflow
- —
- DSCR
- —
- Eligible?
- —
Short-term bridge; refi at stabilization.
Listing history 18 events
-
2026-06-18days on market $117,500 Active 23 DOM
-
2026-06-17days on market $117,500 Active 22 DOM
-
2026-06-16days on market $117,500 Active 21 DOM
-
2026-06-15days on market $117,500 Active 20 DOM
-
2026-06-14days on market $117,500 Active 18 DOM
-
2026-06-13days on market $117,500 Active 17 DOM
-
2026-06-10days on market $117,500 Active 15 DOM
-
2026-06-09days on market $117,500 Active 14 DOM
-
2026-06-08days on market $117,500 Active 13 DOM
-
2026-06-07days on market $117,500 Active 12 DOM
-
2026-06-05days on market $117,500 Active 9 DOM
-
2026-06-03days on market $117,500 Active 8 DOM
-
2026-06-03days on market $117,500 Active 7 DOM
-
2026-06-01days on market $117,500 Active 6 DOM
-
2026-05-31days on market $117,500 Active 5 DOM
-
2026-02-27$120,000 Active 19-char remark
Show marketing remark (19 chars)
Property is a Fixer
-
2023-08-10soldstatus $60,000
-
1980-01-31soldstatus $9,200
ⓘ Source: listings_history table (triggers on properties + properties_extension) + one-shot
backfill from property_details.listing_events for pre-trigger history.
Tax reassessment forecast CA · Resets to sale price
- Current annual tax
- $848 · $71/mo
- Projected year-2 tax
- $893 · $74/mo
- Expected delta
- +$45/yr (+$4/mo · 5.3%)
ⓘ Screening estimate from a state-policy table — verify with the county assessor before closing.
Nearby sold comps map
Loading sold comps map…
Walkable amenities ~0.75 mi
Loading nearby amenities…
Taxation est. · year 1
- Rental income
- $15,346
- − Mortgage interest
- −$6,582
- − Property taxes
- −$848
- − Insurance
- −$588
- − Repairs & maintenance
- −$1,228
- − Management
- −$1,228
- − Depreciation
- −$3,418
- Taxable income
- $1,455
- Est. tax owed @ 24.0%
- −$349
- After-tax cash flow
- $2,944/yr
For passive investors: Depreciation is non-cash, so a rental often shows a tax loss while cash-flowing — sheltering income. Rental losses are passive: they offset passive income freely, and up to $25,000/yr can offset ordinary (W-2) income if you actively participate and your MAGI is under $100k (phasing out to $0 by $150k); unused losses carry forward. On sale, claimed depreciation is recaptured at up to 25%, and gains may owe capital-gains tax (a 1031 exchange can defer both). Figures are a year-1 estimate at your 24.0% rate — not tax advice; consult a CPA.
Schools (NCES district)
- District
- El Tejon Unified
- NCES district ID
- 0600026
- Math proficiency
- 13% ▼ -12.00%
- Reading proficiency
- 45% ▼ -2.00%
- Median HH income
- $49,019
- Composite
- 25.15/100
- National rank
- #7519
- State rank
- #361 of 517 in CA
Livability — Frazier Park
- Score
- 51/100
- State rank
- #1064
- US rank
- #25253
Category grades
Schools grade is shown separately in the Schools card above.
Census & demographics
- Census place
- Frazier Park, CA
- Population (ZIP)
- 4,532
Population outlook (Kern County) Hauer SSP2
- Today (2025)
- 947,286 people
- By 2030
- 978,984 · +3.3%
- By 2040
- 1,045,018 · +10.3%
- By 2050
- 1,105,232 · +16.7%
- By 2075
- 1,229,538 · +29.8%
- By 2100
- 1,238,059 · +30.7%
Race, ethnicity, and origin ACS 2023
- Neighborhood character
- Predominantly White (83%)
- Race & ethnicity
- White 83% Hispanic / Latino 14% Two or more races 8%
- Hispanic origin (detail)
- Mexican 8%
- Common ancestry
- Slovak 5% Serbian 3% Portuguese 3%
- Foreign-born
- 9% · Canada, South Korea
- Languages at home
- 90% English-only · Spanish 8% Arabic 1%
Political lean MEDSL · Kern
- 2024 margin
- Strong R (+21.1) · D 38.2% · R 59.3% · Other 2.5%
- 2008→2024 swing
- -3.3pp toward R · 2008: -17.8pp · 2024: -21.1pp
- All cycles
- 2024: R+21.1 2020: R+10.2 2016: R+15.0 2012: R+20.9 2008: R+17.8
Not yet ingested
- Civics
- —
Market trends
- HPI YoY
- ▼ -20.47%
- Current HPI
- 354.6398
- Rent YoY
- —
- Metro
- —
- State GDP YoY
- ▲ 3.21%
- F500 in state
- 116
Industry mix (Fortune 500 HQ in CA)
| Industry | F500 HQs | Revenue |
|---|---|---|
| Technology | 27 | $1,492B |
|
||
| Financial Services | 3 | $174B |
|
||
| Retail | 3 | $44B |
|
||
| Insurance | 3 | $26B |
|
||
| Media / Entertainment | 2 | $115B |
|
||
| Pharmaceuticals / Biotech | 2 | $62B |
|
||
Price history
+1204.3% since first listed3 events — show timeline
- 2026-02-27 Listed $120,000 CRMLS
- 2023-08-10 Sold (Public Records) $60,000 Public Records
- 1980-01-31 Sold (Public Records) $9,200 Public Records
Property tax history
+8.3%/yrLatest (2025): $848 · +1.3% YoY. Source: county tax records.
Cash-flow waterfall
monthlySold comps — $/sqft
last 12 mo · ≤1 miLoading sold comps…