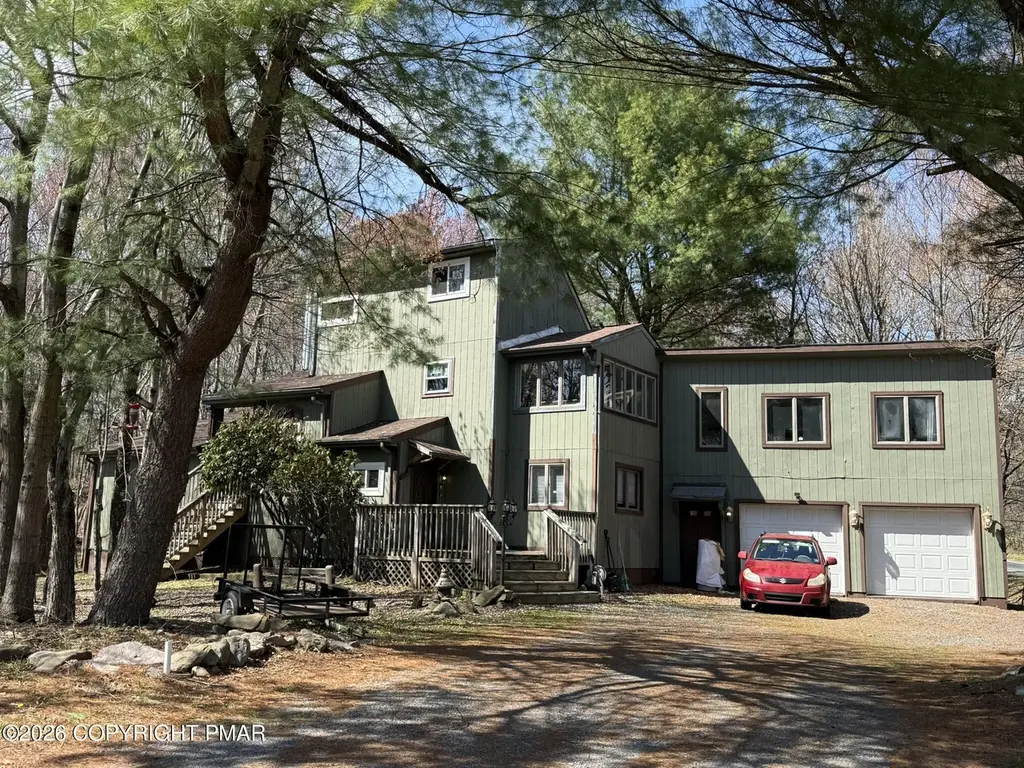
1412 Clover Rd · Tunkhannock, PA
Flood risk 1/10 · Minimal
- FEMA flood zone
- X (unshaded)
- Chance of flooding over 30 yrs
- 0.0%
- Est. flood insurance / yr
- $507 – $1,088
Fire risk 3/10 · Minor
- Est. fire insurance / yr
- $511 – $949
Heat risk 2/10 · Minimal
- Hot days now (above 90°F)
- 7 days/yr
- Hot days in 30 yrs
- 16 days/yr
Wind risk 4/10 · Minor
- Chance of severe wind over 30 yrs
- 7.0%
Air-quality risk 2/10 · Minimal
- Unhealthy air days now
- 1 days/yr
- Unhealthy air days in 30 yrs
- 2 days/yr
Risk factors via First Street. Map © Google.
Why this score? — see what drove the D+ grade
The composite is a weighted blend of 9 inputs, each scored 0–100. Each bar is that input's sub-score; the figure is the points it added to the 100-point composite (weight × sub-score).
- ARV discount +14.6/15.0
- Cash flow +10.8/30.0
- Appreciation +4.5/10.0
- Schools +4.0/10.0
- Livability +3.9/5.0
- 1% rule +3.5/10.0
- DSCR +3.1/10.0
- Rent growth +2.5/5.0
- Condition / age +2.5/5.0
$345,000
🖨 Deal sheet 📄 Offer letter ✓ Due diligence
Key facts
- 0.99 acre lot
- 3 garage spots
- Community pool
Neighborhood map
What this means for you Summary
Snapshot
- This is a 4-bed/3.0-bath single-family listed at $345k.
Deal economics
- At list price, monthly cash flow is $-160 ($-2k/yr) — negative.
- To cash-flow at today's rent, offer at most $317k (8.2% below list).
- To meet the 1% rule (rent ≥ 1% of price), the offer needs to be $293k (15.0% below list).
- Recommended offer: $293k (15.0% below list) — sets the bar for 1% rule.
Location & tenants
- Location reads 77/100 on livability (#371 in PA, #3,219 nationally) — a middle-class / working-renter tenant base. Strengths: cost of living A+, housing A, health & safety A-; Watch: employment D+, amenities F, commute F.
- Pocono Mountain SD (rural): math 37% / reading 55% proficiency, ranked #245 of 539 in PA (top 46%) — families likely to look elsewhere, expect single-tenant / working-renter base with shorter leases.
- Market conditions: 107 active listings in the ZIP; 3 comparable units currently listed for rent nearby; rentals lingering (median 44d on market — plan ~5-8 weeks vacancy on turnover, expect pricing pressure); 100% of comp listings sitting > 30 days — soft ceiling on asking rent; 278 units permitted in Monroe County in 2024 (52 in 5+ unit buildings).
Forward outlook
- Local home prices are declining (-0.9%/yr); year-one equity from $2k of loan paydown is wiped out by about $3k of value loss. Plan a longer hold.
- Monroe County population projected at -11% by 2050 — secular population decline; favor cash flow + early exit over multi-decade hold.
Negotiation context
- It's been on market 132 days — a 12% lower offer ($304k) is reasonable based on typical stale-listing flexibility.
- Current owner paid $85k; list at $345k implies a 306% gain — meaningful room to come down on a strong offer.
Questions for the listing agent
- What do current leases actually rent for vs. the listed asking? Can we see a recent rent roll and the last 12 months of T-12 income?
- It's been on market 132 days. Have you received any prior offers? Is the seller open to a 15% concession, seller financing, or rate buy-down credit?
- What does the HOA fee cover, when was the last increase, and are there any pending special assessments or reserve-fund shortfalls?
- Why hasn't it sold? Are there any deal-killer items the seller is aware of (foundation, flood, title, zoning, code violations)?
- Is there a deadline driving the sale (1031 exchange, divorce, estate, relocation)? That informs how much negotiation room exists.
- Schools are B-rated — typically a magnet for longer-tenancy family renters. What's the average tenant stay here, and is there a school-zone premium baked into asking?
- The area grade is low — what's the realistic commute time and amenity access for the typical tenant pool here? Any planned neighborhood developments (good or bad) we should know about?
- What's the average days-on-market for RENTAL listings here right now (not sales)? A rising rental-DOM trend means longer vacancies and softer asking-rent achievability than the comps imply.
- What's the recent tenant-quality profile in this submarket — average credit score on applications, eviction rate, late-payment / NSF rate, and stable-employment percentage? A property-management company in the area should have these aggregated.
- How much new for-sale + rental construction is in the pipeline within 1–3 miles? Heavy new supply typically softens prices + rents 12–24 months out; constrained supply supports both.
Investment metrics
- 1% rule
- 0.85% ✗
- Cap rate
- 5.74%
- Cash-on-cash
- -1.99%
- DSCR
- 0.91
- GRM
- 9.8
CMA / ARV
- ARV (median comp)
- $409,772
- List price
- $345,000
- Delta
- -15.81%
- Verdict
- UNDERPRICED
- Comps
- 20 within 1.0 mi
Show comp detail 12 sales within ~0.75 mi
| Address | Dist | Beds/Ba | Sqft | Sold | Price | $/sf | Match |
|---|---|---|---|---|---|---|---|
| 144 Overland Dr | 0.16mi | 4/2.5 | 1,884 (-9%) | 7mo | $334,800 | $178 | 70 |
| 265 Cedar Dr | 0.33mi | 5/2.5 (+1) | 2,237 (+8%) | 1mo | $610,000 | $273 | 63 |
| 1591 Clover Rd | 0.45mi | 4/2.0 | 1,938 (-6%) | 4mo | $332,500 | $172 | 62 |
| 130 Granite Rd Rd | 0.17mi | 3/2.0 (-1) | 1,764 (-15%) | 3mo | $330,000 | $187 | 56 |
| 2113 Wild Laurel Dr | 0.44mi | 3/3.0 (-1) | 2,200 (+6%) | 12mo | $280,000 | $127 | 54 |
| 2109 Wild Laurel Dr | 0.46mi | 4/2.5 | 2,220 (+8%) | 17mo | $365,000 | $164 | 50 |
| 255 Cedar Dr | 0.34mi | 3/2.0 (-1) | 1,828 (-12%) | 7mo | $765,000 | $418 | 50 |
| 195 Williams Ln | 0.46mi | 3/2.0 (-1) | 1,847 (-11%) | 4mo | $262,500 | $142 | 49 |
| 1648 Clover Rd | 0.71mi | 4/2.5 | 2,016 (-2%) | 17mo | $400,000 | $198 | 46 |
| 211 Beaver Dam Rd | 0.70mi | 4/2.5 | 2,236 (+8%) | 8mo | $368,500 | $165 | 45 |
| 104 Tumbleweed Dr | 0.75mi | 4/3.5 | 2,240 (+8%) | 18mo | $400,000 | $179 | 34 |
| 126 Crystal Dr | 0.53mi | 3/2.0 (-1) | 1,756 (-15%) | 18mo | $295,000 | $168 | 26 |
Match score weights: distance 35% · size 25% · config 20% · recency 20%. Top-matched comps best support the ARV.
Projected returns pro-forma
-0.95% appreciation · 3.0% rent growth · sell at horizon
- IRR
- -8.4%
- Equity multiple
- 0.63×
- Total profit
- $-35,262
- Equity at exit
- $84,143
- IRR
- -1.6%
- Equity multiple
- 0.85×
- Total profit
- $-14,487
- Equity at exit
- $89,095
Cash invested: $96,600 (down + closing). Projections, not guarantees.
Landlord ↔ Tenant lean methodology
- Overall (STATE)
- 62 Landlord-Friendly
- State Pennsylvania
- 62 Landlord-Friendly · EVEN
- County
- — inherits STATE
- City
- — inherits STATE
ZIP-level market 18334
- Home prices YoY
- -0.5%
- Active inventory
- 107
- Price-to-rent
- 9.8×
Monthly cashflow live
- Estimated rent
- $2,931 medium interval (Pro) →
- Mortgage (P&I)
- −$1,809
- Tax from tax record
- −$423 /mo · $5,075/yr
- Insurance
- −$144
- HOA
- −$100
- Vacancy / Maint / Mgmt
- −$616
- Net cashflow
- $-160
Break-even live
UW: 25.0% down · 7.5% · 30yr · 1.5% tax · 5.0% vac · 8.0% maint · 8.0% mgmt
Financing live
Cash to close
- Down payment
- $86,250
- Closing costs
- $10,350
- Reserves months
- —
- Total cash needed
- —
Loan-product check · same deal, 3 products live
Conventional
25% down · 7.5% · 30yr
- Down + closing
- —
- Monthly P&I
- —
- Monthly cashflow
- —
- DSCR
- —
- Eligible?
- —
Personal DTI + credit; lowest rate.
DSCR
20% down · 8.5% · 30yr
- Down + closing
- —
- Monthly P&I
- —
- Monthly cashflow
- —
- DSCR
- —
- Eligible?
- —
No personal income docs; deal must DSCR.
Hard money
10% down · 12.0% · 12mo
- Down + closing
- —
- Monthly P&I
- —
- Monthly cashflow
- —
- DSCR
- —
- Eligible?
- —
Short-term bridge; refi at stabilization.
Rent comps 3 comps
| Address | Beds | Baths | Sqft | Rent | $/sqft | DOM | Units | Dist |
|---|---|---|---|---|---|---|---|---|
| 152 Granite Rd Long Pond, PA | 4.0 | 2.5 | 2624 | $3,300 | $1.26 | 43d | 1 | 0.25mi |
| 2113 Wild Laurel Dr Long Pond, PA | 3.0 | 3.0 | 2200 | $2,500 | $1.14 | 43d | 1 | 0.44mi |
| 2267 Doe Dr Long Pond, PA | 4.0 | 3.0 | 2000 | $2,700 | $1.35 | 43d | 1 | 0.99mi |
HOA detail
- Monthly dues
- $100 · $1,200/yr
Listing history 17 events
-
2026-06-18days on market $345,000 Active 132 DOM
-
2026-06-17days on market $345,000 Active 131 DOM
-
2026-06-16days on market $345,000 Active 130 DOM
-
2026-06-15days on market $345,000 Active 129 DOM
-
2026-06-14days on market $345,000 Active 127 DOM
-
2026-06-13days on market $345,000 Active 126 DOM
-
2026-06-10days on market $345,000 Active 124 DOM
-
2026-06-08days on market $345,000 Active 122 DOM
-
2026-06-07days on market $345,000 Active 121 DOM
-
2026-06-02days on market $345,000 Active 116 DOM
-
2026-06-01days on market $345,000 Active 115 DOM
-
2026-05-31days on market $345,000 Active 114 DOM
-
2026-05-30days on market $345,000 Active 113 DOM
-
2026-05-05price $345,000
-
2026-02-20price $365,000
-
2026-01-23$375,000 Active
-
1995-04-05soldstatus $84,900
ⓘ Source: listings_history table (triggers on properties + properties_extension) + one-shot
backfill from property_details.listing_events for pre-trigger history.
Tax reassessment forecast PA · Partial reset (capped growth)
- Current annual tax
- $5,075 · $423/mo
- Projected year-2 tax
- $5,263 · $439/mo
- Expected delta
- +$188/yr (+$16/mo · 3.7%)
ⓘ Screening estimate from a state-policy table — verify with the county assessor before closing.
Climate risk First Street
- Flood 1/10 Low FEMA zone X (unshaded) · 0% chance over 30 yrs
- Wildfire 3/10 Moderate
- Heat 2/10 Low 7 d/yr ≥90°F today · 16 d/yr by 30 yrs out
- Wind 4/10 Moderate 7% chance of damaging wind over 30 yrs
- Air quality 2/10 Low 1 unhealthy d/yr today · 2 by 30 yrs out
Nearby sold comps map
Loading sold comps map…
Walkable amenities ~0.75 mi
Loading nearby amenities…
Taxation est. · year 1
- Rental income
- $35,176
- − Mortgage interest
- −$19,325
- − Property taxes
- −$5,075
- − Insurance
- −$1,725
- − Repairs & maintenance
- −$2,814
- − Management
- −$2,814
- − HOA
- −$1,200
- − Depreciation
- −$10,036
- Taxable loss
- −$7,814
- Est. tax savings @ 24.0%
- +$1,875
- After-tax cash flow
- $-46/yr
For passive investors: Depreciation is non-cash, so a rental often shows a tax loss while cash-flowing — sheltering income. Rental losses are passive: they offset passive income freely, and up to $25,000/yr can offset ordinary (W-2) income if you actively participate and your MAGI is under $100k (phasing out to $0 by $150k); unused losses carry forward. On sale, claimed depreciation is recaptured at up to 25%, and gains may owe capital-gains tax (a 1031 exchange can defer both). Figures are a year-1 estimate at your 24.0% rate — not tax advice; consult a CPA.
Schools (NCES district)
- District
- Pocono Mountain SD
- NCES district ID
- 4219500
- Math proficiency
- 37% ▼ -5.00%
- Reading proficiency
- 55% ▲ 1.00%
- Median HH income
- $55,317
- Composite
- 39.91/100
- National rank
- #3856
- State rank
- #245 of 539 in PA
Livability — Tunkhannock
- Score
- 77/100
- State rank
- #371
- US rank
- #3219
Category grades
Schools grade is shown separately in the Schools card above.
Census & demographics
- Census place
- Emerald Lakes, PA
- Population (ZIP)
- 4,907
Population outlook (Monroe County) Hauer SSP2
- Today (2025)
- 164,099 people
- By 2030
- 161,412 · -1.6%
- By 2040
- 154,616 · -5.8%
- By 2050
- 146,710 · -10.6%
- By 2075
- 140,830 · -14.2%
- By 2100
- 138,472 · -15.6%
Race, ethnicity, and origin ACS 2023
- Neighborhood character
- Majority White (64%)
- Race & ethnicity
- White 64% Hispanic / Latino 20% Two or more races 12% Black 9%
- Hispanic origin (detail)
- Puerto Rican 17%
- Common ancestry
- Romanian 6% Lithuanian 4% Iranian 4%
- Foreign-born
- 8% · Canada
- Languages at home
- 87% English-only · Spanish 10% Russian/Polish/Slavic 3%
Political lean MEDSL · Monroe
- 2024 margin
- Toss-up / Even · D 49.1% · R 49.9%
- 2008→2024 swing
- -17.1pp toward R · 2008: 16.3pp · 2024: -0.8pp
- All cycles
- 2024: R+0.8 2020: D+6.4 2016: D+0.3 2012: D+14.0 2008: D+16.3
Not yet ingested
- Civics
- —
Market trends
- HPI YoY
- ▼ -0.95%
- Current HPI
- 178.5307
- Rent YoY
- —
- Metro
- —
- State GDP YoY
- ▲ 1.68%
- F500 in state
- 34
Industry mix (Fortune 500 HQ in PA)
| Industry | F500 HQs | Revenue |
|---|---|---|
| Healthcare | 2 | $309B |
|
||
| Insurance | 2 | $27B |
|
||
| Telecommunications / Media | 1 | $124B |
|
||
| Industrial Distribution | 1 | $22B |
|
||
| Financial Services | 1 | $20B |
|
||
| Chemicals / Materials | 1 | $18B |
|
||
Price history
+306.4% since first listed4 events — show timeline
- 2026-05-05 Price Changed $345,000 PMAR
- 2026-02-20 Price Changed $365,000 PMAR
- 2026-01-23 Listed $375,000 PMAR
- 1995-04-05 Sold (Public Records) $84,900 Public Records
Property tax history
-3.3%/yrLatest (2026): $5,075 · +3.4% YoY. Source: county tax records.
Cash-flow waterfall
monthlySold comps — $/sqft
last 12 mo · ≤1 miLoading sold comps…