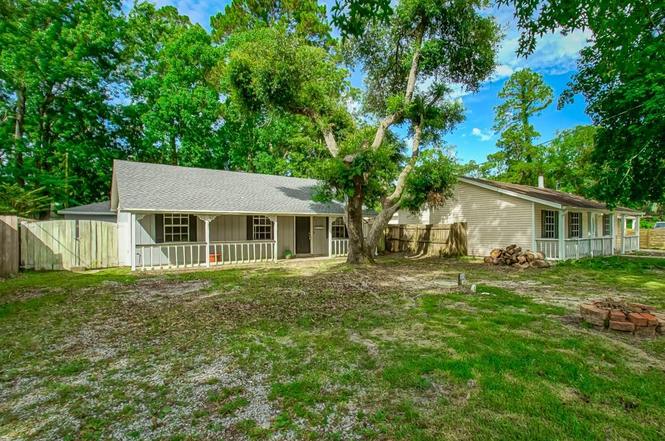
2219 Crane St · Slidell, LA
Flood risk 5/10 · Moderate
- FEMA flood zone
- X
- Chance of flooding over 30 yrs
- 0.23%
- Est. flood insurance / yr
- $507 – $1,088
Fire risk 5/10 · Moderate
- Est. fire insurance / yr
- $1,269 – $2,357
Heat risk 10/10 · Severe
- Hot days now (above 108°F)
- 7 days/yr
- Hot days in 30 yrs
- 22 days/yr
Wind risk 9/10 · Severe
- Chance of severe wind over 30 yrs
- 99.0%
Air-quality risk 2/10 · Minimal
- Unhealthy air days now
- 1 days/yr
- Unhealthy air days in 30 yrs
- 2 days/yr
Risk factors via First Street. Map © Google.
Why this score? — see what drove the C+ grade
The composite is a weighted blend of 9 inputs, each scored 0–100. Each bar is that input's sub-score; the figure is the points it added to the 100-point composite (weight × sub-score).
- Cash flow +21.0/30.0
- ARV discount +15.0/15.0
- DSCR +6.7/10.0
- 1% rule +5.2/10.0
- Schools +4.3/10.0
- Rent growth +4.0/5.0
- Livability +3.5/5.0
- Condition / age +2.5/5.0
- Appreciation +0.0/10.0
$175,000
🖨 Deal sheet 📄 Offer letter ✓ Due diligence
Listing remarks MLS
Excellent opportunity to add your personal finishing touches to this charming home. Major updates have already been completed, including a new roof (2025), upgraded electrical panel (2026), and plumbing improvements (2026). The septic system was serviced in 2024, and the property includes a transferable 3-year Orkin termite contract for added peace of mind. Additional features include a covered enclosed sun room/ rear patio and detached garage, providing ample space for hobbies, storage, or workshop use. With many of the big-ticket items already addressed, this property offers tremendous potential for an owner-occupant or investor looking to create value.
Key facts
- New roof
- 7,095 sq ft lot
- Garage
Tags
Property features AI
Exterior
- Parking: Detached garage with one space
- Utilities: Public water; Septic tank
- Home design: Single-story home; Frame construction
- Construction: Shingle roof; Slab foundation; Roof replaced 2025; electrical and plumbing upgrades 2026; septic updated 2024
- Exterior features: Covered concrete patio; Shed(s); City lot; Rectangular lot; Lot dimensions approximately 53 x 133
Interior
- Kitchen: Oven; Range
- Bathrooms: 2 full bathrooms
- Heating & cooling: Central heating; Central air conditioning
- Interior features: Total of 5 rooms; Average condition
Neighborhood map
What this means for you Summary
Snapshot
- This is a 3-bed/2.0-bath single-family listed at $175k.
Deal economics
- At list price, monthly cash flow is $246 ($3k/yr) — positive.
- The deal already cash-flows at list — no discount required.
- Meets the 1% rule at list price ($2k rent vs $175k).
- Cap rate 8.0% vs local median 5.9% in Slidell — top-decile yield for the area; either an underpriced asset or a hidden risk that comps aren't pricing in. Stress-test before assuming the spread holds.
Location & tenants
- Location reads 70/100 on livability (#57 in LA) — a middle-class / working-renter tenant base. Strengths: cost of living A+, housing A+, health & safety A+; Watch: amenities F, commute F.
- St. Tammany Parish (suburban): math 43% / reading 55% proficiency, ranked #11 of 98 in LA (top 11%) — families likely to look elsewhere, expect single-tenant / working-renter base with shorter leases.
- Market conditions: Rents rising fast (+5.9%/yr); 241 active listings in the ZIP; 4 comparable units currently listed for rent nearby; rentals at typical pace (median 24d on market — plan ~3-4 weeks tenant-placement turnaround); 1,064 units permitted in St. Tammany Parish in 2024 (0 in 5+ unit buildings).
- This rent runs 34% of the median local income ($63k/yr) — at the standard rent-burdened threshold; future hikes will face affordability resistance.
Forward outlook
- Local home prices are declining (-3.0%/yr); year-one equity from $1k of loan paydown is wiped out by about $5k of value loss. Plan a longer hold.
- St. Tammany County population projected at +27% by 2050 — long-run rental-demand tailwind backs the buy-and-hold thesis.
- At projected returns (-3.0% appreciation + 5.9% rent growth), your $49k cash investment doubles in ~10 years — after that, you're playing with house money.
Negotiation context
- Only 3 days on market — expect competitive offers; lowballing is unlikely to land.
- 7 sale attempts since 28y ago with the ask held roughly flat each time — persistent listings suggest the price (not the market) is what's stuck; bring a comps-based counter.
- Current owner paid $70k; list at $175k implies a 150% gain — meaningful room to come down on a strong offer.
Risks & watch-outs
- Climate carrying-cost: moderate flood risk; severe wind risk, 99% chance of damaging wind over 30y; moderate wildfire risk; extreme-heat days projected 7→22/yr by 2055 (HVAC capex compounding) — expect insurance premiums to compound above CPI over the hold.
Questions for the listing agent
- Built in 1975 — when were the roof, HVAC, electrical panel, plumbing, and water heater last replaced?
- Is there a deadline driving the sale (1031 exchange, divorce, estate, relocation)? That informs how much negotiation room exists.
- Schools are B-rated — typically a magnet for longer-tenancy family renters. What's the average tenant stay here, and is there a school-zone premium baked into asking?
- What's the average days-on-market for RENTAL listings here right now (not sales)? A rising rental-DOM trend means longer vacancies and softer asking-rent achievability than the comps imply.
- What's the recent tenant-quality profile in this submarket — average credit score on applications, eviction rate, late-payment / NSF rate, and stable-employment percentage? A property-management company in the area should have these aggregated.
- How much new for-sale + rental construction is in the pipeline within 1–3 miles? Heavy new supply typically softens prices + rents 12–24 months out; constrained supply supports both.
Investment metrics
- 1% rule
- 1.02% ✓
- Cap rate
- 7.98%
- Cash-on-cash
- 6.03%
- DSCR
- 1.27
- GRM
- 8.2
CMA / ARV
- ARV (on-the-fly)
- $227,376
- Comps found
- 12
Show comp detail 12 sales within ~0.75 mi
| Address | Dist | Beds/Ba | Sqft | Sold | Price | $/sf | Match |
|---|---|---|---|---|---|---|---|
| 173 Lark St | 0.19mi | 3/2.0 | 1,363 (-14%) | 3mo | $186,500 | $137 | 66 |
| 2521 Robin St | 0.43mi | 3/2.0 | 1,468 (-7%) | 3mo | $130,000 | $89 | 66 |
| 185 Lark St | 0.18mi | 4/2.0 (+1) | 1,453 (-8%) | 12mo | $195,000 | $134 | 64 |
| 2515 Pelican St | 0.38mi | 3/2.0 | 1,405 (-11%) | 3mo | $235,000 | $167 | 62 |
| 2216 Pelican St | 0.09mi | 3/2.0 | 1,350 (-14%) | 13mo | $223,000 | $165 | 61 |
| 2207 Oriole St | 0.31mi | 3/2.0 | 1,370 (-13%) | 5mo | $197,000 | $144 | 59 |
| 2517 Pelican St | 0.38mi | 3/2.0 | 1,367 (-13%) | 1mo | $240,000 | $176 | 59 |
| 2402 Mallard St | 0.38mi | 3/2.0 | 1,361 (-14%) | 3mo | $125,000 | $92 | 57 |
| 2004 Pelican St | 0.36mi | 3/2.0 | 1,740 (+10%) | 14mo | $110,000 | $63 | 55 |
| 2523 Robin St | 0.43mi | 3/2.0 | 1,385 (-12%) | 7mo | $198,500 | $143 | 53 |
| 204 Sarah Ln | 0.61mi | 3/2.0 | 1,510 (-4%) | 14mo | $240,000 | $159 | 53 |
| 2111 Mallard St | 0.40mi | 3/2.5 | 1,365 (-14%) | 16mo | $205,000 | $150 | 43 |
Match score weights: distance 35% · size 25% · config 20% · recency 20%. Top-matched comps best support the ARV.
Projected returns pro-forma
-3.0% appreciation · 5.91% rent growth · sell at horizon
- IRR
- -3.9%
- Equity multiple
- 0.85×
- Total profit
- $-7,323
- Equity at exit
- $26,093
- IRR
- 8.8%
- Equity multiple
- 1.76×
- Total profit
- $37,165
- Equity at exit
- $15,131
Cash invested: $49,000 (down + closing). Projections, not guarantees.
Landlord ↔ Tenant lean methodology
- Overall (STATE)
- 90 Strongly Landlord-Friendly
- State Louisiana
- 90 Strongly Landlord-Friendly · R+12
- County
- — inherits STATE
- City
- — inherits STATE
ZIP-level market 70460
- Rents YoY
- 5.9%
- Active inventory
- 241
- Price-to-rent
- 8.2×
Monthly cashflow live
- Estimated rent
- $1,781 medium interval (Pro) →
- Mortgage (P&I)
- −$918
- Tax from tax record
- −$170 /mo · $2,042/yr
- Insurance
- −$73
- HOA
- −$0
- Vacancy / Maint / Mgmt
- −$374
- Net cashflow
- $246
Break-even live
UW: 25.0% down · 7.5% · 30yr · 1.5% tax · 5.0% vac · 8.0% maint · 8.0% mgmt
Financing live
Cash to close
- Down payment
- $43,750
- Closing costs
- $5,250
- Reserves months
- —
- Total cash needed
- —
Loan-product check · same deal, 3 products live
Conventional
25% down · 7.5% · 30yr
- Down + closing
- —
- Monthly P&I
- —
- Monthly cashflow
- —
- DSCR
- —
- Eligible?
- —
Personal DTI + credit; lowest rate.
DSCR
20% down · 8.5% · 30yr
- Down + closing
- —
- Monthly P&I
- —
- Monthly cashflow
- —
- DSCR
- —
- Eligible?
- —
No personal income docs; deal must DSCR.
Hard money
10% down · 12.0% · 12mo
- Down + closing
- —
- Monthly P&I
- —
- Monthly cashflow
- —
- DSCR
- —
- Eligible?
- —
Short-term bridge; refi at stabilization.
Rent comps 4 comps
| Address | Beds | Baths | Sqft | Rent | $/sqft | DOM | Units | Dist |
|---|---|---|---|---|---|---|---|---|
| 2402 Pelican St Slidell, LA | 3.0 | 2.0 | 1400 | $1,700 | $1.21 | 23d | 1 | 0.16mi |
| 2322 Mallard St Slidell, LA | 3.0 | 2.0 | 1400 | $1,600 | $1.14 | 43d | 1 | 0.33mi |
| 2519 Crane St Slidell, LA | 3.0 | 2.0 | 1160 | $1,600 | $1.38 | 23d | 1 | 0.36mi |
| 34081 Stanley St Slidell, LA | 3.0 | 2.5 | 1832 | $1,950 | $1.06 | 1d | 1 | 1.36mi |
Listing history 5 events
-
2026-06-18days on market $175,000 Active 3 DOM
-
2026-06-17remarks 675-char remark
-
2026-06-17days on market $175,000 Active 2 DOM
-
2026-06-15remarks 664-char remark
Show marketing remark (663 chars)
Excellent opportunity to add your personal finishing touches to this charming home. Major updates have already been completed, including a new roof (2025), upgraded electrical panel (2026), and plumbing improvements (2026). The septic system was serviced in 2024, and the property includes a transferable 3-year Orkin termite contract for added peace of mind. Additional features include a covered enclosed sun room/ rear patio and detached garage, providing ample space for hobbies, storage, or workshop use. With many of the big-ticket items already addressed, this property offers tremendous potential for an owner-occupant or investor looking to create value.
-
2026-06-15$175,000 Active 1 DOM
Show marketing remark (663 chars)
Excellent opportunity to add your personal finishing touches to this charming home. Major updates have already been completed, including a new roof (2025), upgraded electrical panel (2026), and plumbing improvements (2026). The septic system was serviced in 2024, and the property includes a transferable 3-year Orkin termite contract for added peace of mind. Additional features include a covered enclosed sun room/ rear patio and detached garage, providing ample space for hobbies, storage, or workshop use. With many of the big-ticket items already addressed, this property offers tremendous potential for an owner-occupant or investor looking to create value.
ⓘ Source: listings_history table (triggers on properties + properties_extension) + one-shot
backfill from property_details.listing_events for pre-trigger history.
Tax reassessment forecast LA · Resets to sale price
- Current annual tax
- $2,042 · $170/mo
- Projected year-2 tax
- $2,042 · $170/mo
- Expected delta
- $0/yr ($0/mo · 0.0%)
ⓘ Screening estimate from a state-policy table — verify with the county assessor before closing.
Climate risk First Street
- Flood 5/10 Major FEMA zone X · 23% chance over 30 yrs
- Wildfire 5/10 Major
- Heat 10/10 Extreme 7 d/yr ≥108°F today · 22 d/yr by 30 yrs out
- Wind 9/10 Extreme 99% chance of damaging wind over 30 yrs
- Air quality 2/10 Low 1 unhealthy d/yr today · 2 by 30 yrs out
Nearby sold comps map
Loading sold comps map…
Walkable amenities ~0.75 mi
Loading nearby amenities…
Taxation est. · year 1
- Rental income
- $21,370
- − Mortgage interest
- −$9,803
- − Property taxes
- −$2,042
- − Insurance
- −$875
- − Repairs & maintenance
- −$1,710
- − Management
- −$1,710
- − Depreciation
- −$5,091
- Taxable income
- $140
- Est. tax owed @ 24.0%
- −$34
- After-tax cash flow
- $2,919/yr
For passive investors: Depreciation is non-cash, so a rental often shows a tax loss while cash-flowing — sheltering income. Rental losses are passive: they offset passive income freely, and up to $25,000/yr can offset ordinary (W-2) income if you actively participate and your MAGI is under $100k (phasing out to $0 by $150k); unused losses carry forward. On sale, claimed depreciation is recaptured at up to 25%, and gains may owe capital-gains tax (a 1031 exchange can defer both). Figures are a year-1 estimate at your 24.0% rate — not tax advice; consult a CPA.
Schools (NCES district)
- District
- St. Tammany Parish
- NCES district ID
- 2201650
- Math proficiency
- 43% ▼ -32.00%
- Reading proficiency
- 55% ▼ -26.00%
- Median HH income
- $61,752
- Composite
- 43.04/100
- National rank
- #3098
- State rank
- #11 of 98 in LA
Livability — Slidell
- Score
- 70/100
- State rank
- #57
- US rank
- #7673
Category grades
Schools grade is shown separately in the Schools card above.
Census & demographics
- County
- Saint Tammany Parish · 228,296 people
- City population
- 95,511
- Metro
- New Orleans-Metairie, LA
- Population (ZIP)
- 21,669
- Household income
- $62,565
- Rent vs Own
- Severe rent burden
- 318.0
Population outlook (St. Tammany County) Hauer SSP2
- Today (2025)
- 286,725 people
- By 2030
- 304,175 · +6.1%
- By 2040
- 336,203 · +17.3%
- By 2050
- 364,590 · +27.2%
- By 2075
- 433,362 · +51.1%
- By 2100
- 470,333 · +64.0%
Race, ethnicity, and origin ACS 2023
- Neighborhood character
- Diverse neighborhood (Simpson 0.62)
- Race & ethnicity
- White 53% Black 29% Two or more races 11% Hispanic / Latino 10% Pacific Islander 2%
- Hispanic origin (detail)
- Mexican 3%
- Common ancestry
- Lithuanian 13% Slovak 1% Italian 1%
- Foreign-born
- 5% · Canada
- Languages at home
- 92% English-only · Spanish 6%
Political lean MEDSL · St. Tammany
- 2024 margin
- Solid R (+43.8) · D 27.3% · R 71.1% · Other 1.6%
- 2008→2024 swing
- +9.6pp toward D · 2008: -53.4pp · 2024: -43.8pp
- All cycles
- 2024: R+43.8 2020: R+44.2 2016: R+50.8 2012: R+52.2 2008: R+53.4
Not yet ingested
- Civics
- —
Market trends
- HPI YoY
- ▼ -93.87%
- Current HPI
- 130.56
- Rent YoY
- ▲ 5.91%
- Metro
- New Orleans-Metairie, LA
- State GDP YoY
- ▲ 3.29%
- F500 in state
- 10
Industry mix (Fortune 500 HQ in LA)
| Industry | F500 HQs | Revenue |
|---|---|---|
| Telecommunications | 2 | $23B |
|
||
| Utilities | 1 | $12B |
|
||
| Wholesale / Distribution | 1 | $5B |
|
||
| Advertising | 1 | $2B |
|
||
Price history
+119.6% since first listed9 events — show timeline
- 2026-06-15 Listed $175,000 AcadianaMLS
- 2026-06-15 Listed $175,000 GSREIN
- 2011-05-24 Listed $150,000 GSREIN
- 2008-08-04 Listed $147,000 GSREIN
- 2008-08-01 Listed $147,000 GSREIN
- 2007-07-02 Listed $146,900 GSREIN
- 2005-05-26 Sold (Public Records) $70,000 Public Records
- 1998-09-30 Sold (MLS) $82,500 GSREIN
- 1998-01-21 Listed $79,700 GSREIN
Property tax history
+1.0%/yrLatest (2025): $2,042 · -3.9% YoY. Source: county tax records.
Cash-flow waterfall
monthlySold comps — $/sqft
last 12 mo · ≤1 miLoading sold comps…