 Multi-family
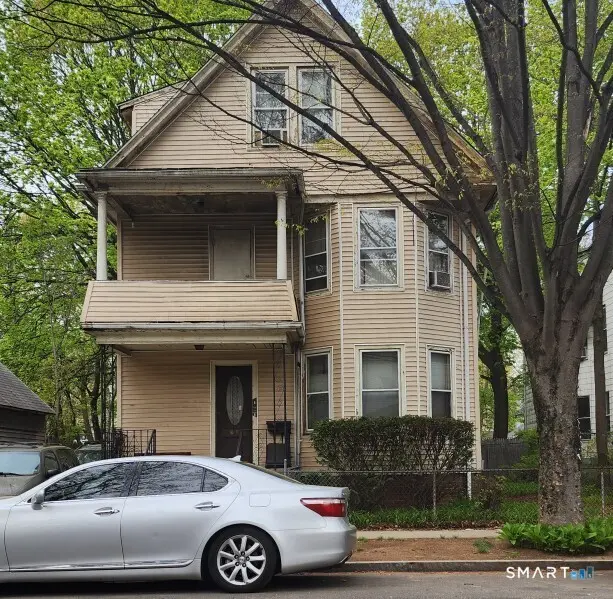
69 Bassett St · New Haven, CT
Flood risk 1/10 · Minimal
- FEMA flood zone
- X (unshaded)
- Chance of flooding over 30 yrs
- 0.0%
- Est. flood insurance / yr
- $473 – $860
Fire risk 1/10 · Minimal
- Est. fire insurance / yr
- $829 – $1,539
Heat risk 6/10 · Moderate
- Hot days now (above 99°F)
- 7 days/yr
- Hot days in 30 yrs
- 16 days/yr
Wind risk 6/10 · Moderate
- Chance of severe wind over 30 yrs
- 53.0%
Air-quality risk 5/10 · Moderate
- Unhealthy air days now
- 6 days/yr
- Unhealthy air days in 30 yrs
- 8 days/yr
Risk factors via First Street. Map © Google.
Why this score? — see what drove the B- grade
The composite is a weighted blend of 9 inputs, each scored 0–100. Each bar is that input's sub-score; the figure is the points it added to the 100-point composite (weight × sub-score).
- Cash flow +26.5/30.0
- ARV discount +14.5/15.0
- DSCR +9.0/10.0
- 1% rule +7.4/10.0
- Livability +4.0/5.0
- Rent growth +3.2/5.0
- Condition / age +2.5/5.0
- Schools +1.5/10.0
- Appreciation +0.0/10.0
$335,000
🖨 Deal sheet (PDF) 📄 Offer letter ✓ Due diligence
Multi-family units
County records classify this as Multi-Family (2-4 Unit). Listing-text estimate: 1 unit. estimate disagrees with records
Listing remarks
Discover an exceptional investment opportunity in the heart of Newhallville! This charming handyman-special multifamily property is an investor's dream, perfectly suited for contractors, seasoned renovators, and buyers seeking a rewarding rehab project. Each unit features a functional layout with two comfortable bedrooms, one full bathroom, a formal dining room, a cozy living room, and kitchen. In addition, the expansive attic presents exciting possibilities for future expansion-potentially adding extra bedrooms or flexible living space to further increase the property's value. Furnace and Hot water heaters were replaced approximately 8 years ago. Home is being sold AS-IS, Conveniently loca
Key facts
- 6,969 sq ft lot
- Built 1900
- Listed 41 days
Property features AI
Exterior
- Utilities: Public water; Public sewer; Natural gas hot water (40 gallon tank)
- Home design: Multi-family 2-family property
- Construction: Frame construction; Concrete foundation; Asphalt shingle gable roof; Vinyl siding; Built for two units
- Exterior features: Balcony; Covered deck; Front porch; Sidewalk; Gutters; Level lot
Interior
- Bedrooms: 4 bedrooms
- Bathrooms: 2 full bathrooms
- Heating & cooling: Hot air heat; Natural gas heating
- Interior features: 10 total rooms; Full basement with interior access, concrete floor and full hatchway; Walk-up attic
Neighborhood map
What this means for you Summary
Snapshot
- This is a 4-bed/2.0-bath multifamily listed at $335k.
Deal economics
- At list price, monthly cash flow is $886 ($11k/yr) — positive.
- The deal already cash-flows at list — no discount required.
- Meets the 1% rule at list price ($4k rent vs $335k).
- Recommended offer: $325k (3.0% below list) — sets the bar for market timing.
- Cap rate 9.5% vs local median 4.8% in New Haven — top-decile yield for the area; either an underpriced asset or a hidden risk that comps aren't pricing in. Stress-test before assuming the spread holds.
Location & tenants
- Location reads 79/100 on livability (#31 in CT, #2,190 nationally) — a middle-class / working-renter tenant base. Strengths: amenities A+, commute A+, health & safety A+; Watch: schools D+, employment D, crime F.
- New Haven School District (urban): math 12% / reading 25% proficiency, ranked #147 of 153 in CT (top 96%) — low school quality limits family demand, transient renter base, plan for 1-2y turnover; 66% free/reduced lunch — lower-income household profile, screen leases tightly.
- Market conditions: Rents rising (+2.6%/yr); 137 active listings in the ZIP; 40 comparable units currently listed for rent nearby; rentals at typical pace (median 24d on market — plan ~3-4 weeks tenant-placement turnaround); 45% of comp listings sitting > 30 days — soft ceiling on asking rent; 1,059 units permitted in South Central Connecticut Planning Region in 2024 (779 in 5+ unit buildings).
- At $4,166/mo this rent would consume 83% of the median local household income ($60k/yr) (locally 4999% of renters already pay >50% of income on rent) — very limited rent-growth headroom before tenants either downsize or default.
Forward outlook
- Local home prices are declining (-3.0%/yr); year-one equity from $2k of loan paydown is wiped out by about $10k of value loss. Plan a longer hold.
Negotiation context
- It's been on market 41 days — a 3% lower offer ($325k) is reasonable based on typical stale-listing flexibility.
Risks & watch-outs
- Watch-outs: built in 1900 — expect roof / HVAC / electrical / plumbing capex.
- Climate carrying-cost: major wind risk, 53% chance of damaging wind over 30y; extreme-heat days projected 7→16/yr by 2055 (HVAC capex compounding) — expect insurance premiums to compound above CPI over the hold.
Questions for the listing agent
- It's been on market 41 days. Have you received any prior offers? Is the seller open to a 3% concession, seller financing, or rate buy-down credit?
- Built in 1900 — when were the roof, HVAC, electrical panel, plumbing, and water heater last replaced?
- Is there a deadline driving the sale (1031 exchange, divorce, estate, relocation)? That informs how much negotiation room exists.
- Schools are D-rated, which usually means shorter tenancies and higher turnover. Who's the typical renter profile here, and what's been the actual vacancy rate?
- Crime grade is F in this area — have there been break-ins, vandalism, or insurance claims at this property in the last 3 years? What carrier currently insures it and at what premium?
- What's the average days-on-market for RENTAL listings here right now (not sales)? A rising rental-DOM trend means longer vacancies and softer asking-rent achievability than the comps imply.
- What's the recent tenant-quality profile in this submarket — average credit score on applications, eviction rate, late-payment / NSF rate, and stable-employment percentage? A property-management company in the area should have these aggregated.
- How much new apartment / multifamily construction is in the pipeline within 1–3 miles? Heavy new supply (>2% of stock underway) typically softens rents 12–24 months out; light construction supports rent growth.
Investment metrics
- 1% rule
- 1.24% ✓
- Cap rate
- 9.47%
- Cash-on-cash
- 11.33%
- DSCR
- 1.50
- GRM
- 6.7
CMA / ARV
- ARV (median comp)
- $397,026
- List price
- $335,000
- Delta
- -15.62%
- Verdict
- UNDERPRICED
- Comps
- 20 within 1.0 mi
Show comp detail 9 sales within ~0.75 mi
| Address | Dist | Beds/Ba | Sqft | Sold | Price | $/sf | Match |
|---|---|---|---|---|---|---|---|
| 26-28 Lander St | 0.22mi | 4/2.0 | 2,208 (-6%) | 2mo | $390,000 | $177 | 78 |
| 25 Lander St | 0.25mi | 4/2.0 | 2,365 (+1%) | 21mo | $350,000 | $148 | 69 |
| 123 Hazel St | 0.22mi | 5/2.0 (+1) | 2,102 (-10%) | 7mo | $335,000 | $159 | 62 |
| 161 Starr St | 0.25mi | 5/2.0 (+1) | 2,113 (-10%) | 8mo | $290,000 | $137 | 60 |
| 165 Starr St | 0.25mi | 4/2.0 | 2,099 (-10%) | 16mo | $265,000 | $126 | 58 |
| 125 Shelton Ave | 0.44mi | 4/2.0 | 2,184 (-6%) | 15mo | $255,000 | $117 | 56 |
| 242 W Ivy St | 0.38mi | 5/2.0 (+1) | 2,608 (+12%) | 14mo | $325,000 | $125 | 46 |
| 323 W Division St | 0.48mi | 5/3.0 (+1) | 2,268 (-3%) | 23mo | $285,000 | $126 | 44 |
| 54 Alstrum St | 0.58mi | 4/2.0 | 2,100 (-10%) | 22mo | $400,000 | $190 | 38 |
Match score weights: distance 35% · size 25% · config 20% · recency 20%. Top-matched comps best support the ARV.
Projected returns pro-forma
-3.0% appreciation · 2.6% rent growth · sell at horizon
- IRR
- 0.2%
- Equity multiple
- 1.01×
- Total profit
- $590
- Equity at exit
- $49,950
- IRR
- 9.4%
- Equity multiple
- 1.71×
- Total profit
- $66,854
- Equity at exit
- $28,965
Cash invested: $93,800 (down + closing). Projections, not guarantees.
Landlord ↔ Tenant lean methodology
- Overall (STATE)
- 27 Tenant-Leaning
- State Connecticut
- 27 Tenant-Leaning · D+7
- County
- — inherits STATE
- City
- — inherits STATE
ZIP-level market 06511
- Home prices YoY
- -20.8%
- Rents YoY
- 2.6%
- Active inventory
- 137
- Price-to-rent
- 13.4×
Monthly cashflow live
- Estimated rent
- $4,166 high interval (Pro) →
- Mortgage (P&I)
- −$1,757
- Tax from tax record
- −$509 /mo · $6,106/yr
- Insurance
- −$140
- HOA
- −$0
- Vacancy / Maint / Mgmt
- −$875
- Net cashflow
- $886
Break-even live
Sensitivity live
| Price | -10% $1,076 | -5% $981 | +0% $886 | +5% $791 | +10% $696 |
|---|---|---|---|---|---|
| Rent | -10% $557 | -5% $721 | +0% $886 | +5% $1,051 | +10% $1,215 |
| Rate | -1.0pp $1,055 | -0.5pp $971 | base $886 | +0.5pp $799 | +1.0pp $711 |
2-unit breakdown (identical units grouped — click to expand)
| Units | Beds | Baths | Est. rent |
|---|---|---|---|
| 2× units | 2 | 1 | $4,166 |
| #1 | 2 | 1 | $2,083 |
| #2 | 2 | 1 | $2,083 |
| Total (2 units) | $4,166 | ||
UW: 25.0% down · 7.5% · 30yr · 1.5% tax · 5.0% vac · 8.0% maint · 8.0% mgmt
Financing live
Cash to close
- Down payment
- $83,750
- Closing costs
- $10,050
- Reserves months
- —
- Total cash needed
- —
Loan-product check · same deal, 3 products live
Conventional
25% down · 7.5% · 30yr
- Down + closing
- —
- Monthly P&I
- —
- Monthly cashflow
- —
- DSCR
- —
- Eligible?
- —
Personal DTI + credit; lowest rate.
DSCR
20% down · 8.5% · 30yr
- Down + closing
- —
- Monthly P&I
- —
- Monthly cashflow
- —
- DSCR
- —
- Eligible?
- —
No personal income docs; deal must DSCR.
Hard money
10% down · 12.0% · 12mo
- Down + closing
- —
- Monthly P&I
- —
- Monthly cashflow
- —
- DSCR
- —
- Eligible?
- —
Short-term bridge; refi at stabilization.
Rent comps 40 comps
| Address | Beds | Baths | Sqft | Rent | $/sqft | DOM | Units | Dist |
|---|---|---|---|---|---|---|---|---|
| 29 Lilac St New Haven, CT | 4.0 | 1.5 | 1600 | $2,650 | $1.66 | 44d | 1 | 0.11mi |
| 106 Butler St New Haven, CT | 4.0 | 2.0 | 3045 | $2,600 | $0.85 | 15d | 1 | 0.14mi |
| 327 Newhall St New Haven, CT | 3.0 | 1.0 | 2742 | $1,950 | $0.71 | 44d | 1 | 0.15mi |
| 165 Starr St Unit 2nd Floor New Haven, CT | 4.0 | 1.0 | 2099 | $2,200 | $1.05 | 19d | 1 | 0.23mi |
| 165 Starr St Unit 2nd Floor New Haven, CT | 4.0 | 2.0 | 2099 | $2,150 | $1.02 | 15d | 1 | 0.23mi |
| 233 Highland St New Haven, CT | 4.0 | 3.5 | 2200 | $3,950 | $1.80 | 44d | 1 | 0.31mi |
| 322 Bassett St Unit 2 New Haven, CT | 3.0 | 1.0 | 2936 | $1,900 | $0.65 | 44d | 1 | 0.51mi |
| 32 Alstrum St #2 Hamden, CT | 3.0 | 1.0 | 1656 | $2,000 | $1.21 | 3d | 1 | 0.55mi |
| 327 Augur St Unit 3 Hamden, CT | 3.0 | 1.0 | 3036 | $1,800 | $0.59 | 3d | 1 | 0.75mi |
| 55 Admiral St Unit 2 New Haven, CT | 5.0 | 3.0 | 2000 | $3,295 | $1.65 | 24d | 1 | 0.76mi |
| 50 Admiral St New Haven, CT | 5.0 | 2.0 | 2157 | $2,700 | $1.25 | 19d | 1 | 0.79mi |
| 420 Whitney Ave New Haven, CT | 3.0–4.0 | 2.0–3.0 | 1800 | $4,700 | $2.61 | 11d | 2 | 0.82mi |
| 420 Whitney Ave Unit 424-3B New Haven, CT | 4.0 | 3.0 | 1800 | $4,700 | $2.61 | 3d | 1 | 0.82mi |
| 28 Townsend St New Haven, CT | 4.0 | 2.5 | 1580 | $3,400 | $2.15 | 44d | 1 | 0.84mi |
| 134 Mansfield St New Haven, CT | 5.0 | 2.0 | 1960 | $5,500 | $2.81 | 24d | 1 | 0.85mi |
| 339 Willow St Unit 1 New Haven, CT | 4.0 | 2.0 | 2163 | $4,050 | $1.87 | 11d | 1 | 0.88mi |
| 1097 Dixwell Ave Hamden, CT | 4.0 | 1.0 | 2005 | $1,750 | $0.87 | 11d | 1 | 0.89mi |
| 266 Everit St New Haven, CT | 4.0 | 3.5 | 3259 | $4,500 | $1.38 | 44d | 1 | 0.89mi |
| 432 Norton Pkwy New Haven, CT | 5.0 | 3.0 | 2493 | $4,195 | $1.68 | 44d | 1 | 0.93mi |
| 75 Stimson Rd New Haven, CT | 4.0 | 1.0 | 1890 | $3,500 | $1.85 | 15d | 1 | 0.96mi |
| 1768 Ella T Grasso Blvd New Haven, CT | 4.0 | 2.0 | 2193 | $3,950 | $1.80 | 44d | 1 | 0.96mi |
| 119 Carmel St Unit 3 New Haven, CT | 3.0 | 1.0 | 3282 | $1,900 | $0.58 | 44d | 1 | 0.98mi |
| 56 Mansfield St Unit 1 New Haven, CT | 3.0 | 1.0 | 2759 | $2,800 | $1.01 | 44d | 1 | 1.00mi |
| 355 Norton St Unit 1 New Haven, CT | 5.0 | 2.5 | 2500 | $3,300 | $1.32 | 22d | 1 | 1.06mi |
| 591 Orchard St Unit 1 New Haven, CT | 4.0 | 2.0 | 1696 | $2,900 | $1.71 | 3d | 1 | 1.07mi |
| 190 Pine Rock Ave Hamden, CT | 1.0–4.0 | 1.0–3.0 | 1850 | $3,895 | $2.11 | 44d | 1 | 1.08mi |
| 156 Putnam Ave Hamden, CT | 3.0 | 1.0 | 2304 | $1,800 | $0.78 | 3d | 1 | 1.10mi |
| 347 Sherman Ave New Haven, CT | 5.0 | 3.0 | 3153 | $2,300 | $0.73 | 44d | 1 | 1.10mi |
| 1634 Ella T Grasso Blvd New Haven, CT | 4.0 | 1.5 | 2018 | $3,600 | $1.78 | 44d | 1 | 1.14mi |
| 68 Anderson St Unit A New Haven, CT | 3.0 | 2.5 | 1693 | $4,500 | $2.66 | 44d | 1 | 1.16mi |
| 52 Goffe St New Haven, CT | 3.0 | 2.0 | 1935 | $2,600 | $1.34 | 24d | 1 | 1.21mi |
| 1565 Ella T Grasso Blvd Unit 1563 2 New Haven, CT | 4.0 | 1.0 | 1638 | $2,500 | $1.53 | 44d | 1 | 1.21mi |
| 1563 Ella T Grasso Blvd Unit 2 New Haven, CT | 4.0 | 1.0 | 1638 | $2,500 | $1.53 | 24d | 1 | 1.22mi |
| 1551 Ella T Grasso Blvd Unit 1 New Haven, CT | 4.0 | 1.0 | 1700 | $2,295 | $1.35 | 15d | 1 | 1.23mi |
| 151 Fitch St #161 New Haven, CT | 3.0 | 2.0 | 2200 | $2,481 | $1.13 | 44d | 1 | 1.25mi |
| 1519 Ella T Grasso Blvd Unit N/A New Haven, CT | 5.0 | 2.0 | 2750 | $4,450 | $1.62 | 24d | 1 | 1.26mi |
| 239 Bradley St Unit 1 New Haven, CT | 3.0 | 1.0 | 1982 | $3,650 | $1.84 | 44d | 1 | 1.27mi |
| 315 Humphrey St Unit A New Haven, CT | 4.0 | 3.5 | 2465 | $4,500 | $1.83 | 3d | 1 | 1.32mi |
| 54 Trumbull St Unit 54-1 New Haven, CT | 5.0 | 2.5 | 2250 | $6,695 | $2.98 | 15d | 1 | 1.35mi |
| 300 Humphrey St Unit 2 New Haven, CT | 3.0 | 2.0 | 2868 | $3,295 | $1.15 | 44d | 1 | 1.36mi |
Listing history 12 events
-
2026-06-13status $335,000 Under Contract 41 DOM
-
2026-06-10days on market $335,000 Under Contract - Continue to Show 41 DOM
-
2026-06-09days on market $335,000 Under Contract - Continue to Show 40 DOM
-
2026-06-08days on market $335,000 Under Contract - Continue to Show 39 DOM
-
2026-06-07days on market $335,000 Under Contract - Continue to Show 38 DOM
-
2026-06-05days on market $335,000 Under Contract - Continue to Show 35 DOM
-
2026-06-03days on market $335,000 Under Contract - Continue to Show 34 DOM
-
2026-06-03days on market $335,000 Under Contract - Continue to Show 33 DOM
-
2026-06-01days on market $335,000 Under Contract - Continue to Show 32 DOM
-
2026-05-31days on market $335,000 Under Contract - Continue to Show 31 DOM
-
2026-05-12historical Under Contract - Continue to Show 1079-char remark
-
2026-04-30$335,000 Active 1079-char remark
ⓘ Source: listings_history table (triggers on properties + properties_extension) + one-shot
backfill from property_details.listing_events for pre-trigger history.
Tax reassessment forecast CT · Partial reset (capped growth)
- Current annual tax
- $6,106 · $509/mo
- Projected year-2 tax
- $6,638 · $553/mo
- Expected delta
- +$532/yr (+$44/mo · 8.7%)
ⓘ Screening estimate from a state-policy table — verify with the county assessor before closing.
Climate risk First Street
- Flood 1/10 Low FEMA zone X (unshaded) · 0% chance over 30 yrs
- Wildfire 1/10 Low
- Heat 6/10 Major 7 d/yr ≥99°F today · 16 d/yr by 30 yrs out
- Wind 6/10 Major 53% chance of damaging wind over 30 yrs
- Air quality 5/10 Major 6 unhealthy d/yr today · 8 by 30 yrs out
Nearby sold comps map
Loading sold comps map…
Walkable amenities ~0.75 mi
Loading nearby amenities…
Taxation est. · year 1
- Rental income
- $49,992
- − Mortgage interest
- −$18,765
- − Property taxes
- −$6,106
- − Insurance
- −$1,675
- − Repairs & maintenance
- −$3,999
- − Management
- −$3,999
- − Depreciation
- −$9,745
- Taxable income
- $5,702
- Est. tax owed @ 24.0%
- −$1,368
- After-tax cash flow
- $9,263/yr
For passive investors: Depreciation is non-cash, so a rental often shows a tax loss while cash-flowing — sheltering income. Rental losses are passive: they offset passive income freely, and up to $25,000/yr can offset ordinary (W-2) income if you actively participate and your MAGI is under $100k (phasing out to $0 by $150k); unused losses carry forward. On sale, claimed depreciation is recaptured at up to 25%, and gains may owe capital-gains tax (a 1031 exchange can defer both). Figures are a year-1 estimate at your 24.0% rate — not tax advice; consult a CPA.
Schools (NCES district)
- District
- New Haven School District
- NCES district ID
- 0902790
- Math proficiency
- 12% ▼ -10.00%
- Reading proficiency
- 25% ▼ -10.00%
- Median HH income
- $38,058
- Composite
- 15.48/100
- National rank
- #9308
- State rank
- #147 of 153 in CT
Livability — New Haven
- Score
- 79/100
- State rank
- #31
- US rank
- #2190
Category grades
Schools grade is shown separately in the Schools card above.
Census & demographics
- Census place
- New Haven, CT
- County
- New Haven County · 688,236 people
- City population
- 132,813
- Metro
- New Haven-Milford, CT
- Population (ZIP)
- 54,730
- Household income
- $59,969
- Rent vs Own
- Severe rent burden
- 4999.0
Population outlook (South Central Connecticut County) Hauer SSP2
- By 2040
- 608,362
Race, ethnicity, and origin ACS 2023
- Neighborhood character
- Highly diverse neighborhood (Simpson 0.73)
- Race & ethnicity
- Black 34% White 32% Hispanic / Latino 21% Two or more races 8% Asian 7%
- Hispanic origin (detail)
- Mexican 4% Puerto Rican 10% Dominican 2%
- Common ancestry
- Romanian 2% Lithuanian 1% Russian 1%
- Foreign-born
- 17% · Canada, China, South Korea
- Languages at home
- 74% English-only · Spanish 15% Chinese 3% Other Indo-European 2%
Political lean MEDSL · South Central Connecticut
- 2024 margin
- Strong D (+20.1) · D 59.0% · R 38.9% · Other 2.1%
- All cycles
- 2024: D+20.1
Not yet ingested
- Civics
- —
Market trends
- HPI YoY
- ▼ -86.05%
- Current HPI
- 328.1353
- Rent YoY
- ▲ 2.60%
- Metro
- New Haven-Milford, CT
- State GDP YoY
- ▲ 1.06%
- F500 in state
- 38
Industry mix (Fortune 500 HQ in CT)
| Industry | F500 HQs | Revenue |
|---|---|---|
| Industrial Machinery | 4 | $38B |
|
||
| Insurance | 3 | $71B |
|
||
| Financial Services | 2 | $25B |
|
||
| Transportation / Logistics | 2 | $18B |
|
||
| Healthcare | 1 | $247B |
|
||
| Telecommunications | 1 | $55B |
|
||
Price history
3 events — show timeline
- 2026-06-10 Pending — Smart MLS
- 2026-05-12 Contingent — Smart MLS
- 2026-04-30 Listed $335,000 Smart MLS
Property tax history
+6.5%/yrLatest (2023): $6,106 · -6.4% YoY. Source: county tax records.
Cash-flow waterfall
monthlySold comps — $/sqft
last 12 mo · ≤1 miLoading sold comps…