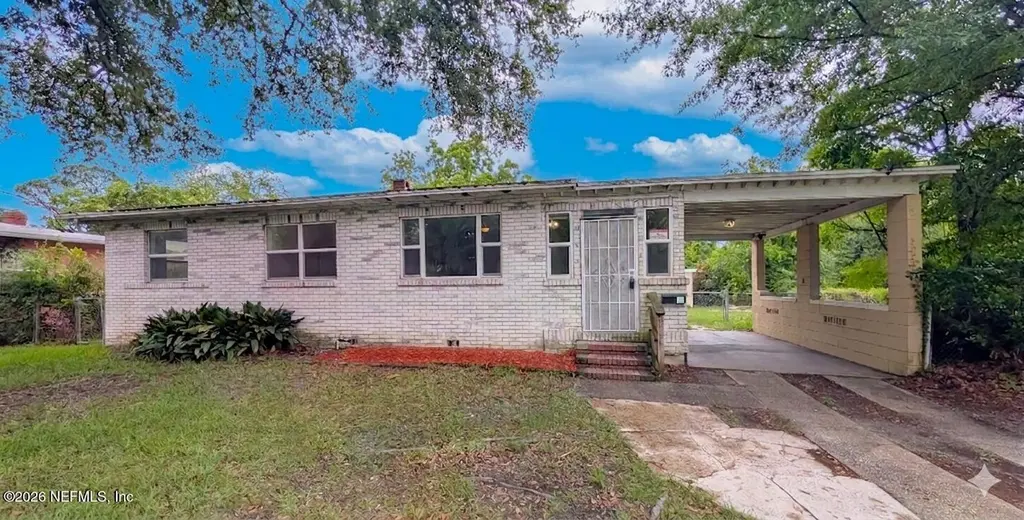
2750 Calloway Cir · Jacksonville, FL
Flood risk 4/10 · Minor
- FEMA flood zone
- X (shaded)
- Chance of flooding over 30 yrs
- 0.2%
- Est. flood insurance / yr
- $507 – $1,088
Fire risk 1/10 · Minimal
- Est. fire insurance / yr
- $947 – $1,759
Heat risk 9/10 · Severe
- Hot days now (above 107°F)
- 7 days/yr
- Hot days in 30 yrs
- 20 days/yr
Wind risk 9/10 · Severe
- Chance of severe wind over 30 yrs
- 99.0%
Air-quality risk 4/10 · Minor
- Unhealthy air days now
- 6 days/yr
- Unhealthy air days in 30 yrs
- 6 days/yr
Risk factors via First Street. Map © Google.
Why this score? — see what drove the D grade
The composite is a weighted blend of 9 inputs, each scored 0–100. Each bar is that input's sub-score; the figure is the points it added to the 100-point composite (weight × sub-score).
- Cash flow +12.1/30.0
- ARV discount +7.4/15.0
- Livability +4.2/5.0
- Schools +3.9/10.0
- 1% rule +3.8/10.0
- DSCR +3.6/10.0
- Rent growth +3.0/5.0
- Condition / age +2.5/5.0
- Appreciation +0.0/10.0
$169,000
🖨 Deal sheet 📄 Offer letter ✓ Due diligence
Listing remarks MLS
This newly renovated home is move in ready! It has 4 bedrooms and 2 bathroom with 1,350 sq feet of living space and updates throughout. Call for your showing today!
Key facts
- Charming front porch
- Hvac installed
- Roof replaced
Tags
Property features AI
Finance
- HOA & community: Not a senior community
Exterior
- Parking: Carport (1 space)
- Utilities: Cable available
- Home design: Single family residence; One story
- Construction: Shingle roof
- Exterior features: Back yard fencing; No private pool
Interior
- Kitchen: Electric range; Refrigerator
- Bedrooms: 4 bedrooms
- Flooring: Carpet
- Bathrooms: 2 full bathrooms
- Heating & cooling: Electric heating; Heat pump; Central air
- Interior features: Washer hookup; Electric dryer hookup; Carpet flooring
- Laundry & utility: Washer hookup; Electric dryer hookup
Neighborhood map
What this means for you Summary
Snapshot
- This is a 4-bed/2.0-bath single-family listed at $169k.
Deal economics
- At list price, monthly cash flow is $-38 ($-458/yr) — negative.
- To cash-flow at today's rent, offer at most $162k (4.0% below list).
- To meet the 1% rule (rent ≥ 1% of price), the offer needs to be $149k (11.7% below list).
- Recommended offer: $149k (11.7% below list) — sets the bar for 1% rule.
- Cap rate 6.0% vs local median 4.0% in Jacksonville — top-decile yield for the area; either an underpriced asset or a hidden risk that comps aren't pricing in. Stress-test before assuming the spread holds.
Location & tenants
- Location reads 83/100 on livability (#50 in FL, #911 nationally) — a professional / high-income tenant draw. Strengths: amenities A+, commute A+, housing A+.
- Duval (urban): math 46% / reading 45% proficiency, ranked #48 of 73 in FL (top 66%) — families likely to look elsewhere, expect single-tenant / working-renter base with shorter leases.
- Market conditions: Rents rising (+1.8%/yr); 394 active listings in the ZIP; 40 comparable units currently listed for rent nearby; rentals at typical pace (median 24d on market — plan ~3-4 weeks tenant-placement turnaround); lower-income renter base — watch delinquency; 6,503 units permitted in Duval County in 2024 (1,131 in 5+ unit buildings).
- At $1,493/mo this rent would consume 59% of the median local household income ($31k/yr) (locally 2921% of renters already pay >50% of income on rent) — very limited rent-growth headroom before tenants either downsize or default.
Forward outlook
- Local home prices are declining (-3.0%/yr); year-one equity from $1k of loan paydown is wiped out by about $5k of value loss. Plan a longer hold.
- Duval County population projected at +19% by 2050 — long-run rental-demand tailwind backs the buy-and-hold thesis.
Negotiation context
- It's been on market 16 days — a 2% lower offer ($166k) is reasonable based on typical stale-listing flexibility.
- 3 sale attempts since 14y ago with the ask held roughly flat each time — persistent listings suggest the price (not the market) is what's stuck; bring a comps-based counter.
- Current owner paid $140k; 21% above their basis — modest negotiation headroom, anchor on the comps not their cost.
Risks & watch-outs
- Watch-outs: built in 1957 — expect roof / HVAC / electrical / plumbing capex.
- Climate carrying-cost: severe wind risk, 99% chance of damaging wind over 30y; extreme-heat days projected 7→20/yr by 2055 (HVAC capex compounding) — expect insurance premiums to compound above CPI over the hold.
Questions for the listing agent
- What do current leases actually rent for vs. the listed asking? Can we see a recent rent roll and the last 12 months of T-12 income?
- Built in 1957 — when were the roof, HVAC, electrical panel, plumbing, and water heater last replaced?
- Is there a deadline driving the sale (1031 exchange, divorce, estate, relocation)? That informs how much negotiation room exists.
- Schools are B-rated — typically a magnet for longer-tenancy family renters. What's the average tenant stay here, and is there a school-zone premium baked into asking?
- The area grade is low — what's the realistic commute time and amenity access for the typical tenant pool here? Any planned neighborhood developments (good or bad) we should know about?
- What's the average days-on-market for RENTAL listings here right now (not sales)? A rising rental-DOM trend means longer vacancies and softer asking-rent achievability than the comps imply.
- What's the recent tenant-quality profile in this submarket — average credit score on applications, eviction rate, late-payment / NSF rate, and stable-employment percentage? A property-management company in the area should have these aggregated.
- How much new for-sale + rental construction is in the pipeline within 1–3 miles? Heavy new supply typically softens prices + rents 12–24 months out; constrained supply supports both.
Investment metrics
- 1% rule
- 0.88% ✗
- Cap rate
- 6.02%
- Cash-on-cash
- -0.97%
- DSCR
- 0.96
- GRM
- 9.4
CMA / ARV
- ARV (on-the-fly)
- $168,750
- Comps found
- 12
Show comp detail 12 sales within ~0.75 mi
| Address | Dist | Beds/Ba | Sqft | Sold | Price | $/sf | Match |
|---|---|---|---|---|---|---|---|
| 5334 Mays Dr | 0.24mi | 4/2.0 | 1,508 (+12%) | 5mo | $143,000 | $95 | 65 |
| 2702 Eventide Dr | 0.18mi | 3/1.0 (-1) | 1,272 (-6%) | 11mo | $125,000 | $98 | 64 |
| 5211 Vernon Rd | 0.24mi | 3/2.0 (-1) | 1,209 (-10%) | 12mo | $230,000 | $190 | 56 |
| 2936 Breve Dr | 0.34mi | 3/1.0 (-1) | 1,156 (-14%) | 7mo | $145,000 | $125 | 46 |
| 5822 Begonia Rd | 0.57mi | 3/2.0 (-1) | 1,504 (+11%) | 5mo | $185,000 | $123 | 45 |
| 4037 Marland St | 0.47mi | 3/2.0 (-1) | 1,180 (-13%) | 11mo | $188,000 | $159 | 43 |
| 2611 Sunny Acres Dr N | 0.28mi | 3/1.0 (-1) | 1,158 (-14%) | 14mo | $98,000 | $85 | 42 |
| 5541 Mahalia Dr | 0.52mi | 3/2.0 (-1) | 1,196 (-11%) | 13mo | $205,000 | $171 | 41 |
| 2239 W 45th St | 0.64mi | 3/2.0 (-1) | 1,169 (-13%) | 5mo | $193,020 | $165 | 39 |
| 3542 Division St | 0.69mi | 3/1.0 (-1) | 1,216 (-10%) | 5mo | $62,500 | $51 | 39 |
| 3562 Gladys St | 0.72mi | 3/2.0 (-1) | 1,248 (-8%) | 14mo | $177,000 | $142 | 37 |
| 5811 Geranium Rd | 0.60mi | 4/1.0 | 1,500 (+11%) | 15mo | $114,900 | $77 | 37 |
Match score weights: distance 35% · size 25% · config 20% · recency 20%. Top-matched comps best support the ARV.
Projected returns pro-forma
-3.0% appreciation · 1.81% rent growth · sell at horizon
- IRR
- -19.3%
- Equity multiple
- 0.33×
- Total profit
- $-31,527
- Equity at exit
- $25,198
- IRR
- -14.6%
- Equity multiple
- 0.21×
- Total profit
- $-37,442
- Equity at exit
- $14,612
Cash invested: $47,320 (down + closing). Projections, not guarantees.
Landlord ↔ Tenant lean methodology
- Overall (STATE)
- 87 Strongly Landlord-Friendly
- State Florida
- 87 Strongly Landlord-Friendly · R+3
- County
- — inherits STATE
- City
- — inherits STATE
ZIP-level market 32209
- Home prices YoY
- -22.1%
- Rents YoY
- 1.8%
- Active inventory
- 394
- Price-to-rent
- 9.4×
Monthly cashflow live
- Estimated rent
- $1,493 high interval (Pro) →
- Mortgage (P&I)
- −$886
- Tax from tax record
- −$261 /mo · $3,129/yr
- Insurance
- −$70
- HOA
- −$0
- Vacancy / Maint / Mgmt
- −$313
- Net cashflow
- $-38
Break-even live
UW: 25.0% down · 7.5% · 30yr · 1.5% tax · 5.0% vac · 8.0% maint · 8.0% mgmt
Financing live
Cash to close
- Down payment
- $42,250
- Closing costs
- $5,070
- Reserves months
- —
- Total cash needed
- —
Loan-product check · same deal, 3 products live
Conventional
25% down · 7.5% · 30yr
- Down + closing
- —
- Monthly P&I
- —
- Monthly cashflow
- —
- DSCR
- —
- Eligible?
- —
Personal DTI + credit; lowest rate.
DSCR
20% down · 8.5% · 30yr
- Down + closing
- —
- Monthly P&I
- —
- Monthly cashflow
- —
- DSCR
- —
- Eligible?
- —
No personal income docs; deal must DSCR.
Hard money
10% down · 12.0% · 12mo
- Down + closing
- —
- Monthly P&I
- —
- Monthly cashflow
- —
- DSCR
- —
- Eligible?
- —
Short-term bridge; refi at stabilization.
Rent comps 40 comps
| Address | Beds | Baths | Sqft | Rent | $/sqft | DOM | Units | Dist |
|---|---|---|---|---|---|---|---|---|
| 5428 Bunche Dr Jacksonville, FL | 3.0 | 1.0 | 900 | $1,600 | $1.78 | 23d | 1 | 0.09mi |
| 5247 Cleveland Rd Jacksonville, FL | 4.0 | 2.0 | 1850 | $1,775 | $0.96 | 14d | 1 | 0.14mi |
| 5227 Bunche Dr Jacksonville, FL | 3.0 | 2.0 | 1174 | $1,450 | $1.24 | 23d | 1 | 0.17mi |
| 5326 Mays Dr Jacksonville, FL | 3.0 | 1.0 | 900 | $1,200 | $1.33 | 23d | 1 | 0.22mi |
| 5217 Mays Dr Jacksonville, FL | 3.0 | 1.0 | 900 | $1,250 | $1.39 | 7d | 1 | 0.23mi |
| 5565 Minosa Cir E Jacksonville, FL | 3.0 | 1.0 | 1227 | $1,400 | $1.14 | 4d | 1 | 0.36mi |
| 5531 Agra Ct Jacksonville, FL | 3.0 | 1.0 | 988 | $1,295 | $1.31 | 14d | 1 | 0.38mi |
| 5035 Campenella Dr Jacksonville, FL | 3.0 | 1.0 | 875 | $1,095 | $1.25 | 23d | 1 | 0.42mi |
| 2904 Lippia Rd Jacksonville, FL | 4.0 | 1.0 | 964 | $1,400 | $1.45 | 23d | 1 | 0.42mi |
| 5814 Begonia Rd Unit 1 Jacksonville, FL | 3.0 | 1.5 | 1500 | $1,655 | $1.10 | 23d | 1 | 0.55mi |
| 2268 W 44th St Jacksonville, FL | 3.0 | 2.0 | 1077 | $1,440 | $1.34 | 4d | 1 | 0.56mi |
| 5821 Begonia Rd Jacksonville, FL | 3.0 | 2.0 | 1230 | $1,155 | $0.94 | 4d | 1 | 0.56mi |
| 5838 Abelia Rd Jacksonville, FL | 3.0 | 1.0 | 1135 | $1,150 | $1.01 | 23d | 1 | 0.59mi |
| 5306 Paris Ave Jacksonville, FL | 3.0 | 1.0 | 944 | $1,150 | $1.22 | 23d | 1 | 0.64mi |
| 2661 W 25th St Jacksonville, FL | 4.0 | 2.0 | 1031 | $1,350 | $1.31 | 23d | 1 | 0.64mi |
| 2693 W 25th St Jacksonville, FL | 3.0 | 1.5 | 1300 | $1,450 | $1.12 | 23d | 1 | 0.65mi |
| 2108 Talladega Rd Jacksonville, FL | 3.0 | 2.0 | 1160 | $1,579 | $1.36 | 4d | 1 | 0.74mi |
| 3516 Penton St Jacksonville, FL | 3.0 | 1.0 | 1000 | $1,350 | $1.35 | 23d | 1 | 0.75mi |
| 5816 Paris Ave Jacksonville, FL | 4.0 | 2.0 | 1701 | $1,599 | $0.94 | 23d | 1 | 0.79mi |
| 2050 W 40th St Jacksonville, FL | 3.0 | 1.0 | 1010 | $1,350 | $1.34 | 16d | 1 | 0.80mi |
| 2069 Talladega Rd Jacksonville, FL | 4.0 | 2.0 | 1152 | $1,298 | $1.13 | 4d | 1 | 0.80mi |
| 4144 Katanga Dr N Jacksonville, FL | 3.0 | 1.0 | 1114 | $1,095 | $0.98 | 23d | 1 | 0.82mi |
| 2151 Wilberforce Rd Jacksonville, FL | 3.0 | 2.0 | 1166 | $1,249 | $1.07 | 23d | 1 | 0.84mi |
| 6188 Pettiford Dr W Jacksonville, FL | 3.0 | 2.0 | 1499 | $1,850 | $1.23 | 12d | 1 | 0.87mi |
| 6114 Strawflower Pl Jacksonville, FL | 3.0 | 1.0 | 1030 | $1,200 | $1.17 | 23d | 1 | 0.98mi |
| 1834 Meharry Ave Jacksonville, FL | 3.0 | 1.0 | 1291 | $1,295 | $1.00 | 4d | 1 | 1.08mi |
| 1867 W 41st St Jacksonville, FL | 3.0 | 2.0 | 1218 | $1,325 | $1.09 | 17d | 1 | 1.09mi |
| 6601 Cleveland Rd Jacksonville, FL | 3.0 | 1.0 | 896 | $1,400 | $1.56 | 23d | 1 | 1.09mi |
| 2344 W 18th St Jacksonville, FL | 3.0 | 1.5 | 1129 | $1,425 | $1.26 | 14d | 1 | 1.09mi |
| 1823 W 44th St Jacksonville, FL | 3.0 | 2.0 | 1066 | $1,500 | $1.41 | 23d | 1 | 1.16mi |
| 2345 W 15th St Jacksonville, FL | 3.0 | 2.0 | 1112 | $1,400 | $1.26 | 23d | 1 | 1.20mi |
| 5350 Dodge Rd Jacksonville, FL | 3.0 | 1.0 | 1000 | $1,500 | $1.50 | 23d | 1 | 1.22mi |
| 5352 Dodge Rd Jacksonville, FL | 3.0 | 2.0 | 1050 | $1,261 | $1.20 | 23d | 1 | 1.22mi |
| 4236 Homer Rd N Jacksonville, FL | 3.0 | 1.0 | 888 | $1,250 | $1.41 | 11d | 1 | 1.22mi |
| 6412 New Kings Rd Unit 2 Jacksonville, FL | 3.0 | 2.0 | 1300 | $1,400 | $1.08 | 17d | 1 | 1.25mi |
| 3004 W 16th St Unit 1 Jacksonville, FL | 3.0 | 2.0 | 1456 | $1,526 | $1.05 | 23d | 1 | 1.26mi |
| 6731 W Virginia Ct Jacksonville, FL | 3.0 | 1.0 | 1188 | $1,225 | $1.03 | 21d | 1 | 1.26mi |
| 1863 W 29th St Jacksonville, FL | 3.0 | 2.0 | 956 | $1,190 | $1.24 | 21d | 1 | 1.28mi |
| 2138 W 17th St Jacksonville, FL | 3.0 | 1.0 | 1158 | $1,425 | $1.23 | 4d | 1 | 1.29mi |
| 2415 N Canal St Jacksonville, FL | 4.0 | 2.0 | 1572 | $1,475 | $0.94 | 19d | 1 | 1.32mi |
Listing history 6 events
-
2026-05-13$169,000 Active
-
2021-02-09soldstatus $140,000 165-char remark
Show marketing remark (165 chars)
This newly renovated home is move in ready! It has 4 bedrooms and 2 bathroom with 1,350 sq feet of living space and updates throughout. Call for your showing today!
-
2021-02-09$140,000 165-char remark
Show marketing remark (165 chars)
This newly renovated home is move in ready! It has 4 bedrooms and 2 bathroom with 1,350 sq feet of living space and updates throughout. Call for your showing today!
-
2021-01-26soldstatus $140,000
-
2012-12-07soldstatus $13,000 90-char remark
Show marketing remark (90 chars)
Great fixer upper in well maintained neighborhood. 4 bedroom 2 bath with a large backyard.
-
2012-07-02$17,900 90-char remark
Show marketing remark (90 chars)
Great fixer upper in well maintained neighborhood. 4 bedroom 2 bath with a large backyard.
ⓘ Source: listings_history table (triggers on properties + properties_extension) + one-shot
backfill from property_details.listing_events for pre-trigger history.
Tax reassessment forecast FL · Resets to sale price
- Current annual tax
- $3,129 · $261/mo
- Projected year-2 tax
- $3,129 · $261/mo
- Expected delta
- $0/yr ($0/mo · 0.0%)
ⓘ Screening estimate from a state-policy table — verify with the county assessor before closing.
Climate risk First Street
- Flood 4/10 Moderate FEMA zone X (shaded) · 20% chance over 30 yrs
- Wildfire 1/10 Low
- Heat 9/10 Extreme 7 d/yr ≥107°F today · 20 d/yr by 30 yrs out
- Wind 9/10 Extreme 99% chance of damaging wind over 30 yrs
- Air quality 4/10 Moderate 6 unhealthy d/yr today · 6 by 30 yrs out
Nearby sold comps map
Loading sold comps map…
Walkable amenities ~0.75 mi
Loading nearby amenities…
Taxation est. · year 1
- Rental income
- $17,913
- − Mortgage interest
- −$9,467
- − Property taxes
- −$3,129
- − Insurance
- −$845
- − Repairs & maintenance
- −$1,433
- − Management
- −$1,433
- − Depreciation
- −$4,916
- Taxable loss
- −$3,310
- Est. tax savings @ 24.0%
- +$794
- After-tax cash flow
- $337/yr
For passive investors: Depreciation is non-cash, so a rental often shows a tax loss while cash-flowing — sheltering income. Rental losses are passive: they offset passive income freely, and up to $25,000/yr can offset ordinary (W-2) income if you actively participate and your MAGI is under $100k (phasing out to $0 by $150k); unused losses carry forward. On sale, claimed depreciation is recaptured at up to 25%, and gains may owe capital-gains tax (a 1031 exchange can defer both). Figures are a year-1 estimate at your 24.0% rate — not tax advice; consult a CPA.
Schools (NCES district)
- District
- Duval
- NCES district ID
- 1200480
- Math proficiency
- 46% ▼ -11.00%
- Reading proficiency
- 45% ▼ -4.00%
- Median HH income
- $48,987
- Composite
- 38.97/100
- National rank
- #4076
- State rank
- #48 of 73 in FL
Livability — Jacksonville
- Score
- 83/100
- State rank
- #50
- US rank
- #911
Category grades
Schools grade is shown separately in the Schools card above.
Census & demographics
- Census place
- Jacksonville, FL
- County
- Duval County · 1,015,274 people
- City population
- 979,034
- Metro
- Jacksonville, FL
- Population (ZIP)
- 34,657
- Household income
- $30,514
- Rent vs Own
- Severe rent burden
- 2921.0
Population outlook (Duval County) Hauer SSP2
- Today (2025)
- 1,013,010 people
- By 2030
- 1,059,228 · +4.6%
- By 2040
- 1,141,439 · +12.7%
- By 2050
- 1,205,258 · +19.0%
- By 2075
- 1,324,282 · +30.7%
- By 2100
- 1,319,620 · +30.3%
Race, ethnicity, and origin ACS 2023
- Neighborhood character
- Predominantly Black (88%)
- Race & ethnicity
- Black 88% White 5% Hispanic / Latino 5% Two or more races 2%
- Hispanic origin (detail)
- Puerto Rican 3%
- Common ancestry
- Hispanic 1% Romanian 1%
- Foreign-born
- 3% · Canada
- Languages at home
- 95% English-only · Spanish 4% French/Haitian/Cajun 1%
Political lean MEDSL · Duval
- 2024 margin
- Toss-up / Even · D 48.7% · R 50.1% · Other 1.2%
- 2008→2024 swing
- +0.4pp no change · 2008: -1.9pp · 2024: -1.5pp
- All cycles
- 2024: R+1.5 2020: D+3.8 2016: R+1.5 2012: R+3.6 2008: R+1.9
Not yet ingested
- Civics
- —
Market trends
- HPI YoY
- ▼ -53.92%
- Current HPI
- 189.5977
- Rent YoY
- ▲ 1.81%
- Metro
- Jacksonville, FL
- State GDP YoY
- ▲ 3.28%
- F500 in state
- 36
Industry mix (Fortune 500 HQ in FL)
| Industry | F500 HQs | Revenue |
|---|---|---|
| Industrial Technology | 2 | $29B |
|
||
| Insurance | 2 | $17B |
|
||
| Retail | 1 | $60B |
|
||
| Technology Distribution | 1 | $58B |
|
||
| Homebuilding | 1 | $35B |
|
||
| Technology Manufacturing | 1 | $35B |
|
||
Price history
+844.1% since first listed6 events — show timeline
- 2026-05-13 Listed $169,000 realMLS
- 2021-02-09 Listed $140,000 realMLS
- 2021-02-09 Sold (MLS) $140,000 realMLS
- 2021-01-26 Sold (Public Records) $140,000 Public Records
- 2012-12-07 Sold (MLS) $13,000 realMLS
- 2012-07-02 Listed $17,900 realMLS
Property tax history
+13.9%/yrLatest (2025): $3,129 · +9.5% YoY. Source: county tax records.
Cash-flow waterfall
monthlySold comps — $/sqft
last 12 mo · ≤1 miLoading sold comps…