1152 Swan Ln · Westminster, SC
Flood risk 1/10 · Minimal
- FEMA flood zone
- X (unshaded)
- Chance of flooding over 30 yrs
- 0.0%
- Est. flood insurance / yr
- $507 – $1,088
Fire risk 5/10 · Moderate
- Est. fire insurance / yr
- $783 – $1,453
Heat risk 5/10 · Moderate
- Hot days now (above 104°F)
- 7 days/yr
- Hot days in 30 yrs
- 18 days/yr
Wind risk 2/10 · Minimal
- Chance of severe wind over 30 yrs
- 1.0%
Air-quality risk 3/10 · Minor
- Unhealthy air days now
- 3 days/yr
- Unhealthy air days in 30 yrs
- 4 days/yr
Risk factors via First Street. Map © Google.
Why this score? — see what drove the B- grade
The composite is a weighted blend of 9 inputs, each scored 0–100. Each bar is that input's sub-score; the figure is the points it added to the 100-point composite (weight × sub-score).
- Cash flow +30.0/30.0
- 1% rule +10.0/10.0
- DSCR +10.0/10.0
- ARV discount +7.5/15.0
- Schools +3.7/10.0
- Livability +3.2/5.0
- Rent growth +2.5/5.0
- Condition / age +2.5/5.0
- Appreciation +0.0/10.0
$89,000
🖨 Deal sheet 📄 Offer letter ✓ Due diligence
Listing remarks MLS
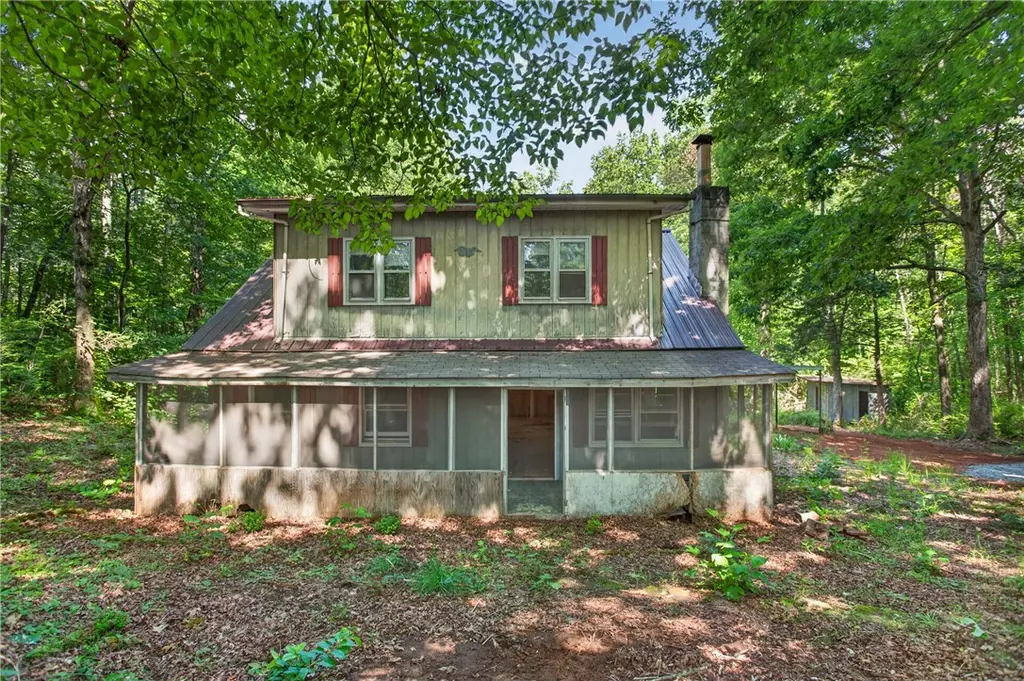
Diamond in the rough this farmhouse style home is situated on 2.21 acres with 3 bedrooms, 2 baths, kitchen, living room with fireplace and screened in porch.
Key facts
- Private well
- Abundant potential
- Charming creek
Tags
Property features AI
Finance
- Other: Lot is approximately 2.21 acres; Lot is level, wooded, with a stream/creek; Located outside city limits and not in a subdivision
Exterior
- Parking: Detached carport; Detached 2-car garage; Driveway
- Utilities: Electricity available; Private well water; Septic (septic tank)
- Home design: 2 stories; Wood siding; Metal roof; Crawlspace foundation
- Construction: Wood siding construction; Metal roof; Built 31–50 years ago
- Exterior features: Front porch; Screened porch; Porch
Interior
- Kitchen: Electric oven; Electric range; Refrigerator
- Bedrooms: 1 main-level bedroom
- Bathrooms: 2 full bathrooms; 1 main-level bathroom
- Heating & cooling: Heating: see remarks
- Interior features: Ceiling fan(s); Wood window frames
Neighborhood map
What this means for you Summary
Snapshot
- This is a 3-bed/2.0-bath single-family listed at $89k.
Deal economics
- At list price, monthly cash flow is $580 ($7k/yr) — positive.
- The deal already cash-flows at list — no discount required.
- Meets the 1% rule at list price ($2k rent vs $89k).
- Cap rate 14.1% vs local median 4.0% in Westminster — top-decile yield for the area; either an underpriced asset or a hidden risk that comps aren't pricing in. Stress-test before assuming the spread holds.
Location & tenants
- Location reads 65/100 on livability (#137 in SC) — a middle-class / working-renter tenant base. Strengths: cost of living A+, housing A, crime B; Watch: schools F, amenities F, commute F.
- Oconee 01 (rural): math 41% / reading 47% proficiency, ranked #27 of 80 in SC (top 34%) — families likely to look elsewhere, expect single-tenant / working-renter base with shorter leases.
- Market conditions: 306 active listings in the ZIP; 648 units permitted in Oconee County in 2024 (40 in 5+ unit buildings).
Forward outlook
- Local home prices are declining (-3.0%/yr); year-one equity from $615 of loan paydown is wiped out by about $3k of value loss. Plan a longer hold.
- At projected returns (-3.0% appreciation + 3.0% rent growth), your $25k cash investment doubles in ~5 years — after that, you're playing with house money.
Negotiation context
- Only 6 days on market — expect competitive offers; lowballing is unlikely to land.
- 2 sale attempts since 8y ago with the ask held roughly flat each time — persistent listings suggest the price (not the market) is what's stuck; bring a comps-based counter.
- Current owner paid $45k; list at $89k implies a 98% gain — meaningful room to come down on a strong offer.
Risks & watch-outs
- Climate carrying-cost: moderate wildfire risk; extreme-heat days projected 7→18/yr by 2055 (HVAC capex compounding) — expect insurance premiums to compound above CPI over the hold.
Questions for the listing agent
- Is there a deadline driving the sale (1031 exchange, divorce, estate, relocation)? That informs how much negotiation room exists.
- Schools are F-rated, which usually means shorter tenancies and higher turnover. Who's the typical renter profile here, and what's been the actual vacancy rate?
- What's the average days-on-market for RENTAL listings here right now (not sales)? A rising rental-DOM trend means longer vacancies and softer asking-rent achievability than the comps imply.
- What's the recent tenant-quality profile in this submarket — average credit score on applications, eviction rate, late-payment / NSF rate, and stable-employment percentage? A property-management company in the area should have these aggregated.
- How much new for-sale + rental construction is in the pipeline within 1–3 miles? Heavy new supply typically softens prices + rents 12–24 months out; constrained supply supports both.
Investment metrics
- 1% rule
- 1.69% ✓
- Cap rate
- 14.12%
- Cash-on-cash
- 27.94%
- DSCR
- 2.24
- GRM
- 4.9
CMA / ARV
No comps found within radius.
Projected returns pro-forma
-3.0% appreciation · 3.0% rent growth · sell at horizon
- IRR
- 22.1%
- Equity multiple
- 1.90×
- Total profit
- $22,548
- Equity at exit
- $13,270
- IRR
- 30.1%
- Equity multiple
- 3.70×
- Total profit
- $67,296
- Equity at exit
- $7,695
Cash invested: $24,920 (down + closing). Projections, not guarantees.
Landlord ↔ Tenant lean methodology
- Overall (STATE)
- 90 Strongly Landlord-Friendly
- State South Carolina
- 90 Strongly Landlord-Friendly · R+6
- County
- — inherits STATE
- City
- — inherits STATE
ZIP-level market 29693
- Active inventory
- 306
- Price-to-rent
- 4.9×
Monthly cashflow live
- Estimated rent
- $1,508 medium interval (Pro) →
- Mortgage (P&I)
- −$467
- Tax from tax record
- −$107 /mo · $1,287/yr
- Insurance
- −$37
- HOA
- −$0
- Vacancy / Maint / Mgmt
- −$317
- Net cashflow
- $580
Break-even live
UW: 25.0% down · 7.5% · 30yr · 1.5% tax · 5.0% vac · 8.0% maint · 8.0% mgmt
Financing live
Cash to close
- Down payment
- $22,250
- Closing costs
- $2,670
- Reserves months
- —
- Total cash needed
- —
Loan-product check · same deal, 3 products live
Conventional
25% down · 7.5% · 30yr
- Down + closing
- —
- Monthly P&I
- —
- Monthly cashflow
- —
- DSCR
- —
- Eligible?
- —
Personal DTI + credit; lowest rate.
DSCR
20% down · 8.5% · 30yr
- Down + closing
- —
- Monthly P&I
- —
- Monthly cashflow
- —
- DSCR
- —
- Eligible?
- —
No personal income docs; deal must DSCR.
Hard money
10% down · 12.0% · 12mo
- Down + closing
- —
- Monthly P&I
- —
- Monthly cashflow
- —
- DSCR
- —
- Eligible?
- —
Short-term bridge; refi at stabilization.
Listing history 6 events
-
2026-06-18days on market $89,000 Active 6 DOM
-
2026-06-17days on market $89,000 Active 5 DOM
-
2026-06-16days on market $89,000 Active 4 DOM
-
2026-06-15days on market $89,000 Active 3 DOM
-
2026-06-13remarks 699-char remark
-
2026-06-13$89,000 Active 1 DOM
ⓘ Source: listings_history table (triggers on properties + properties_extension) + one-shot
backfill from property_details.listing_events for pre-trigger history.
Tax reassessment forecast SC · Resets to sale price
- Current annual tax
- $1,287 · $107/mo
- Projected year-2 tax
- $1,287 · $107/mo
- Expected delta
- $0/yr ($0/mo · 0.0%)
ⓘ Screening estimate from a state-policy table — verify with the county assessor before closing.
Climate risk First Street
- Flood 1/10 Low FEMA zone X (unshaded) · 0% chance over 30 yrs
- Wildfire 5/10 Major
- Heat 5/10 Major 7 d/yr ≥104°F today · 18 d/yr by 30 yrs out
- Wind 2/10 Low 100% chance of damaging wind over 30 yrs
- Air quality 3/10 Moderate 3 unhealthy d/yr today · 4 by 30 yrs out
Nearby sold comps map
Loading sold comps map…
Walkable amenities ~0.75 mi
Loading nearby amenities…
Taxation est. · year 1
- Rental income
- $18,095
- − Mortgage interest
- −$4,985
- − Property taxes
- −$1,287
- − Insurance
- −$445
- − Repairs & maintenance
- −$1,448
- − Management
- −$1,448
- − Depreciation
- −$2,589
- Taxable income
- $5,893
- Est. tax owed @ 24.0%
- −$1,414
- After-tax cash flow
- $5,547/yr
For passive investors: Depreciation is non-cash, so a rental often shows a tax loss while cash-flowing — sheltering income. Rental losses are passive: they offset passive income freely, and up to $25,000/yr can offset ordinary (W-2) income if you actively participate and your MAGI is under $100k (phasing out to $0 by $150k); unused losses carry forward. On sale, claimed depreciation is recaptured at up to 25%, and gains may owe capital-gains tax (a 1031 exchange can defer both). Figures are a year-1 estimate at your 24.0% rate — not tax advice; consult a CPA.
Schools (NCES district)
- District
- Oconee 01
- NCES district ID
- 4503060
- Math proficiency
- 41% ▼ -7.00%
- Reading proficiency
- 47% ▼ -1.00%
- Median HH income
- $42,074
- Composite
- 37.03/100
- National rank
- #4516
- State rank
- #27 of 80 in SC
Livability — Westminster
- Score
- 65/100
- State rank
- #137
- US rank
- #13262
Category grades
Schools grade is shown separately in the Schools card above.
Census & demographics
- Population (ZIP)
- 13,826
Population outlook (Oconee County) Hauer SSP2
- Today (2025)
- 77,950 people
- By 2030
- 78,551 · +0.8%
- By 2040
- 78,628 · +0.9%
- By 2050
- 77,052 · -1.2%
- By 2075
- 71,098 · -8.8%
- By 2100
- 61,216 · -21.5%
Race, ethnicity, and origin ACS 2023
- Neighborhood character
- Predominantly White (92%)
- Race & ethnicity
- White 92% Hispanic / Latino 3% Two or more races 3% Black 3%
- Common ancestry
- Serbian 3% Lithuanian 2% Slovak 2%
- Foreign-born
- 2% · Canada
- Languages at home
- 97% English-only · Spanish 2%
Political lean MEDSL · Oconee
- 2024 margin
- Solid R (+51.5) · D 23.6% · R 75.2% · Other 1.2%
- 2008→2024 swing
- -14.0pp toward R · 2008: -37.5pp · 2024: -51.5pp
- All cycles
- 2024: R+51.5 2020: R+47.4 2016: R+48.1 2012: R+42.6 2008: R+37.5
Not yet ingested
- Civics
- —
Market trends
- HPI YoY
- ▼ -111.35%
- Current HPI
- 167.8352
- Rent YoY
- —
- Metro
- —
- State GDP YoY
- ▲ 4.51%
- F500 in state
- 2
Industry mix (Fortune 500 HQ in SC)
| Industry | F500 HQs | Revenue |
|---|---|---|
| Packaging | 1 | $7B |
|
||
Price history
+123.1% since first listed3 events — show timeline
- 2026-06-12 Listed $89,000 WUMLS
- 2018-04-13 Sold (MLS) $45,000 WUMLS
- 2018-02-09 Listed $39,900 WUMLS
Property tax history
+15.6%/yrLatest (2025): $1,287 · +0.0% YoY. Source: county tax records.
Cash-flow waterfall
monthlySold comps — $/sqft
last 12 mo · ≤1 miLoading sold comps…