 🏷️ Likely Rental
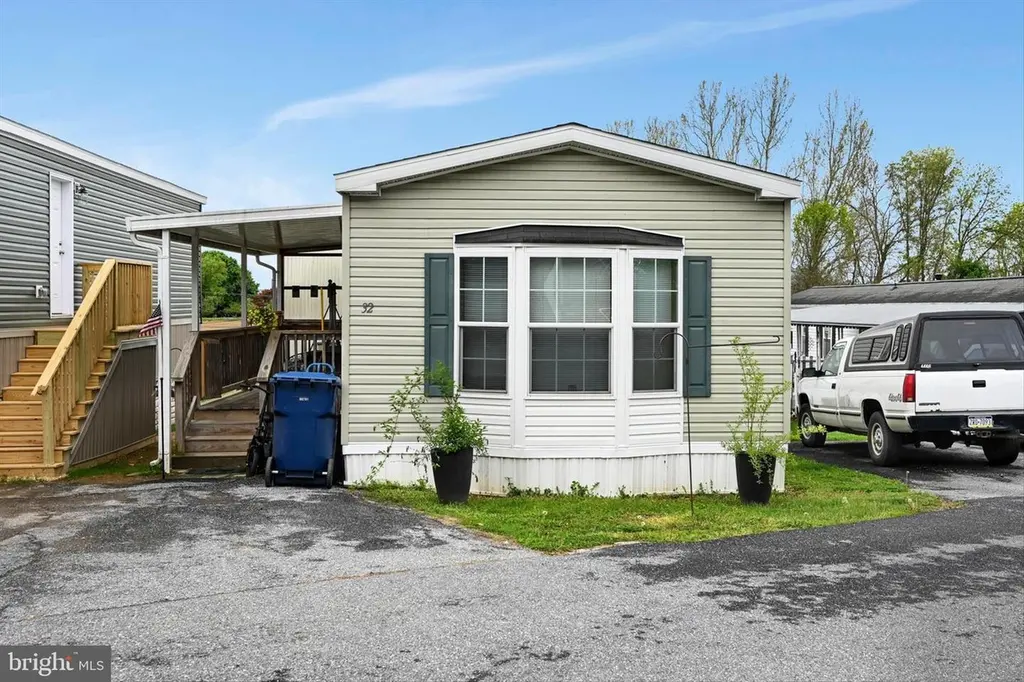
32 Olivers Park Dr · Annville, PA
Flood risk 1/10 · Minimal
- FEMA flood zone
- X (unshaded)
- Chance of flooding over 30 yrs
- 0.0%
- Est. flood insurance / yr
- $507 – $1,088
Fire risk 2/10 · Minimal
- Est. fire insurance / yr
- $511 – $949
Heat risk 5/10 · Moderate
- Hot days now (above 101°F)
- 7 days/yr
- Hot days in 30 yrs
- 15 days/yr
Wind risk 4/10 · Minor
- Chance of severe wind over 30 yrs
- 9.0%
Air-quality risk 3/10 · Minor
- Unhealthy air days now
- 3 days/yr
- Unhealthy air days in 30 yrs
- 5 days/yr
Risk factors via First Street. Map © Google.
Why this score? — see what drove the B+ grade
The composite is a weighted blend of 9 inputs, each scored 0–100. Each bar is that input's sub-score; the figure is the points it added to the 100-point composite (weight × sub-score).
- Cash flow +30.0/30.0
- ARV discount +15.0/15.0
- 1% rule +10.0/10.0
- DSCR +10.0/10.0
- Schools +4.2/10.0
- Livability +3.8/5.0
- Rent growth +2.5/5.0
- Condition / age +2.5/5.0
- Appreciation +0.0/10.0
$100,000
🖨 Deal sheet 📄 Offer letter ✓ Due diligence
Listing remarks MLS
Well-maintained manufactured home in North Annville features eat-in kitchen, C/A, covered patio and storage shed. All appliances included. $235/month lot rent covers water, sewer & trash
Key facts
- 2 parking spots
- Built 2016
- Listed 42 days
Property features AI
Finance
- Other: Not in a federal flood zone; Accessibility: 2+ access exits; Pets allowed (case-by-case; cats and dogs ok; size/weight restrictions)
- Financial info: Ground rent exists and is paid monthly ($425/month); Annual ground rent listed as an income/expense item
- HOA & community: Association fees include water, sewer and trash; Located in North Annville Manufactured Home Community; Property manager present
Exterior
- Parking: Off-street parking (2 spaces) with asphalt driveway; Total of 2 garage/parking spaces
- Utilities: Community water; Community septic tank; Electric hot water
- Home design: Manufactured home (single wide, modular/manufactured); Estimated year built
- Construction: Vinyl siding; Manufactured structure; Shed on the property
- Exterior features: Porch(es); Street lights
Interior
- Kitchen: Eat-in kitchen; Combination kitchen/dining layout
- Bedrooms: 3 bedrooms on the main level
- Flooring: Carpet
- Bathrooms: 2 full bathrooms (including tub/shower and walk-in shower)
- Heating & cooling: Forced air heating; Propane (leased) heating fuel; Central air conditioning (electric)
- Interior features: Tub shower and walk-in shower in bathrooms; Combination kitchen/dining area; Ceiling fans; Traditional floor plan; Kitchen eat-in; Walk-in closets; Main-floor laundry; Entry-level bedroom(s)
- Laundry & utility: Laundry located on the main floor
Neighborhood map
What this means for you Summary
Snapshot
- This is a 3-bed/2.0-bath manufactured listed at $100k.
Deal economics
- At list price, monthly cash flow is $581 ($7k/yr) — positive.
- The deal already cash-flows at list — no discount required.
- Meets the 1% rule at list price ($2k rent vs $100k).
- Recommended offer: $97k (3.0% below list) — sets the bar for market timing.
- Cap rate 13.3% vs local median 1.1% in Annville — top-decile yield for the area; either an underpriced asset or a hidden risk that comps aren't pricing in. Stress-test before assuming the spread holds.
Location & tenants
- Location reads 76/100 on livability (#384 in PA, #3,423 nationally) — a middle-class / working-renter tenant base. Strengths: cost of living A+, housing A+, health & safety A+; Watch: amenities F, commute F.
- Annville-Cleona SD (rural): math 38% / reading 58% proficiency, ranked #202 of 539 in PA (top 38%) — families likely to look elsewhere, expect single-tenant / working-renter base with shorter leases.
- Zoned schools: Annville El Sch (math 35% / reading 59%, grade D-, #737 of 1,518 statewide, top 52%, 444 students, 41% FRL) — zoned schools average 41% FRL vs 23% district-wide (18 pts higher); higher-poverty schools than district average — tighter screening recommended.
- Market conditions: 167 active listings in the ZIP; 315 units permitted in Lebanon County in 2024 (36 in 5+ unit buildings).
Forward outlook
- Local home prices are declining (-3.0%/yr); year-one equity from $691 of loan paydown is wiped out by about $3k of value loss. Plan a longer hold.
- Lebanon County population projected at +10% by 2050 — modest demand growth; plan on rents tracking national, not racing it.
- At projected returns (-3.0% appreciation + 3.0% rent growth), your $28k cash investment doubles in ~5 years — after that, you're playing with house money.
Negotiation context
- It's been on market 42 days — a 3% lower offer ($97k) is reasonable based on typical stale-listing flexibility.
- 2 sale attempts since 19y ago with the ask held roughly flat each time — persistent listings suggest the price (not the market) is what's stuck; bring a comps-based counter.
- Current owner paid $10k; list at $100k implies a 900% gain — meaningful room to come down on a strong offer.
Risks & watch-outs
- Climate carrying-cost: extreme-heat days projected 7→15/yr by 2055 (HVAC capex compounding) — expect insurance premiums to compound above CPI over the hold.
Questions for the listing agent
- It's been on market 42 days. Have you received any prior offers? Is the seller open to a 3% concession, seller financing, or rate buy-down credit?
- Is there a deadline driving the sale (1031 exchange, divorce, estate, relocation)? That informs how much negotiation room exists.
- Schools are B-rated — typically a magnet for longer-tenancy family renters. What's the average tenant stay here, and is there a school-zone premium baked into asking?
- What's the average days-on-market for RENTAL listings here right now (not sales)? A rising rental-DOM trend means longer vacancies and softer asking-rent achievability than the comps imply.
- What's the recent tenant-quality profile in this submarket — average credit score on applications, eviction rate, late-payment / NSF rate, and stable-employment percentage? A property-management company in the area should have these aggregated.
- How much new for-sale + rental construction is in the pipeline within 1–3 miles? Heavy new supply typically softens prices + rents 12–24 months out; constrained supply supports both.
Investment metrics
- 1% rule
- 1.57% ✓
- Cap rate
- 13.26%
- Cash-on-cash
- 24.89%
- DSCR
- 2.11
- GRM
- 5.3
CMA / ARV
- ARV (median comp)
- $142,565
- List price
- $100,000
- Delta
- -29.86%
- Verdict
- UNDERPRICED
- Comps
- 3 within 1.0 mi
Projected returns pro-forma
-3.0% appreciation · 3.0% rent growth · sell at horizon
- IRR
- 18.3%
- Equity multiple
- 1.74×
- Total profit
- $20,788
- Equity at exit
- $14,910
- IRR
- 26.7%
- Equity multiple
- 3.35×
- Total profit
- $65,741
- Equity at exit
- $8,646
Cash invested: $28,000 (down + closing). Projections, not guarantees.
Landlord ↔ Tenant lean methodology
- Overall (STATE)
- 62 Landlord-Friendly
- State Pennsylvania
- 62 Landlord-Friendly · EVEN
- County
- — inherits STATE
- City
- — inherits STATE
ZIP-level market 17003
- Active inventory
- 167
- Price-to-rent
- 5.3×
Monthly cashflow live
- Estimated rent
- $1,565 medium interval (Pro) →
- Mortgage (P&I)
- −$524
- Tax from tax record
- −$90 /mo · $1,076/yr
- Insurance
- −$42
- HOA
- −$0
- Vacancy / Maint / Mgmt
- −$329
- Net cashflow
- $581
Break-even live
UW: 25.0% down · 7.5% · 30yr · 1.5% tax · 5.0% vac · 8.0% maint · 8.0% mgmt
Financing live
Cash to close
- Down payment
- $25,000
- Closing costs
- $3,000
- Reserves months
- —
- Total cash needed
- —
Loan-product check · same deal, 3 products live
Conventional
25% down · 7.5% · 30yr
- Down + closing
- —
- Monthly P&I
- —
- Monthly cashflow
- —
- DSCR
- —
- Eligible?
- —
Personal DTI + credit; lowest rate.
DSCR
20% down · 8.5% · 30yr
- Down + closing
- —
- Monthly P&I
- —
- Monthly cashflow
- —
- DSCR
- —
- Eligible?
- —
No personal income docs; deal must DSCR.
Hard money
10% down · 12.0% · 12mo
- Down + closing
- —
- Monthly P&I
- —
- Monthly cashflow
- —
- DSCR
- —
- Eligible?
- —
Short-term bridge; refi at stabilization.
Listing history 21 events
-
2026-06-19days on market $100,000 Active 42 DOM
-
2026-06-18days on market $100,000 Active 41 DOM
-
2026-06-17days on market $100,000 Active 40 DOM
-
2026-06-16days on market $100,000 Active 39 DOM
-
2026-06-15days on market $100,000 Active 38 DOM
-
2026-06-14days on market $100,000 Active 36 DOM
-
2026-06-13days on market $100,000 Active 35 DOM
-
2026-06-10days on market $100,000 Active 33 DOM
-
2026-06-09days on market $100,000 Active 32 DOM
-
2026-06-08days on market $100,000 Active 31 DOM
-
2026-06-07days on market $100,000 Active 30 DOM
-
2026-06-05days on market $100,000 Active 27 DOM
-
2026-06-02days on market $100,000 Active 25 DOM
-
2026-06-01days on market $100,000 Active 24 DOM
-
2026-05-31days on market $100,000 Active 23 DOM
-
2026-05-30days on market $100,000 Active 22 DOM
-
2026-05-08$100,000 Active 896-char remark
-
2026-05-07historical $100,000 896-char remark
-
2007-12-21soldstatus $10,000 192-char remark
Show marketing remark (192 chars)
Well-maintained manufactured home in North Annville features eat-in kitchen, C/A, covered patio and storage shed. All appliances included. $235/month lot rent covers water, sewer & trash
-
2007-12-16historical 192-char remark
Show marketing remark (192 chars)
Well-maintained manufactured home in North Annville features eat-in kitchen, C/A, covered patio and storage shed. All appliances included. $235/month lot rent covers water, sewer & trash
-
2007-09-25$12,000 192-char remark
Show marketing remark (192 chars)
Well-maintained manufactured home in North Annville features eat-in kitchen, C/A, covered patio and storage shed. All appliances included. $235/month lot rent covers water, sewer & trash
ⓘ Source: listings_history table (triggers on properties + properties_extension) + one-shot
backfill from property_details.listing_events for pre-trigger history.
Tax reassessment forecast PA · Partial reset (capped growth)
- Current annual tax
- $1,076 · $90/mo
- Projected year-2 tax
- $1,328 · $111/mo
- Expected delta
- +$252/yr (+$21/mo · 23.4%)
ⓘ Screening estimate from a state-policy table — verify with the county assessor before closing.
Climate risk First Street
- Flood 1/10 Low FEMA zone X (unshaded) · 0% chance over 30 yrs
- Wildfire 2/10 Low
- Heat 5/10 Major 7 d/yr ≥101°F today · 15 d/yr by 30 yrs out
- Wind 4/10 Moderate 9% chance of damaging wind over 30 yrs
- Air quality 3/10 Moderate 3 unhealthy d/yr today · 5 by 30 yrs out
Nearby sold comps map
Loading sold comps map…
Walkable amenities ~0.75 mi
Loading nearby amenities…
Taxation est. · year 1
- Rental income
- $18,782
- − Mortgage interest
- −$5,602
- − Property taxes
- −$1,076
- − Insurance
- −$500
- − Repairs & maintenance
- −$1,503
- − Management
- −$1,503
- − Depreciation
- −$2,909
- Taxable income
- $5,691
- Est. tax owed @ 24.0%
- −$1,366
- After-tax cash flow
- $5,604/yr
For passive investors: Depreciation is non-cash, so a rental often shows a tax loss while cash-flowing — sheltering income. Rental losses are passive: they offset passive income freely, and up to $25,000/yr can offset ordinary (W-2) income if you actively participate and your MAGI is under $100k (phasing out to $0 by $150k); unused losses carry forward. On sale, claimed depreciation is recaptured at up to 25%, and gains may owe capital-gains tax (a 1031 exchange can defer both). Figures are a year-1 estimate at your 24.0% rate — not tax advice; consult a CPA.
Schools (NCES district)
- District
- Annville-Cleona SD
- NCES district ID
- 4202490
- Math proficiency
- 38% ▼ -18.00%
- Reading proficiency
- 58% ▼ -12.00%
- Median HH income
- $56,373
- Composite
- 41.66/100
- National rank
- #3421
- State rank
- #202 of 539 in PA
Livability — Annville
- Score
- 76/100
- State rank
- #384
- US rank
- #3423
Category grades
Schools grade is shown separately in the Schools card above.
Census & demographics
- Population (ZIP)
- 11,932
Population outlook (Lebanon County) Hauer SSP2
- Today (2025)
- 144,806 people
- By 2030
- 147,534 · +1.9%
- By 2040
- 152,952 · +5.6%
- By 2050
- 159,406 · +10.1%
- By 2075
- 181,736 · +25.5%
- By 2100
- 198,402 · +37.0%
Race, ethnicity, and origin ACS 2023
- Neighborhood character
- Predominantly White (88%)
- Race & ethnicity
- White 88% Hispanic / Latino 6% Asian 3% Two or more races 2% Black 1%
- Hispanic origin (detail)
- Puerto Rican 3%
- Common ancestry
- Romanian 4% Lithuanian 2% German 2%
- Foreign-born
- 5% · Canada, China, Jamaica
- Languages at home
- 90% English-only · Spanish 4% Other Indo-European 2% Chinese 1%
Political lean MEDSL · Lebanon
- 2024 margin
- Solid R (+32.0) · D 33.6% · R 65.5%
- 2008→2024 swing
- -13.1pp toward R · 2008: -18.9pp · 2024: -32.0pp
- All cycles
- 2024: R+32.0 2020: R+31.7 2016: R+35.5 2012: R+28.0 2008: R+18.9
Not yet ingested
- Civics
- —
Market trends
- HPI YoY
- ▼ -133.06%
- Current HPI
- 193.333
- Rent YoY
- —
- Metro
- —
- State GDP YoY
- ▲ 1.68%
- F500 in state
- 34
Industry mix (Fortune 500 HQ in PA)
| Industry | F500 HQs | Revenue |
|---|---|---|
| Healthcare | 2 | $309B |
|
||
| Insurance | 2 | $27B |
|
||
| Telecommunications / Media | 1 | $124B |
|
||
| Industrial Distribution | 1 | $22B |
|
||
| Financial Services | 1 | $20B |
|
||
| Chemicals / Materials | 1 | $18B |
|
||
Price history
+733.3% since first listed5 events — show timeline
- 2026-05-08 Listed $100,000 BRIGHT MLS
- 2026-05-07 Coming Soon $100,000 BRIGHT MLS
- 2007-12-21 Sold (MLS) $10,000 BRIGHT MLS
- 2007-12-16 Listing Removed — BRIGHT MLS
- 2007-09-25 Listed $12,000 BRIGHT MLS
Property tax history
+4.0%/yrLatest (2024): $1,076 · +6.6% YoY. Source: county tax records.
Cash-flow waterfall
monthlySold comps — $/sqft
last 12 mo · ≤1 miLoading sold comps…