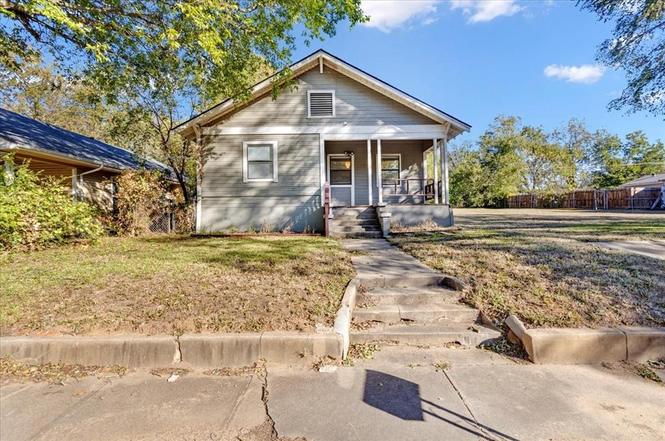
0000 W Texas St · Denison, TX
Flood risk 1/10 · Minimal
- FEMA flood zone
- X (unshaded)
- Chance of flooding over 30 yrs
- 0.0%
- Est. flood insurance / yr
- $507 – $1,088
Fire risk 4/10 · Minor
- Est. fire insurance / yr
- $1,222 – $2,270
Heat risk 6/10 · Moderate
- Hot days now (above 109°F)
- 7 days/yr
- Hot days in 30 yrs
- 21 days/yr
Wind risk 4/10 · Minor
- Chance of severe wind over 30 yrs
- 22.0%
Air-quality risk 2/10 · Minimal
- Unhealthy air days now
- 2 days/yr
- Unhealthy air days in 30 yrs
- 2 days/yr
Risk factors via First Street. Map © Google.
Why this score? — see what drove the D grade
The composite is a weighted blend of 9 inputs, each scored 0–100. Each bar is that input's sub-score; the figure is the points it added to the 100-point composite (weight × sub-score).
- Cash flow +15.6/30.0
- ARV discount +7.5/15.0
- DSCR +4.8/10.0
- 1% rule +4.3/10.0
- Schools +3.7/10.0
- Livability +3.7/5.0
- Rent growth +2.5/5.0
- Condition / age +2.5/5.0
- Appreciation +0.0/10.0
$152,500
🖨 Deal sheet (PDF) 📄 Offer letter ✓ Due diligence
Listing remarks
Welcome to this well-maintained, charming home in the heart of Denison! This lovely 2-bedroom, 1-bathroom property offers comfortable living spaces and a fantastic outdoor area. Step inside to discover the warmth and character of original wood flooring that flows throughout the main living and dining areas. Flexibility in functionality and decorating with open areas, and the home features some new paint, offering a bright and move-in ready feel. A flexible bonus room provides extra space that can easily function as a nursery, a spacious walk-in closet, a home office, or a quiet reading nook – customize it to fit your needs! Enjoy the convenience of a large utility room with ample spac
Key facts
- Covered porch
- Alley access
- Flexible bonus room
Tags
Property features AI
Finance
- Financial info: Listing terms include Cash and Conventional
- HOA & community: No HOA; community features include curbs
Exterior
- Parking: Common parking
- Security: Smoke detector(s)
- Utilities: Curbs; Sewer available; Municipal utility district: No
- Home design: Single family residence; Residential property; Property attached: Yes; Entry level: One story; Year built: 1920
- Construction: Board & batten siding; Composition roof; Pillar/post/pier foundation
- Exterior features: Covered porch and covered deck; Awnings; Front porch; Chain link fencing; Interior lot, cleared with few trees; Road frontage on a city street with asphalt surface
Interior
- Kitchen: Eat-in kitchen with breakfast bar and room for a freezer; Appliances: Electric range, refrigerator
- Bedrooms: Primary bedroom (Level 1) — approx. 12 x 11; Additional bedroom (Level 1) — approx. 10 x 13
- Flooring: Hardwood; Linoleum; Wood
- Bathrooms: 1 full bathroom (Primary bathroom features built-in cabinets and Corian-type countertop)
- Heating & cooling: Cooling: Window unit(s); Heating: Propane and space heater
- Interior features: Built-in features and natural woodwork; Cable TV available; Chandelier and decorative lighting; Eat-in kitchen; High-speed internet available; Wainscoting; One living area and one dining area; Room count: 8; Levels: One
- Laundry & utility: Separate utility room (Level 1) — approx. 11 x 9; Gas water heater
Neighborhood map
What this means for you Summary
Snapshot
- This is a 2-bed/1.0-bath condo listed at $152k.
Deal economics
- At list price, monthly cash flow is $65 ($776/yr) — positive.
- The deal already cash-flows at list — no discount required.
- To meet the 1% rule (rent ≥ 1% of price), the offer needs to be $142k (7.2% below list).
- Recommended offer: $134k (12.0% below list) — sets the bar for market timing.
- Cap rate 6.8% vs local median 3.9% in Denison — top-decile yield for the area; either an underpriced asset or a hidden risk that comps aren't pricing in. Stress-test before assuming the spread holds.
Location & tenants
- Location reads 73/100 on livability (#221 in TX) — a middle-class / working-renter tenant base. Strengths: cost of living A+, housing A+, crime A; Watch: health & safety D+, amenities F, commute F.
- Denison ISD (urban): math 43% / reading 44% proficiency, ranked #315 of 826 in TX (top 38%) — families likely to look elsewhere, expect single-tenant / working-renter base with shorter leases.
- Zoned schools: Houston El (math 47% / reading 42%, grade F, #1,155 of 4,322 statewide, top 29%, 286 students, 74% FRL); Henry Scott Middle (math 36% / reading 48%, grade D-, #572 of 1,662 statewide, top 36%, 749 students, 66% FRL); Denison H S (math 53% / reading 53%, grade C-, #437 of 1,632 statewide, top 27%, 1,310 students, 58% FRL).
- Market conditions: Rents flat; 492 active listings in the ZIP; 40 comparable units currently listed for rent nearby; rentals lingering (median 46d on market — plan ~5-8 weeks vacancy on turnover, expect pricing pressure); 62% of comp listings sitting > 30 days — soft ceiling on asking rent; 2,272 units permitted in Grayson County in 2024 (750 in 5+ unit buildings).
Forward outlook
- Local home prices are declining (-3.0%/yr); year-one equity from $1k of loan paydown is wiped out by about $5k of value loss. Plan a longer hold.
- Grayson County population projected at +12% by 2050 — modest demand growth; plan on rents tracking national, not racing it.
Negotiation context
- It's been on market 215 days — a 12% lower offer ($134k) is reasonable based on typical stale-listing flexibility.
Risks & watch-outs
- Watch-outs: built in 1920 — expect roof / HVAC / electrical / plumbing capex.
- Climate carrying-cost: extreme-heat days projected 7→21/yr by 2055 (HVAC capex compounding) — expect insurance premiums to compound above CPI over the hold.
Questions for the listing agent
- It's been on market 215 days. Have you received any prior offers? Is the seller open to a 12% concession, seller financing, or rate buy-down credit?
- Built in 1920 — when were the roof, HVAC, electrical panel, plumbing, and water heater last replaced?
- Any open or pending special assessments — roof, HVAC, plumbing, elevator, façade? What's the per-unit balance and payoff schedule, and is the seller paying it off at close or rolling it to the buyer?
- Why hasn't it sold? Are there any deal-killer items the seller is aware of (foundation, flood, title, zoning, code violations)?
- Is there a deadline driving the sale (1031 exchange, divorce, estate, relocation)? That informs how much negotiation room exists.
- Schools are D-rated, which usually means shorter tenancies and higher turnover. Who's the typical renter profile here, and what's been the actual vacancy rate?
- The area grade is low — what's the realistic commute time and amenity access for the typical tenant pool here? Any planned neighborhood developments (good or bad) we should know about?
- What's the average days-on-market for RENTAL listings here right now (not sales)? A rising rental-DOM trend means longer vacancies and softer asking-rent achievability than the comps imply.
- What's the recent tenant-quality profile in this submarket — average credit score on applications, eviction rate, late-payment / NSF rate, and stable-employment percentage? A property-management company in the area should have these aggregated.
- How much new apartment / multifamily construction is in the pipeline within 1–3 miles? Heavy new supply (>2% of stock underway) typically softens rents 12–24 months out; light construction supports rent growth.
Investment metrics
- 1% rule
- 0.93% ✗
- Cap rate
- 6.80%
- Cash-on-cash
- 1.82%
- DSCR
- 1.08
- GRM
- 9.0
CMA / ARV
No comps found within radius.
Projected returns pro-forma
-3.0% appreciation · 0.05% rent growth · sell at horizon
- IRR
- -16.8%
- Equity multiple
- 0.42×
- Total profit
- $-24,656
- Equity at exit
- $22,738
- IRR
- -15.2%
- Equity multiple
- 0.25×
- Total profit
- $-31,874
- Equity at exit
- $13,185
Cash invested: $42,700 (down + closing). Projections, not guarantees.
Landlord ↔ Tenant lean methodology
- Overall (STATE)
- 87 Strongly Landlord-Friendly
- State Texas
- 87 Strongly Landlord-Friendly · R+5
- County
- — inherits STATE
- City
- — inherits STATE
ZIP-level market 75020
- Rents YoY
- 0.1%
- Active inventory
- 492
- Price-to-rent
- 9.0×
Monthly cashflow live
- Estimated rent
- $1,416 high interval (Pro) →
- Mortgage (P&I)
- −$800
- Tax est. 1.5%
- −$191 /mo · $2,288/yr
- Insurance
- −$64
- HOA
- −$0
- Lot rent
- −$0
- Vacancy / Maint / Mgmt
- −$297
- Net cashflow
- $65
Break-even live
Sensitivity live
| Price | -10% $170 | -5% $117 | +0% $65 | +5% $12 | +10% $-41 |
|---|---|---|---|---|---|
| Rent | -10% $-47 | -5% $9 | +0% $65 | +5% $121 | +10% $176 |
| Rate | -1.0pp $141 | -0.5pp $103 | base $65 | +0.5pp $25 | +1.0pp $-15 |
UW: 25.0% down · 7.5% · 30yr · 1.5% tax · 5.0% vac · 8.0% maint · 8.0% mgmt
Financing live
Cash to close
- Down payment
- $38,125
- Closing costs
- $4,575
- Reserves months
- —
- Total cash needed
- —
Loan-product check · same deal, 3 products live
Conventional
25% down · 7.5% · 30yr
- Down + closing
- —
- Monthly P&I
- —
- Monthly cashflow
- —
- DSCR
- —
- Eligible?
- —
Personal DTI + credit; lowest rate.
DSCR
20% down · 8.5% · 30yr
- Down + closing
- —
- Monthly P&I
- —
- Monthly cashflow
- —
- DSCR
- —
- Eligible?
- —
No personal income docs; deal must DSCR.
Hard money
10% down · 12.0% · 12mo
- Down + closing
- —
- Monthly P&I
- —
- Monthly cashflow
- —
- DSCR
- —
- Eligible?
- —
Short-term bridge; refi at stabilization.
Rent comps 40 comps
| Address | Beds | Baths | Sqft | Rent | $/sqft | DOM | Units | Dist |
|---|---|---|---|---|---|---|---|---|
| 412 W Day St Denison, TX | 2.0 | 1.0 | 900 | $1,200 | $1.33 | 23d | 1 | 0.19mi |
| 404 W Day St Denison, TX | 3.0 | 2.0 | 1057 | $1,500 | $1.42 | 23d | 1 | 0.20mi |
| 1011 S Armstrong Ave Unit A Denison, TX | 2.0 | 1.0 | 1400 | $1,500 | $1.07 | 46d | 1 | 0.22mi |
| 921 W Day St Denison, TX | 3.0 | 2.0 | 1212 | $1,500 | $1.24 | 46d | 1 | 0.40mi |
| 410 S Mirick Ave Denison, TX | 3.0 | 2.0 | 1100 | $1,300 | $1.18 | 46d | 1 | 0.42mi |
| 411 S Fannin Ave #411 Denison, TX | 3.0 | 2.5 | 1322 | $1,450 | $1.10 | 23d | 1 | 0.43mi |
| 1527 S Austin Ave Denison, TX | 1.0–2.0 | 1.0–1.5 | 850 | $999 | $1.18 | 23d | 2 | 0.45mi |
| 610 W Owing St Denison, TX | 3.0 | 2.0 | 1108 | $1,395 | $1.26 | 46d | 1 | 0.45mi |
| 114 E Hull St Denison, TX | 2.0 | 2.0 | 1279 | $1,450 | $1.13 | 46d | 1 | 0.46mi |
| 1022 W Shepherd St #1022 Denison, TX | 3.0 | 2.5 | 1322 | $1,450 | $1.10 | 23d | 1 | 0.50mi |
| 626 W Crawford St Unit 101 Denison, TX | 2.0 | 2.0 | 950 | $950 | $1.00 | 23d | 1 | 0.52mi |
| 108 W Acheson St Denison, TX | 3.0 | 2.0 | 1056 | $1,550 | $1.47 | 46d | 1 | 0.52mi |
| 740 W Bullock St Denison, TX | 2.0 | 1.0 | 1000 | $1,250 | $1.25 | 23d | 1 | 0.55mi |
| 725 W Brock St Denison, TX | 3.0 | 1.5 | 1349 | $1,450 | $1.07 | 23d | 1 | 0.57mi |
| 820 W Crawford St Denison, TX | 2.0 | 1.0 | 996 | $1,250 | $1.26 | 23d | 1 | 0.58mi |
| 1011 S Perry Ave Denison, TX | 2.0 | 2.0 | 1079 | $1,350 | $1.25 | 46d | 1 | 0.58mi |
| 626 W Chestnut St Denison, TX | 2.0 | 1.0 | 1132 | $1,300 | $1.15 | 23d | 1 | 0.58mi |
| 715 W Chestnut St Denison, TX | 2.0 | 2.0 | 1273 | $1,300 | $1.02 | 46d | 1 | 0.63mi |
| 214 E Acheson St Denison, TX | 2.0 | 1.0 | 963 | $1,499 | $1.56 | 46d | 1 | 0.64mi |
| 900 W Chestnut St Denison, TX | 3.0 | 2.0 | 1742 | $1,695 | $0.97 | 46d | 1 | 0.65mi |
| 809 S Travis Ave Denison, TX | 3.0 | 2.0 | 1490 | $1,595 | $1.07 | 46d | 1 | 0.69mi |
| 1120 W Owing St Denison, TX | 3.0 | 2.0 | 1090 | $1,225 | $1.12 | 23d | 1 | 0.70mi |
| 317 W Main St #203 Denison, TX | 1.0 | 1.0 | 1000 | $1,600 | $1.60 | 46d | 1 | 0.71mi |
| 317 W Main St Unit 202 Denison, TX | 1.0 | 1.0 | 1000 | $1,700 | $1.70 | 46d | 1 | 0.71mi |
| 1311 W Day St Denison, TX | 2.0 | 1.0 | 1188 | $1,050 | $0.88 | 23d | 1 | 0.71mi |
| 313 E Nelson St Denison, TX | 3.0 | 2.0 | 1279 | $1,625 | $1.27 | 23d | 1 | 0.71mi |
| 1131 W Owing St Denison, TX | 3.0 | 2.0 | 1135 | $1,695 | $1.49 | 46d | 1 | 0.73mi |
| 1225 W Hanna St Denison, TX | 3.0 | 1.5 | 1500 | $1,600 | $1.07 | 46d | 1 | 0.74mi |
| 327-329 E Nelson St #329 Denison, TX | 3.0 | 2.0 | 1382 | $1,625 | $1.18 | 46d | 1 | 0.76mi |
| 1309 S 5th Ave Unit 1311 Denison, TX | 3.0 | 2.5 | 1224 | $1,350 | $1.10 | 46d | 1 | 0.81mi |
| 1309 S 5th Ave #1309 Denison, TX | 3.0 | 2.5 | 1224 | $1,325 | $1.08 | 46d | 1 | 0.81mi |
| 1309 S 5th Ave Denison, TX | 3.0 | 2.5 | 1224 | $1,375 | $1.12 | 46d | 1 | 0.81mi |
| 1012 S Maurice Ave Denison, TX | 3.0 | 2.0 | 1600 | $1,895 | $1.18 | 46d | 1 | 0.81mi |
| 505 E Heron St Denison, TX | 2.0 | 1.0 | 1096 | $1,250 | $1.14 | 46d | 1 | 0.83mi |
| 507 E Heron St Denison, TX | 2.0 | 1.0 | 1096 | $1,250 | $1.14 | 46d | 1 | 0.84mi |
| 509 E Heron St Denison, TX | 2.0 | 1.0 | 1324 | $1,250 | $0.94 | 46d | 1 | 0.85mi |
| 517 E Heron St Denison, TX | 3.0 | 2.0 | 1232 | $1,550 | $1.26 | 46d | 1 | 0.86mi |
| 520 E Day St Denison, TX | 3.0 | 1.0 | 1072 | $1,225 | $1.14 | 23d | 1 | 0.87mi |
| 1004 W Gandy St Denison, TX | 3.0 | 1.0 | 1250 | $1,299 | $1.04 | 23d | 1 | 0.88mi |
| 1016 W Gandy St #4 Denison, TX | 2.0 | 1.5 | 1000 | $1,100 | $1.10 | 46d | 1 | 0.89mi |
HOA detail condo
- Monthly dues
- $0 · $0/yr
- Assessments
- None detected in remarks — confirm with the listing agent.
Listing history 11 events
-
2026-06-22days on market $152,500 Active 215 DOM
-
2026-06-19days on market $152,500 Active 213 DOM
-
2026-06-18days on market $152,500 Active 212 DOM
-
2026-06-17days on market $152,500 Active 211 DOM
-
2026-06-16days on market $152,500 Active 210 DOM
-
2026-06-15days on market $152,500 Active 209 DOM
-
2026-06-14days on market $152,500 Active 207 DOM
-
2026-06-13days on market $152,500 Active 206 DOM
-
2026-06-10days on market $152,500 Active 204 DOM
-
2026-06-09remarks 693-char remark
-
2026-06-09$152,500 Active 203 DOM
ⓘ Source: listings_history table (triggers on properties + properties_extension) + one-shot
backfill from property_details.listing_events for pre-trigger history.
Climate risk First Street
- Flood 1/10 Low FEMA zone X (unshaded) · 0% chance over 30 yrs
- Wildfire 4/10 Moderate
- Heat 6/10 Major 7 d/yr ≥109°F today · 21 d/yr by 30 yrs out
- Wind 4/10 Moderate 22% chance of damaging wind over 30 yrs
- Air quality 2/10 Low 2 unhealthy d/yr today · 2 by 30 yrs out
Nearby sold comps map
Loading sold comps map…
Walkable amenities ~0.75 mi
Loading nearby amenities…
Taxation est. · year 1
- Rental income
- $16,990
- − Mortgage interest
- −$8,542
- − Property taxes
- −$2,288
- − Insurance
- −$762
- − Repairs & maintenance
- −$1,359
- − Management
- −$1,359
- − Depreciation
- −$4,436
- Taxable loss
- −$1,757
- Est. tax savings @ 24.0%
- +$422
- After-tax cash flow
- $1,197/yr
For passive investors: Depreciation is non-cash, so a rental often shows a tax loss while cash-flowing — sheltering income. Rental losses are passive: they offset passive income freely, and up to $25,000/yr can offset ordinary (W-2) income if you actively participate and your MAGI is under $100k (phasing out to $0 by $150k); unused losses carry forward. On sale, claimed depreciation is recaptured at up to 25%, and gains may owe capital-gains tax (a 1031 exchange can defer both). Figures are a year-1 estimate at your 24.0% rate — not tax advice; consult a CPA.
Schools (NCES district)
- District
- Denison ISD
- NCES district ID
- 4816710
- Math proficiency
- 43% ▼ -7.00%
- Reading proficiency
- 44% ▼ -3.00%
- Median HH income
- $41,650
- Composite
- 36.6/100
- National rank
- #4629
- State rank
- #315 of 826 in TX
Livability — Denison
- Score
- 73/100
- State rank
- #221
- US rank
- #5428
Category grades
Schools grade is shown separately in the Schools card above.
Census & demographics
- Census place
- Denison, TX
- County
- Grayson County · 108,053 people
- City population
- 34,008
- Metro
- Sherman-Denison, TX
- Population (ZIP)
- 24,835
- Household income
- $71,605
- Rent vs Own
- Severe rent burden
- 997.0
Population outlook (Grayson County) Hauer SSP2
- Today (2025)
- 134,540 people
- By 2030
- 138,653 · +3.1%
- By 2040
- 145,958 · +8.5%
- By 2050
- 151,218 · +12.4%
- By 2075
- 161,802 · +20.3%
- By 2100
- 159,036 · +18.2%
Race, ethnicity, and origin ACS 2023
- Neighborhood character
- Predominantly White (73%)
- Race & ethnicity
- White 73% Hispanic / Latino 13% Two or more races 9% Black 6%
- Hispanic origin (detail)
- Mexican 11%
- Common ancestry
- Slovak 5% Serbian 2% Portuguese 2%
- Foreign-born
- 4% · Canada
- Languages at home
- 93% English-only · Spanish 6%
Political lean MEDSL · Grayson
- 2024 margin
- Solid R (+54.3) · D 22.5% · R 76.7%
- 2008→2024 swing
- -16.4pp toward R · 2008: -37.9pp · 2024: -54.3pp
- All cycles
- 2024: R+54.3 2020: R+49.9 2016: R+53.1 2012: R+48.0 2008: R+37.9
Not yet ingested
- Civics
- —
Market trends
- HPI YoY
- ▼ -295.96%
- Current HPI
- 257.1806
- Rent YoY
- ▬ 0.05%
- Metro
- Sherman-Denison, TX
- State GDP YoY
- ▲ 3.95%
- F500 in state
- 110
Industry mix (Fortune 500 HQ in TX)
| Industry | F500 HQs | Revenue |
|---|---|---|
| Energy | 16 | $1,198B |
|
||
| Technology | 5 | $198B |
|
||
| Engineering / Construction | 4 | $72B |
|
||
| Energy Services | 3 | $60B |
|
||
| Utilities | 3 | $41B |
|
||
| Healthcare | 2 | $330B |
|
||
Price history
-1.5% since first listed2 events — show timeline
- 2026-05-13 Price Changed $152,500 NTREIS
- 2025-11-18 Listed $154,900 NTREIS
Cash-flow waterfall
monthlySold comps — $/sqft
last 12 mo · ≤1 miLoading sold comps…