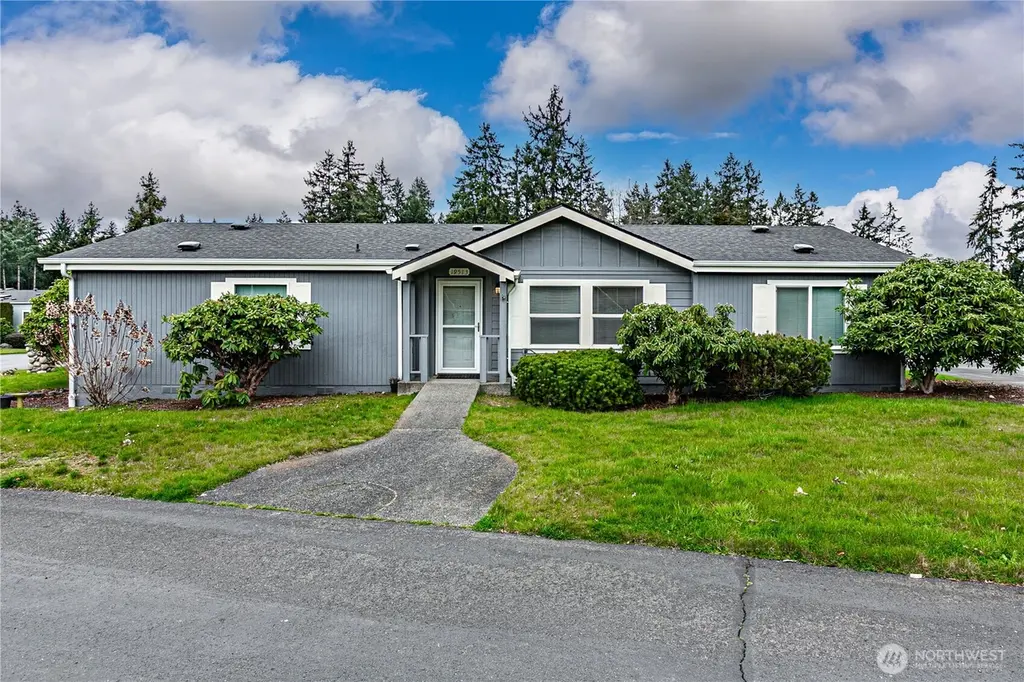
19513 100th Avenue Ct E #28 · Graham, WA
Flood risk 1/10 · Minimal
- FEMA flood zone
- X (unshaded)
- Chance of flooding over 30 yrs
- 0.0%
- Est. flood insurance / yr
- $507 – $1,088
Fire risk 1/10 · Minimal
- Est. fire insurance / yr
- $604 – $1,122
Heat risk 3/10 · Minor
- Hot days now (above 87°F)
- 7 days/yr
- Hot days in 30 yrs
- 15 days/yr
Wind risk 1/10 · Minimal
- Chance of severe wind over 30 yrs
- —
Air-quality risk 7/10 · Major
- Unhealthy air days now
- 10 days/yr
- Unhealthy air days in 30 yrs
- 10 days/yr
Risk factors via First Street. Map © Google.
Why this score? — see what drove the C- grade
The composite is a weighted blend of 9 inputs, each scored 0–100. Each bar is that input's sub-score; the figure is the points it added to the 100-point composite (weight × sub-score).
- Cash flow +19.0/30.0
- ARV discount +9.4/15.0
- DSCR +6.0/10.0
- Schools +4.9/10.0
- 1% rule +4.5/10.0
- Rent growth +3.3/5.0
- Livability +3.2/5.0
- Condition / age +2.5/5.0
- Appreciation +0.0/10.0
$315,000
🖨 Deal sheet 📄 Offer letter ✓ Due diligence
Listing remarks
Welcome to this beautifully updated 3 bedroom, 2 bath triple wide home in the highly desired Azalea Gardens 55+ gated community, perfectly situated on a premium corner lot. Designed with both comfort and style in mind, this spacious home offers an ideal layout for everyday living and effortless entertaining. Extensive upgrades provide true peace of mind, including a newer roof, new furnace, A/C, and water heater, along with updated flooring and newer interior and exterior paint. A new sprinkler system adds convenience, keeping the landscaping low-maintenance and vibrant year-round. Enjoy the expansive covered patios featuring skylights that fill the space with natural light, perfect for rel
Key facts
- Garage
- Built 2000
- Listed 34 days
Property features AI
Finance
- Other: Calculated living area: 1,857 sq ft; Listing status: Active
- Financial info: Listing terms: Cash or Conventional; Property type: Residential — Manufactured Home; Style: Manuf-Triple Wide
- HOA & community: Manufactured home park approved for sale; Senior community; Park amenities: Clubhouse, common area, RV parking, security gate; 97 homes in park; Land lease: $906
Exterior
- Parking: Individual garage
- Security: Security gate
- Utilities: Public water; Electric water heater (electric); Tacoma PUD power; Natural gas available; Sewer included in space rent
- Home design: Manufactured home (triple wide); One level; Tie down foundation; Has view; Very good condition; Model: Silverwood; Make: SILCR
- Construction: Wood construction materials; Composition roof
- Exterior features: Wood siding/wood products exterior; Patio/porch/deck; Landscaped; Paved lot
Interior
- Kitchen: Dishwasher; Stove/Range; Refrigerator
- Bedrooms: 3 bedrooms
- Flooring: Engineered hardwood
- Bathrooms: 2 full bathrooms; 1 bathtub; 2 showers
- Heating & cooling: Forced air heating; Central air; Heat pump
- Interior features: Water heater; Skylights; Vaulted ceilings; Ceiling fan(s); Double pane windows; Walk-in closet; Bath off primary; Family room; Kitchen with eating space; Living room; Utility room
- Laundry & utility: Washer; Dryer; Utility room
Neighborhood map
What this means for you Summary
Snapshot
- This is a 3-bed/2.0-bath manufactured listed at $315k.
Deal economics
- At list price, monthly cash flow is $331 ($4k/yr) — positive.
- The deal already cash-flows at list — no discount required.
- To meet the 1% rule (rent ≥ 1% of price), the offer needs to be $299k (5.1% below list).
- Recommended offer: $299k (5.1% below list) — sets the bar for 1% rule.
- Cap rate 7.6% vs local median 3.6% in Graham — top-decile yield for the area; either an underpriced asset or a hidden risk that comps aren't pricing in. Stress-test before assuming the spread holds.
Location & tenants
- Location reads 64/100 on livability (#373 in WA) — a middle-class / working-renter tenant base. Strengths: employment A+, housing A+; Watch: crime C-, health & safety C-, amenities F.
- Bethel School District (suburban): math 47% / reading 59% proficiency, ranked #103 of 291 in WA (top 35%) — acceptable for families but not a draw, mixed tenant base, ~2y average lease.
- Market conditions: Rents rising (+3.3%/yr); 232 active listings in the ZIP; 23 comparable units currently listed for rent nearby; rentals at typical pace (median 15d on market — plan ~3-4 weeks tenant-placement turnaround); high-income renter base; 3,209 units permitted in Pierce County in 2024 (1,269 in 5+ unit buildings).
- This rent runs 31% of the median local income ($115k/yr) — at the standard rent-burdened threshold; future hikes will face affordability resistance.
Forward outlook
- Local home prices are declining (-3.0%/yr); year-one equity from $2k of loan paydown is wiped out by about $9k of value loss. Plan a longer hold.
- Pierce County population projected at +26% by 2050 — long-run rental-demand tailwind backs the buy-and-hold thesis.
Negotiation context
- It's been on market 34 days — a 3% lower offer ($306k) is reasonable based on typical stale-listing flexibility.
- 2 sale attempts since 5y ago with the ask held roughly flat each time — persistent listings suggest the price (not the market) is what's stuck; bring a comps-based counter.
Questions for the listing agent
- It's been on market 34 days. Have you received any prior offers? Is the seller open to a 5% concession, seller financing, or rate buy-down credit?
- Is there a deadline driving the sale (1031 exchange, divorce, estate, relocation)? That informs how much negotiation room exists.
- What's the average days-on-market for RENTAL listings here right now (not sales)? A rising rental-DOM trend means longer vacancies and softer asking-rent achievability than the comps imply.
- What's the recent tenant-quality profile in this submarket — average credit score on applications, eviction rate, late-payment / NSF rate, and stable-employment percentage? A property-management company in the area should have these aggregated.
- How much new for-sale + rental construction is in the pipeline within 1–3 miles? Heavy new supply typically softens prices + rents 12–24 months out; constrained supply supports both.
Investment metrics
- 1% rule
- 0.95% ✗
- Cap rate
- 7.56%
- Cash-on-cash
- 4.51%
- DSCR
- 1.20
- GRM
- 8.8
CMA / ARV
- ARV (on-the-fly)
- $328,689
- Comps found
- 10
Show comp detail 10 sales within ~0.75 mi
| Address | Dist | Beds/Ba | Sqft | Sold | Price | $/sf | Match |
|---|---|---|---|---|---|---|---|
| 9911 196th Street Ct E | 0.12mi | 3/2.0 | 1,737 (-6%) | 2mo | $359,000 | $207 | 82 |
| 9903 E 195th Street Ct E | 0.11mi | 3/2.0 | 1,731 (-7%) | 9mo | $250,000 | $144 | 76 |
| 9903 197th St E | 0.13mi | 3/2.0 | 1,774 (-4%) | 14mo | $295,000 | $166 | 75 |
| 10511 196th Street Ct E | 0.29mi | 3/2.0 | 1,782 (-4%) | 8mo | $387,000 | $217 | 73 |
| 19423 100th Avenue Ct E | 0.07mi | 3/2.0 | 2,024 (+9%) | 12mo | $325,000 | $161 | 71 |
| 10509 197th St E | 0.29mi | 2/2.0 (-1) | 1,820 (-2%) | 9mo | $423,500 | $233 | 71 |
| 19126 98th Avenue Ct E | 0.27mi | 2/2.0 (-1) | 1,761 (-5%) | 9mo | $340,000 | $193 | 67 |
| 10016 197th St E #88 | 0.13mi | 2/2.0 (-1) | 2,024 (+9%) | 11mo | $320,000 | $158 | 65 |
| 9908 196th St E #50 | 0.11mi | 3/2.0 | 1,592 (-14%) | 12mo | $280,000 | $176 | 61 |
| 9817 197th St E | 0.17mi | 3/2.0 | 1,592 (-14%) | 24mo | $281,950 | $177 | 49 |
Match score weights: distance 35% · size 25% · config 20% · recency 20%. Top-matched comps best support the ARV.
Projected returns pro-forma
-3.0% appreciation · 3.32% rent growth · sell at horizon
- IRR
- -8.9%
- Equity multiple
- 0.67×
- Total profit
- $-29,014
- Equity at exit
- $46,968
- IRR
- 0.9%
- Equity multiple
- 1.06×
- Total profit
- $5,723
- Equity at exit
- $27,235
Cash invested: $88,200 (down + closing). Projections, not guarantees.
Landlord ↔ Tenant lean methodology
- Overall (STATE)
- 28 Tenant-Leaning
- State Washington
- 28 Tenant-Leaning · D+8
- County
- — inherits STATE
- City
- — inherits STATE
ZIP-level market 98338
- Rents YoY
- 3.3%
- Active inventory
- 232
- Price-to-rent
- 8.8×
Monthly cashflow live
- Estimated rent
- $2,991 high interval (Pro) →
- Mortgage (P&I)
- −$1,652
- Tax from tax record
- −$248 /mo · $2,976/yr
- Insurance
- −$131
- HOA
- −$0
- Vacancy / Maint / Mgmt
- −$628
- Net cashflow
- $331
Break-even live
UW: 25.0% down · 7.5% · 30yr · 1.5% tax · 5.0% vac · 8.0% maint · 8.0% mgmt
Financing live
Cash to close
- Down payment
- $78,750
- Closing costs
- $9,450
- Reserves months
- —
- Total cash needed
- —
Loan-product check · same deal, 3 products live
Conventional
25% down · 7.5% · 30yr
- Down + closing
- —
- Monthly P&I
- —
- Monthly cashflow
- —
- DSCR
- —
- Eligible?
- —
Personal DTI + credit; lowest rate.
DSCR
20% down · 8.5% · 30yr
- Down + closing
- —
- Monthly P&I
- —
- Monthly cashflow
- —
- DSCR
- —
- Eligible?
- —
No personal income docs; deal must DSCR.
Hard money
10% down · 12.0% · 12mo
- Down + closing
- —
- Monthly P&I
- —
- Monthly cashflow
- —
- DSCR
- —
- Eligible?
- —
Short-term bridge; refi at stabilization.
Rent comps 23 comps
| Address | Beds | Baths | Sqft | Rent | $/sqft | DOM | Units | Dist |
|---|---|---|---|---|---|---|---|---|
| 10234 194th St E Graham, WA | 2.0 | 1.0–2.5 | 1231 | $2,252 | $1.83 | 1d | 17 | 0.17mi |
| 19906 100th Avenue Ct E Graham, WA | 3.0 | 2.0 | 1322 | $2,749 | $2.08 | 16d | 1 | 0.24mi |
| 10508 196th Street Ct E Graham, WA | 3.0 | 2.0 | 2364 | $2,689 | $1.14 | 2d | 1 | 0.30mi |
| 18511 97th Ave E Puyallup, WA | 3.0 | 2.5 | 2104 | $2,895 | $1.38 | 18d | 1 | 0.65mi |
| 10110 184th St E Puyallup, WA | 3.0 | 2.5 | 1582 | $2,595 | $1.64 | 43d | 1 | 0.67mi |
| 10423 Rainier Ridge Blvd E Puyallup, WA | 1.0–3.0 | 1.0–2.0 | 1035 | $3,268 | $3.16 | 1d | 27 | 0.71mi |
| 18709 107th Ln E Puyallup, WA | 4.0 | 2.5 | 2297 | $3,500 | $1.52 | 24d | 1 | 0.73mi |
| 18709 107th Ln E Puyallup, WA | 4.0 | 2.5 | 2305 | $3,600 | $1.56 | 20d | 1 | 0.73mi |
| 18709 107th Ln E Puyallup, WA | 4.0 | 2.5 | 2297 | $3,500 | $1.52 | 20d | 1 | 0.73mi |
| 18402 96th Ave E South Hill, WA | 4.0 | 2.5 | 2300 | $1,700 | $0.74 | 11d | 1 | 0.73mi |
| 18402 96th Ave E South Hill, WA | 4.0 | 2.5 | 2307 | $1,400 | $0.61 | 12d | 1 | 0.73mi |
| 18317 96th Ave E Puyallup, WA | 4.0 | 2.5 | 2150 | $5,500 | $2.56 | 43d | 1 | 0.74mi |
| 18747 108th Ave E Puyallup, WA | 4.0 | 2.0 | 1900 | $3,200 | $1.68 | 1d | 1 | 0.85mi |
| 18702 108th Ave E Puyallup, WA | 4.0 | 2.5 | 1833 | $3,100 | $1.69 | 1d | 1 | 0.85mi |
| 18744 110th Ave E Unit NA Puyallup, WA | 4.0 | 2.5 | 1824 | $3,189 | $1.75 | 24d | 1 | 0.89mi |
| 19605 84th Ave E Spanaway, WA | 3.0 | 2.5 | 1916 | $3,050 | $1.59 | 24d | 1 | 0.99mi |
| 18225 113th Ave E Puyallup, WA | 3.0 | 2.5 | 1770 | $2,675 | $1.51 | 15d | 1 | 1.11mi |
| 11420 184th Street Ct E Puyallup, WA | 3.0 | 2.0 | 1554 | $1,700 | $1.09 | 16d | 1 | 1.15mi |
| 11328 185th St E Puyallup, WA | 4.0 | 2.0 | 2430 | $2,995 | $1.23 | 1d | 1 | 1.16mi |
| 11621 189th St E Puyallup, WA | 3.0 | 2.5 | 1861 | $2,595 | $1.39 | 16d | 1 | 1.21mi |
| 9110 178th Street Ct E Puyallup, WA | 4.0 | 3.0 | 2321 | $3,195 | $1.38 | 15d | 1 | 1.21mi |
| 18606 116th Ave E Puyallup, WA | 3.0 | 3.0 | 2049 | $2,250 | $1.10 | 15d | 1 | 1.22mi |
| 20519 80th Ave E Spanaway, WA | 4.0 | 2.5 | 2031 | $2,925 | $1.44 | 5d | 1 | 1.43mi |
Listing history 5 events
-
2026-05-22status Pending
-
2026-04-17$315,000 Active
-
2021-09-01soldstatus $280,000 Closed
-
2021-08-10status Pending
-
2021-08-07$280,000 Active
ⓘ Source: listings_history table (triggers on properties + properties_extension) + one-shot
backfill from property_details.listing_events for pre-trigger history.
Tax reassessment forecast WA · Resets to sale price
- Current annual tax
- $2,976 · $248/mo
- Projected year-2 tax
- $3,087 · $257/mo
- Expected delta
- +$111/yr (+$9/mo · 3.7%)
ⓘ Screening estimate from a state-policy table — verify with the county assessor before closing.
Climate risk First Street
- Flood 1/10 Low FEMA zone X (unshaded) · 0% chance over 30 yrs
- Wildfire 1/10 Low
- Heat 3/10 Moderate 7 d/yr ≥87°F today · 15 d/yr by 30 yrs out
- Wind 1/10 Low
- Air quality 7/10 Severe 10 unhealthy d/yr today · 10 by 30 yrs out
Nearby sold comps map
Loading sold comps map…
Walkable amenities ~0.75 mi
Loading nearby amenities…
Taxation est. · year 1
- Rental income
- $35,887
- − Mortgage interest
- −$17,645
- − Property taxes
- −$2,976
- − Insurance
- −$1,575
- − Repairs & maintenance
- −$2,871
- − Management
- −$2,871
- − Depreciation
- −$9,164
- Taxable loss
- −$1,215
- Est. tax savings @ 24.0%
- +$291
- After-tax cash flow
- $4,268/yr
For passive investors: Depreciation is non-cash, so a rental often shows a tax loss while cash-flowing — sheltering income. Rental losses are passive: they offset passive income freely, and up to $25,000/yr can offset ordinary (W-2) income if you actively participate and your MAGI is under $100k (phasing out to $0 by $150k); unused losses carry forward. On sale, claimed depreciation is recaptured at up to 25%, and gains may owe capital-gains tax (a 1031 exchange can defer both). Figures are a year-1 estimate at your 24.0% rate — not tax advice; consult a CPA.
Schools (NCES district)
- District
- Bethel School District
- NCES district ID
- 5300480
- Math proficiency
- 47% ▬ 0.00%
- Reading proficiency
- 59% ▲ 2.00%
- Median HH income
- $65,872
- Composite
- 48.66/100
- National rank
- #4568
- State rank
- #103 of 291 in WA
Livability — Graham
- Score
- 64/100
- State rank
- #373
- US rank
- #14219
Category grades
Schools grade is shown separately in the Schools card above.
Census & demographics
- Census place
- Graham, WA
- County
- Pierce County · 788,257 people
- City population
- 32,687
- Metro
- Seattle-Tacoma-Bellevue, WA
- Population (ZIP)
- 32,687
- Household income
- $114,819
- Rent vs Own
- Severe rent burden
- 236.0
Population outlook (Pierce County) Hauer SSP2
- Today (2025)
- 956,648 people
- By 2030
- 1,010,862 · +5.7%
- By 2040
- 1,113,170 · +16.4%
- By 2050
- 1,206,524 · +26.1%
- By 2075
- 1,436,425 · +50.2%
- By 2100
- 1,563,654 · +63.5%
Race, ethnicity, and origin ACS 2023
- Neighborhood character
- Predominantly White (71%)
- Race & ethnicity
- White 71% Two or more races 15% Hispanic / Latino 12% Asian 3% Black 3% Pacific Islander 2% Native American 1%
- Hispanic origin (detail)
- Mexican 7%
- Common ancestry
- Italian 4% Portuguese 4% Iranian 3%
- Foreign-born
- 7% · Canada, South Korea, China
- Languages at home
- 88% English-only · Spanish 5% Russian/Polish/Slavic 2% Other Asian/Pacific 1%
Political lean MEDSL · Pierce
- 2024 margin
- D (+10.8) · D 53.9% · R 43.1% · Other 3.0%
- 2008→2024 swing
- -1.4pp toward R · 2008: 12.2pp · 2024: 10.8pp
- All cycles
- 2024: D+10.8 2020: D+11.2 2016: D+7.5 2012: D+11.0 2008: D+12.2
Not yet ingested
- Civics
- —
Market trends
- HPI YoY
- ▼ -501.28%
- Current HPI
- 304.4241
- Rent YoY
- ▲ 3.32%
- Metro
- Seattle-Tacoma-Bellevue, WA
- State GDP YoY
- ▲ 4.65%
- F500 in state
- 22
Industry mix (Fortune 500 HQ in WA)
| Industry | F500 HQs | Revenue |
|---|---|---|
| Retail | 2 | $269B |
|
||
| Technology / Retail | 1 | $638B |
|
||
| Technology | 1 | $245B |
|
||
| Telecommunications | 1 | $38B |
|
||
| Food / Beverage | 1 | $36B |
|
||
| Automotive / Trucks | 1 | $34B |
|
||
Price history
+12.5% since first listed5 events — show timeline
- 2026-05-22 Pending — NWMLS as Distributed by MLS Grid
- 2026-04-17 Listed $315,000 NWMLS as Distributed by MLS Grid
- 2021-09-01 Sold (MLS) $280,000 NWMLS as Distributed by MLS Grid
- 2021-08-10 Pending — NWMLS as Distributed by MLS Grid
- 2021-08-07 Listed $280,000 NWMLS as Distributed by MLS Grid
Property tax history
+3.7%/yrLatest (2026): $2,976 · +4.8% YoY. Source: county tax records.
Cash-flow waterfall
monthlySold comps — $/sqft
last 12 mo · ≤1 miLoading sold comps…