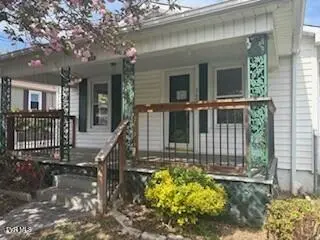
569 Vance St · Bristol, VA
Flood risk 5/10 · Moderate
- FEMA flood zone
- X (unshaded)
- Chance of flooding over 30 yrs
- 0.24%
- Est. flood insurance / yr
- $473 – $860
Fire risk 4/10 · Minor
- Est. fire insurance / yr
- $666 – $1,236
Heat risk 4/10 · Minor
- Hot days now (above 98°F)
- 8 days/yr
- Hot days in 30 yrs
- 22 days/yr
Wind risk 2/10 · Minimal
- Chance of severe wind over 30 yrs
- —
Air-quality risk 2/10 · Minimal
- Unhealthy air days now
- 1 days/yr
- Unhealthy air days in 30 yrs
- 2 days/yr
Risk factors via First Street. Map © Google.
Why this score? — see what drove the B grade
The composite is a weighted blend of 9 inputs, each scored 0–100. Each bar is that input's sub-score; the figure is the points it added to the 100-point composite (weight × sub-score).
- Cash flow +30.0/30.0
- 1% rule +10.0/10.0
- DSCR +10.0/10.0
- ARV discount +7.5/15.0
- Schools +5.2/10.0
- Livability +3.7/5.0
- Rent growth +2.5/5.0
- Condition / age +2.5/5.0
- Appreciation +0.0/10.0
$80,000
🖨 Deal sheet 📄 Offer letter ✓ Due diligence
Listing remarks MLS
Cute as a ''button''. Extra special. Newer HP, carpet, 200 amp box, all appliances included.
Key facts
- Built 1929
- Listed 9 days
Property features AI
Exterior
- Utilities: Public water; Public sewer
- Home design: Single-family residential house; Residential zoning
- Construction: Vinyl siding; Other construction materials
- Exterior features: Level topography; Other-type roof
Interior
- Bathrooms: One full bathroom; One half bathroom
- Heating & cooling: Heat pump for heating; Heat pump for cooling
- Interior features: Five total rooms
Neighborhood map
What this means for you Summary
Snapshot
- This is a 2-bed/1.5-bath single-family listed at $80k.
Deal economics
- At list price, monthly cash flow is $558 ($7k/yr) — positive.
- The deal already cash-flows at list — no discount required.
- Meets the 1% rule at list price ($1k rent vs $80k).
- Cap rate 14.7% vs local median 4.9% in Bristol — top-decile yield for the area; either an underpriced asset or a hidden risk that comps aren't pricing in. Stress-test before assuming the spread holds.
Location & tenants
- Location reads 74/100 on livability (#140 in VA, #4,544 nationally) — a middle-class / working-renter tenant base. Strengths: cost of living A+, housing A+, health & safety A+; Watch: crime F, commute F, employment F.
- Bristol City Public School District (urban): math 57% / reading 70% proficiency, ranked #53 of 131 in VA (top 40%) — acceptable for families but not a draw, mixed tenant base, ~2y average lease.
- Zoned schools: Virginia Middle (math 56% / reading 71%, grade B+, #128 of 342 statewide, top 39%, 487 students, 101% FRL); Virginia High (math 62% / reading 77%, grade B, #159 of 319 statewide, top 53%, 637 students, 100% FRL) — zoned schools average 100% FRL vs 58% district-wide (42 pts higher); higher-poverty schools than district average — tighter screening recommended.
- Market conditions: 156 active listings in the ZIP; 6 comparable units currently listed for rent nearby; rentals lingering (median 44d on market — plan ~5-8 weeks vacancy on turnover, expect pricing pressure); 50% of comp listings sitting > 30 days — soft ceiling on asking rent; 15 units permitted in Bristol city in 2024 (5 in 5+ unit buildings).
Forward outlook
- Local home prices are declining (-3.0%/yr); year-one equity from $553 of loan paydown is wiped out by about $2k of value loss. Plan a longer hold.
- Bristol County population projected at -20% by 2050 — secular population decline; favor cash flow + early exit over multi-decade hold.
- At projected returns (-3.0% appreciation + 3.0% rent growth), your $22k cash investment doubles in ~5 years — after that, you're playing with house money.
Negotiation context
- Only 9 days on market — expect competitive offers; lowballing is unlikely to land.
- 2 sale attempts since 5y ago with the ask held roughly flat each time — persistent listings suggest the price (not the market) is what's stuck; bring a comps-based counter.
Risks & watch-outs
- Watch-outs: built in 1929 — expect roof / HVAC / electrical / plumbing capex.
- Climate carrying-cost: moderate flood risk — expect insurance premiums to compound above CPI over the hold.
Questions for the listing agent
- Built in 1929 — when were the roof, HVAC, electrical panel, plumbing, and water heater last replaced?
- Is there a deadline driving the sale (1031 exchange, divorce, estate, relocation)? That informs how much negotiation room exists.
- Schools are A-rated — typically a magnet for longer-tenancy family renters. What's the average tenant stay here, and is there a school-zone premium baked into asking?
- Crime grade is F in this area — have there been break-ins, vandalism, or insurance claims at this property in the last 3 years? What carrier currently insures it and at what premium?
- What's the average days-on-market for RENTAL listings here right now (not sales)? A rising rental-DOM trend means longer vacancies and softer asking-rent achievability than the comps imply.
- What's the recent tenant-quality profile in this submarket — average credit score on applications, eviction rate, late-payment / NSF rate, and stable-employment percentage? A property-management company in the area should have these aggregated.
- How much new for-sale + rental construction is in the pipeline within 1–3 miles? Heavy new supply typically softens prices + rents 12–24 months out; constrained supply supports both.
Investment metrics
- 1% rule
- 1.67% ✓
- Cap rate
- 14.66%
- Cash-on-cash
- 29.87%
- DSCR
- 2.33
- GRM
- 5.0
CMA / ARV
- ARV (median comp)
- $164,474
- List price
- $80,000
- Delta
- -51.36%
- Verdict
- UNDERPRICED
- Comps
- 20 within 1.0 mi
Show comp detail 12 sales within ~0.75 mi
| Address | Dist | Beds/Ba | Sqft | Sold | Price | $/sf | Match |
|---|---|---|---|---|---|---|---|
| 401 Crockett St | 0.09mi | 3/1.0 (+1) | 912 (-3%) | 6mo | $172,500 | $189 | 78 |
| 329 Magnolia Dr | 0.44mi | 2/1.0 | 945 (+0%) | 1mo | $144,000 | $152 | 76 |
| 416 Randolph St | 0.41mi | 2/1.0 | 962 (+2%) | 2mo | $205,000 | $213 | 74 |
| 2125 Randolph St | 0.20mi | 2/1.0 | 871 (-8%) | 3mo | $135,000 | $155 | 74 |
| 533 Spurgeon Ln | 0.75mi | 2/1.0 | 936 (-1%) | 4mo | $150,000 | $160 | 58 |
| 21 16th St | 0.67mi | 2/1.0 | 991 (+5%) | 0mo | $208,500 | $210 | 58 |
| 103 Carson Ln | 0.72mi | 3/1.0 (+1) | 943 (-0%) | 3mo | $165,000 | $175 | 57 |
| 276 Spurgeon Ln | 0.71mi | 2/1.0 | 911 (-4%) | 9mo | $60,000 | $66 | 52 |
| 2117 Westfield St | 0.26mi | 3/1.0 (+1) | 1,069 (+13%) | 9mo | $218,000 | $204 | 52 |
| 1821 Broad St | 0.69mi | 2/1.0 | 864 (-8%) | 3mo | $167,500 | $194 | 49 |
| 115 16th St | 0.73mi | 2/1.0 | 827 (-12%) | 1mo | $180,000 | $218 | 42 |
| 2005 Bay St | 0.66mi | 3/1.0 (+1) | 1,064 (+13%) | 1mo | $145,000 | $136 | 40 |
Match score weights: distance 35% · size 25% · config 20% · recency 20%. Top-matched comps best support the ARV.
Projected returns pro-forma
-3.0% appreciation · 3.0% rent growth · sell at horizon
- IRR
- 24.4%
- Equity multiple
- 2.01×
- Total profit
- $22,537
- Equity at exit
- $11,928
- IRR
- 32.2%
- Equity multiple
- 3.92×
- Total profit
- $65,302
- Equity at exit
- $6,917
Cash invested: $22,400 (down + closing). Projections, not guarantees.
Landlord ↔ Tenant lean methodology
- Overall (STATE)
- 55 Moderately Landlord-Leaning
- State Virginia
- 55 Moderately Landlord-Leaning · D+2
- County
- — inherits STATE
- City
- — inherits STATE
ZIP-level market 24201
- Active inventory
- 156
- Price-to-rent
- 5.0×
Monthly cashflow live
- Estimated rent
- $1,337 high interval (Pro) →
- Mortgage (P&I)
- −$420
- Tax from tax record
- −$46 /mo · $554/yr
- Insurance
- −$33
- HOA
- −$0
- Vacancy / Maint / Mgmt
- −$281
- Net cashflow
- $558
Break-even live
UW: 25.0% down · 7.5% · 30yr · 1.5% tax · 5.0% vac · 8.0% maint · 8.0% mgmt
Financing live
Cash to close
- Down payment
- $20,000
- Closing costs
- $2,400
- Reserves months
- —
- Total cash needed
- —
Loan-product check · same deal, 3 products live
Conventional
25% down · 7.5% · 30yr
- Down + closing
- —
- Monthly P&I
- —
- Monthly cashflow
- —
- DSCR
- —
- Eligible?
- —
Personal DTI + credit; lowest rate.
DSCR
20% down · 8.5% · 30yr
- Down + closing
- —
- Monthly P&I
- —
- Monthly cashflow
- —
- DSCR
- —
- Eligible?
- —
No personal income docs; deal must DSCR.
Hard money
10% down · 12.0% · 12mo
- Down + closing
- —
- Monthly P&I
- —
- Monthly cashflow
- —
- DSCR
- —
- Eligible?
- —
Short-term bridge; refi at stabilization.
Rent comps 6 comps
| Address | Beds | Baths | Sqft | Rent | $/sqft | DOM | Units | Dist |
|---|---|---|---|---|---|---|---|---|
| 308 Emerald Dr Unit 308 Bristol, VA | 2.0 | 1.5 | 970 | $1,200 | $1.24 | 44d | 1 | 0.25mi |
| 1136 Moorland Ave Bristol, VA | 2.0 | 1.0 | 936 | $1,250 | $1.34 | 44d | 1 | 0.30mi |
| 2505 Catherine St Bristol, VA | 2.0 | 1.0 | 849 | $1,600 | $1.88 | 13d | 1 | 0.43mi |
| 2114 Broad St Bristol, TN | 2.0 | 1.0 | 1000 | $1,600 | $1.60 | 13d | 1 | 0.84mi |
| 235 Carson Ct Bristol, TN | 1.0 | 1.0 | 800 | $850 | $1.06 | 44d | 1 | 0.85mi |
| 816 Goode St Bristol, VA | 1.0 | 1.0 | 822 | $2,000 | $2.43 | 13d | 1 | 1.23mi |
Listing history 7 events
-
2026-05-14status Pending 375-char remark
-
2026-05-05$80,000 Active 375-char remark
-
2026-04-08soldstatus $147,088
-
2021-10-19soldstatus $130,000
-
2021-10-15soldstatus $130,000 92-char remark
Show marketing remark (92 chars)
Cute as a ''button''. Extra special. Newer HP, carpet, 200 amp box, all appliances included.
-
2021-08-23$125,000 92-char remark
Show marketing remark (92 chars)
Cute as a ''button''. Extra special. Newer HP, carpet, 200 amp box, all appliances included.
-
1998-07-07soldstatus $52,500
ⓘ Source: listings_history table (triggers on properties + properties_extension) + one-shot
backfill from property_details.listing_events for pre-trigger history.
Tax reassessment forecast VA · Resets to sale price
- Current annual tax
- $554 · $46/mo
- Projected year-2 tax
- $656 · $55/mo
- Expected delta
- +$102/yr (+$9/mo · 18.5%)
ⓘ Screening estimate from a state-policy table — verify with the county assessor before closing.
Climate risk First Street
- Flood 5/10 Major FEMA zone X (unshaded) · 24% chance over 30 yrs
- Wildfire 4/10 Moderate
- Heat 4/10 Moderate 8 d/yr ≥98°F today · 22 d/yr by 30 yrs out
- Wind 2/10 Low
- Air quality 2/10 Low 1 unhealthy d/yr today · 2 by 30 yrs out
Nearby sold comps map
Loading sold comps map…
Walkable amenities ~0.75 mi
Loading nearby amenities…
Taxation est. · year 1
- Rental income
- $16,050
- − Mortgage interest
- −$4,481
- − Property taxes
- −$554
- − Insurance
- −$400
- − Repairs & maintenance
- −$1,284
- − Management
- −$1,284
- − Depreciation
- −$2,327
- Taxable income
- $5,719
- Est. tax owed @ 24.0%
- −$1,373
- After-tax cash flow
- $5,318/yr
For passive investors: Depreciation is non-cash, so a rental often shows a tax loss while cash-flowing — sheltering income. Rental losses are passive: they offset passive income freely, and up to $25,000/yr can offset ordinary (W-2) income if you actively participate and your MAGI is under $100k (phasing out to $0 by $150k); unused losses carry forward. On sale, claimed depreciation is recaptured at up to 25%, and gains may owe capital-gains tax (a 1031 exchange can defer both). Figures are a year-1 estimate at your 24.0% rate — not tax advice; consult a CPA.
Schools (NCES district)
- District
- Bristol City Public School District
- NCES district ID
- 5100450
- Math proficiency
- 57% ▼ -24.00%
- Reading proficiency
- 70% ▼ -6.00%
- Median HH income
- $33,978
- Composite
- 52.4/100
- National rank
- #1579
- State rank
- #53 of 131 in VA
Livability — Bristol
- Score
- 74/100
- State rank
- #140
- US rank
- #4544
Category grades
Schools grade is shown separately in the Schools card above.
Census & demographics
- Census place
- Bristol, VA
- City population
- 16,039
- Population (ZIP)
- 16,039
Population outlook (Bristol County) Hauer SSP2
- Today (2025)
- 16,113 people
- By 2030
- 15,510 · -3.7%
- By 2040
- 14,121 · -12.4%
- By 2050
- 12,847 · -20.3%
- By 2075
- 9,870 · -38.7%
- By 2100
- 7,883 · -51.1%
Race, ethnicity, and origin ACS 2023
- Neighborhood character
- Predominantly White (85%)
- Race & ethnicity
- White 85% Black 7% Two or more races 6% Hispanic / Latino 3%
- Common ancestry
- Slovak 4% Serbian 1% Iranian 0%
- Foreign-born
- 1% · Canada
- Languages at home
- 98% English-only · Spanish 2%
Political lean MEDSL · Bristol
- 2024 margin
- Solid R (+39.7) · D 29.8% · R 69.5%
- 2008→2024 swing
- -13.6pp toward R · 2008: -26.0pp · 2024: -39.7pp
- All cycles
- 2024: R+39.7 2020: R+38.9 2016: R+43.8 2012: R+31.1 2008: R+26.0
Not yet ingested
- Civics
- —
Market trends
- HPI YoY
- ▼ -206.40%
- Current HPI
- 196.2099
- Rent YoY
- —
- Metro
- —
- State GDP YoY
- ▲ 2.40%
- F500 in state
- 50
Industry mix (Fortune 500 HQ in VA)
| Industry | F500 HQs | Revenue |
|---|---|---|
| Aerospace / Defense | 4 | $236B |
|
||
| Technology / Defense | 3 | $32B |
|
||
| Financial Services | 2 | $176B |
|
||
| Utilities | 2 | $27B |
|
||
| Insurance | 2 | $25B |
|
||
| Technology | 2 | $15B |
|
||
Price history
+52.4% since first listed7 events — show timeline
- 2026-05-14 Pending — TVRMLS
- 2026-05-05 Listed $80,000 TVRMLS
- 2026-04-08 Sold (Public Records) $147,088 Public Records
- 2021-10-19 Sold (Public Records) $130,000 Public Records
- 2021-10-15 Sold (MLS) $130,000 TVRMLS
- 2021-08-23 Listed $125,000 TVRMLS
- 1998-07-07 Sold (Public Records) $52,500 Public Records
Cash-flow waterfall
monthlySold comps — $/sqft
last 12 mo · ≤1 miLoading sold comps…