 🏗️ New Construction
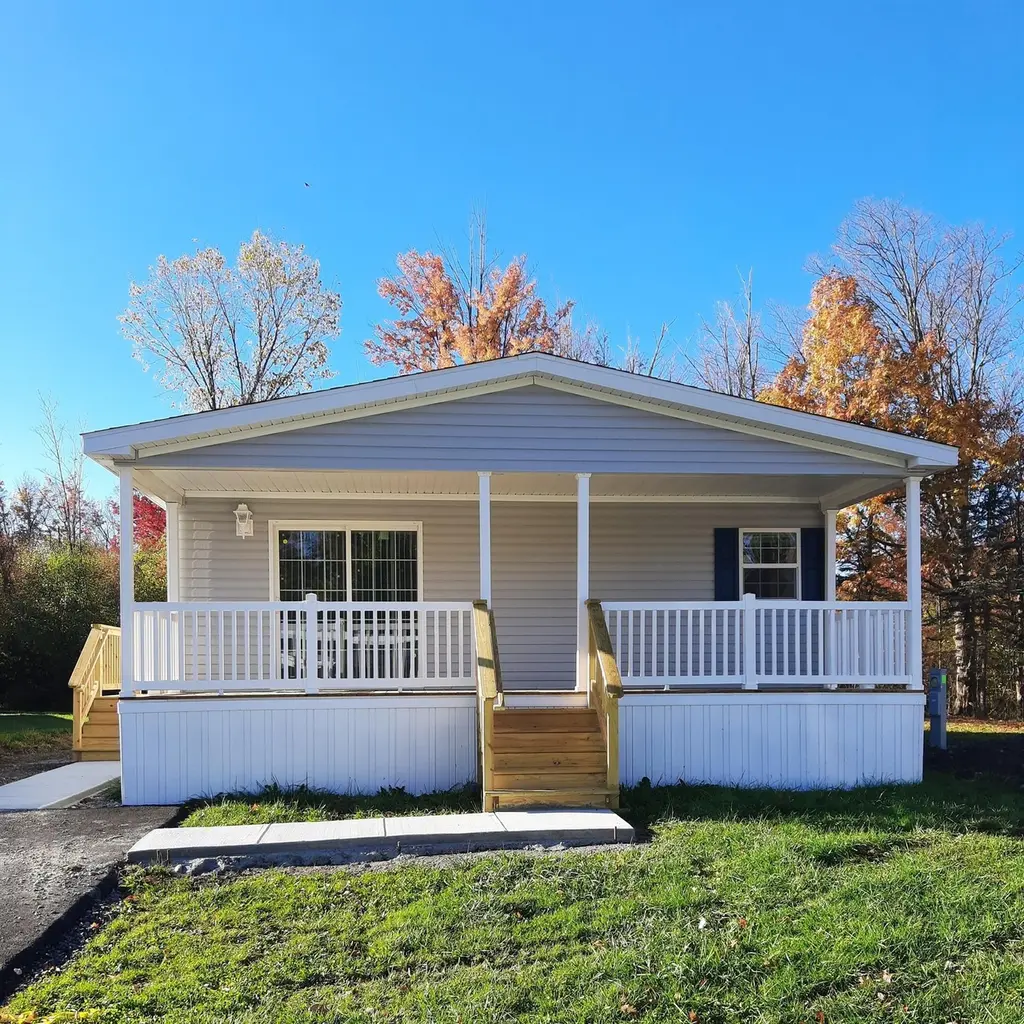
Mansion 188 Waterfalls Village Plan · Wanakah, NY
Flood risk 1/10 · Minimal
- FEMA flood zone
- X (unshaded)
- Chance of flooding over 30 yrs
- 0.0%
- Est. flood insurance / yr
- $507 – $1,088
Fire risk 1/10 · Minimal
- Est. fire insurance / yr
- $691 – $1,283
Heat risk 2/10 · Minimal
- Hot days now (above 93°F)
- 7 days/yr
- Hot days in 30 yrs
- 15 days/yr
Wind risk 1/10 · Minimal
- Chance of severe wind over 30 yrs
- —
Air-quality risk 4/10 · Minor
- Unhealthy air days now
- 4 days/yr
- Unhealthy air days in 30 yrs
- 9 days/yr
Risk factors via First Street. Map © Google.
Why this score? — see what drove the B grade
The composite is a weighted blend of 9 inputs, each scored 0–100. Each bar is that input's sub-score; the figure is the points it added to the 100-point composite (weight × sub-score).
- Cash flow +30.0/30.0
- 1% rule +10.0/10.0
- DSCR +10.0/10.0
- ARV discount +7.5/15.0
- Schools +4.7/10.0
- Condition / age +4.0/5.0
- Rent growth +3.8/5.0
- Livability +3.5/5.0
- Appreciation +0.0/10.0
$160,300
🖨 Deal sheet (PDF) 📄 Offer letter ✓ Due diligence
Listing remarks MLS
Beautiful front covered porch with sliding glass doors. 3 bedrooms 2 bathroom Coming soon
Key facts
- Front covered porch
- Sliding glass doors
- Listed 173 days
Tags
Neighborhood map
What this means for you Summary
Snapshot
- This is a 3-bed/2.0-bath manufactured listed at $160k. Condition is rated good.
Deal economics
- At list price, monthly cash flow is $834 ($10k/yr) — positive.
- The deal already cash-flows at list — no discount required.
- Meets the 1% rule at list price ($2k rent vs $160k).
- Recommended offer: $141k (12.0% below list) — sets the bar for market timing.
- Cap rate 18.9% vs local median 3.1% in Wanakah — top-decile yield for the area; either an underpriced asset or a hidden risk that comps aren't pricing in. Stress-test before assuming the spread holds.
Location & tenants
- Location reads 69/100 on livability (#508 in NY) — a middle-class / working-renter tenant base. Strengths: employment A+, housing A+, crime B+; Watch: amenities F, commute F, health & safety F.
- Frontier Central School District (suburban): math 54% / reading 55% proficiency, ranked #301 of 590 in NY (top 51%) — acceptable for families but not a draw, mixed tenant base, ~2y average lease; only 20% free/reduced lunch — higher-income household profile.
- Zoned schools: Big Tree Elementary School (math 42% / reading 57%, grade D, #1,085 of 2,108 statewide, top 56%, 540 students, 38% FRL); Frontier Middle School (math 38% / reading 53%, grade D+, #337 of 729 statewide, top 47%, 1,071 students, 34% FRL); Frontier Senior High School (math 97% / reading 95%, grade A+, #68 of 1,100 statewide, top 6%, 1,352 students, 31% FRL).
- Market conditions: Rents rising fast (+5.2%/yr); 264 active listings in the ZIP; 2 comparable units currently listed for rent nearby; solid renter incomes; 1,244 units permitted in Erie County in 2024 (563 in 5+ unit buildings).
Forward outlook
- Local home prices are declining (-3.0%/yr); year-one equity from $549 of loan paydown is wiped out by about $2k of value loss. Plan a longer hold.
- At projected returns (-3.0% appreciation + 5.2% rent growth), your $22k cash investment doubles in ~3 years — after that, you're playing with house money.
Negotiation context
- It's been on market 173 days — a 12% lower offer ($141k) is reasonable based on typical stale-listing flexibility.
Questions for the listing agent
- It's been on market 173 days. Have you received any prior offers? Is the seller open to a 12% concession, seller financing, or rate buy-down credit?
- Why hasn't it sold? Are there any deal-killer items the seller is aware of (foundation, flood, title, zoning, code violations)?
- Is there a deadline driving the sale (1031 exchange, divorce, estate, relocation)? That informs how much negotiation room exists.
- What's the average days-on-market for RENTAL listings here right now (not sales)? A rising rental-DOM trend means longer vacancies and softer asking-rent achievability than the comps imply.
- What's the recent tenant-quality profile in this submarket — average credit score on applications, eviction rate, late-payment / NSF rate, and stable-employment percentage? A property-management company in the area should have these aggregated.
- How much new for-sale + rental construction is in the pipeline within 1–3 miles? Heavy new supply typically softens prices + rents 12–24 months out; constrained supply supports both.
Investment metrics
- 1% rule
- 2.20% ✓
- Cap rate
- 18.89%
- Cash-on-cash
- 44.99%
- DSCR
- 3.00
- GRM
- 3.8
CMA / ARV
- ARV (median comp)
- $79,478
- List price
- $160,300
- Delta
- 101.69%
- Verdict
- OVERPRICED
- Comps
- 10 within 1.0 mi
Show comp detail 10 sales within ~0.75 mi
| Address | Dist | Beds/Ba | Sqft | Sold | Price | $/sf | Match |
|---|---|---|---|---|---|---|---|
| 74 Waterview Pkwy | 0.36mi | 2/1.0 (-1) | 1,452 (-0%) | 5mo | $80,000 | $55 | 69 |
| 40 Brookridge Dr | 0.56mi | 3/2.0 | 1,456 (0%) | 7mo | $75,000 | $52 | 68 |
| 15 Waterview Pkwy | 0.52mi | 3/2.0 | 1,456 (0%) | 14mo | $54,900 | $38 | 64 |
| 38 Highridge Ter | 0.38mi | 2/2.0 (-1) | 1,392 (-4%) | 16mo | $48,500 | $35 | 57 |
| 47 Waterview Pkwy | 0.37mi | 2/1.0 (-1) | 1,350 (-7%) | 13mo | $70,000 | $52 | 51 |
| 24 W Canyon Dr | 0.55mi | 3/2.0 | 1,352 (-7%) | 15mo | $103,000 | $76 | 50 |
| 37 Brookridge Dr | 0.74mi | 3/2.0 | 1,352 (-7%) | 8mo | $77,700 | $57 | 47 |
| 1 N Roxbury Dr | 0.66mi | 3/2.0 | 1,372 (-6%) | 17mo | $48,000 | $35 | 46 |
| 7 Jean Dr | 0.50mi | 3/2.0 | 1,274 (-12%) | 16mo | $55,000 | $43 | 43 |
| 6 Brush Dr | 0.56mi | 3/2.0 | 1,320 (-9%) | 20mo | $35,000 | $27 | 41 |
Match score weights: distance 35% · size 25% · config 20% · recency 20%. Top-matched comps best support the ARV.
Projected returns pro-forma
-3.0% appreciation · 5.21% rent growth · sell at horizon
- IRR
- 44.6%
- Equity multiple
- 2.99×
- Total profit
- $44,265
- Equity at exit
- $11,850
- IRR
- 51.5%
- Equity multiple
- 6.58×
- Total profit
- $124,164
- Equity at exit
- $6,872
Cash invested: $22,254 (down + closing). Projections, not guarantees.
Landlord ↔ Tenant lean methodology
- Overall (STATE)
- 15 Strongly Tenant-Friendly
- State New York
- 15 Strongly Tenant-Friendly · D+10
- County
- — inherits STATE
- City
- — inherits STATE
ZIP-level market 14075
- Rents YoY
- 5.2%
- Active inventory
- 264
- Price-to-rent
- 7.6×
Monthly cashflow live
- Estimated rent
- $1,751 medium interval (Pro) →
- Mortgage (P&I)
- −$417
- Tax est. 1.5%
- −$99 /mo · $1,192/yr
- Insurance
- −$33
- HOA
- −$0
- Vacancy / Maint / Mgmt
- −$368
- Net cashflow
- $834
Break-even live
Sensitivity live
| Price | -10% $889 | -5% $862 | +0% $834 | +5% $807 | +10% $779 |
|---|---|---|---|---|---|
| Rent | -10% $696 | -5% $765 | +0% $834 | +5% $903 | +10% $973 |
| Rate | -1.0pp $874 | -0.5pp $855 | base $834 | +0.5pp $814 | +1.0pp $793 |
UW: 25.0% down · 7.5% · 30yr · 1.5% tax · 5.0% vac · 8.0% maint · 8.0% mgmt
Financing live
Cash to close
- Down payment
- $19,869
- Closing costs
- $2,384
- Reserves months
- —
- Total cash needed
- —
Loan-product check · same deal, 3 products live
Conventional
25% down · 7.5% · 30yr
- Down + closing
- —
- Monthly P&I
- —
- Monthly cashflow
- —
- DSCR
- —
- Eligible?
- —
Personal DTI + credit; lowest rate.
DSCR
20% down · 8.5% · 30yr
- Down + closing
- —
- Monthly P&I
- —
- Monthly cashflow
- —
- DSCR
- —
- Eligible?
- —
No personal income docs; deal must DSCR.
Hard money
10% down · 12.0% · 12mo
- Down + closing
- —
- Monthly P&I
- —
- Monthly cashflow
- —
- DSCR
- —
- Eligible?
- —
Short-term bridge; refi at stabilization.
Rent comps 2 comps
| Address | Beds | Baths | Sqft | Rent | $/sqft | DOM | Units | Dist |
|---|---|---|---|---|---|---|---|---|
| 4819 Southwestern Blvd Hamburg, NY | 2.0 | 2.0 | 1170 | $2,055 | $1.76 | 3d | 1 | 0.93mi |
| 4591 Southwestern Blvd Hamburg, NY | 1.0–2.0 | 1.0 | 737 | $1,415 | $1.92 | 3d | 12 | 1.44mi |
Listing history 16 events
-
2026-06-21days on market $160,300 Active 173 DOM
-
2026-06-18days on market $160,300 Active 170 DOM
-
2026-06-17days on market $160,300 Active 169 DOM
-
2026-06-16days on market $160,300 Active 168 DOM
-
2026-06-15days on market $160,300 Active 167 DOM
-
2026-06-13days on market $160,300 Active 165 DOM
-
2026-06-10days on market $160,300 Active 162 DOM
-
2026-06-09days on market $160,300 Active 161 DOM
-
2026-06-08days on market $160,300 Active 160 DOM
-
2026-06-07days on market $160,300 Active 159 DOM
-
2026-06-05days on market $160,300 Active 156 DOM
-
2026-06-03days on market $160,300 Active 155 DOM
-
2026-06-02days on market $160,300 Active 154 DOM
-
2026-06-01days on market $160,300 Active 153 DOM
-
2026-05-31days on market $160,300 Active 152 DOM
-
2025-12-30$160,300 Active 89-char remark
Show marketing remark (89 chars)
Beautiful front covered porch with sliding glass doors. 3 bedrooms 2 bathroom Coming soon
ⓘ Source: listings_history table (triggers on properties + properties_extension) + one-shot
backfill from property_details.listing_events for pre-trigger history.
Climate risk First Street
- Flood 1/10 Low FEMA zone X (unshaded) · 0% chance over 30 yrs
- Wildfire 1/10 Low
- Heat 2/10 Low 7 d/yr ≥93°F today · 15 d/yr by 30 yrs out
- Wind 1/10 Low
- Air quality 4/10 Moderate 4 unhealthy d/yr today · 9 by 30 yrs out
Nearby sold comps map
Loading sold comps map…
Walkable amenities ~0.75 mi
Loading nearby amenities…
Taxation est. · year 1
- Rental income
- $21,016
- − Mortgage interest
- −$4,452
- − Property taxes
- −$1,192
- − Insurance
- −$397
- − Repairs & maintenance
- −$1,681
- − Management
- −$1,681
- − Depreciation
- −$2,312
- Taxable income
- $9,300
- Est. tax owed @ 24.0%
- −$2,232
- After-tax cash flow
- $7,780/yr
For passive investors: Depreciation is non-cash, so a rental often shows a tax loss while cash-flowing — sheltering income. Rental losses are passive: they offset passive income freely, and up to $25,000/yr can offset ordinary (W-2) income if you actively participate and your MAGI is under $100k (phasing out to $0 by $150k); unused losses carry forward. On sale, claimed depreciation is recaptured at up to 25%, and gains may owe capital-gains tax (a 1031 exchange can defer both). Figures are a year-1 estimate at your 24.0% rate — not tax advice; consult a CPA.
Condition & rehab AI · 5 photos
This manufactured home is in good condition with a good condition score of 80. It is move-in ready with minor cosmetic updates that could further enhance its value.
Value-add opportunities
- Both Painting exterior and interior walls — Fresh paint enhances curb appeal and interior aesthetics
- Both Landscaping improvements — Enhances curb appeal and adds value
- Both Add a small outdoor lighting system — Improves safety and enhances curb appeal
Renovation cost estimate screening
Value-add ROI direction
- Both Painting exterior and interior walls — Fresh paint enhances curb appeal and interior aesthetics ↑
- Both Landscaping improvements — Enhances curb appeal and adds value ↑
- Both Add a small outdoor lighting system — Improves safety and enhances curb appeal ↑
ⓘ Cost ranges are severity-bucket heuristics (US national rule-of-thumb). Get contractor quotes + a written scope before underwriting a rehab budget.
Schools (NCES district)
- District
- Frontier Central School District
- NCES district ID
- 3611670
- Math proficiency
- 54% ▼ -16.00%
- Reading proficiency
- 55% ▼ -10.00%
- Median HH income
- $58,807
- Composite
- 47.36/100
- National rank
- #2291
- State rank
- #301 of 590 in NY
Livability — Wanakah
- Score
- 69/100
- State rank
- #508
- US rank
- #8972
Category grades
Schools grade is shown separately in the Schools card above.
Census & demographics
- County
- Erie County · 714,559 people
- Metro
- Buffalo-Cheektowaga, NY
- Population (ZIP)
- 44,520
- Household income
- $83,383
- Rent vs Own
- Severe rent burden
- 824.0
Population outlook (Erie County) Hauer SSP2
- Today (2025)
- 933,037 people
- By 2030
- 935,181 · +0.2%
- By 2040
- 928,531 · -0.5%
- By 2050
- 905,725 · -2.9%
- By 2075
- 834,037 · -10.6%
- By 2100
- 708,033 · -24.1%
Race, ethnicity, and origin ACS 2023
- Neighborhood character
- Predominantly White (92%)
- Race & ethnicity
- White 92% Two or more races 4% Hispanic / Latino 3% Black 1%
- Common ancestry
- Romanian 20% Lithuanian 2% Slovak 2%
- Foreign-born
- 2% · Canada
- Languages at home
- 97% English-only · Spanish 1% Other Indo-European 1%
Political lean MEDSL · Erie
- 2024 margin
- Lean D (+9.7) · D 54.8% · R 45.2%
- 2008→2024 swing
- -7.9pp toward R · 2008: 17.5pp · 2024: 9.7pp
- All cycles
- 2024: D+9.7 2020: D+14.7 2016: D+4.8 2012: D+15.6 2008: D+17.5
Not yet ingested
- Civics
- —
Market trends
- HPI YoY
- ▼ -261.10%
- Current HPI
- 300.2852
- Rent YoY
- ▲ 5.21%
- Metro
- Buffalo-Cheektowaga, NY
- State GDP YoY
- ▲ 2.60%
- F500 in state
- 92
Industry mix (Fortune 500 HQ in NY)
| Industry | F500 HQs | Revenue |
|---|---|---|
| Financial Services | 10 | $950B |
|
||
| Consumer Goods | 9 | $162B |
|
||
| Insurance | 4 | $225B |
|
||
| Telecommunications | 2 | $144B |
|
||
| Pharmaceuticals | 2 | $112B |
|
||
| Media / Entertainment | 2 | $69B |
|
||
Price history
1 event — show timeline
- 2025-12-30 Listed $160,300 Zillow
Cash-flow waterfall
monthlySold comps — $/sqft
last 12 mo · ≤1 miLoading sold comps…