4705 Fox Holw #18 · Graham, TX
Flood risk 1/10 · Minimal
- FEMA flood zone
- X (unshaded)
- Chance of flooding over 30 yrs
- 0.0%
- Est. flood insurance / yr
- $507 – $1,088
Fire risk 4/10 · Minor
- Est. fire insurance / yr
- $1,222 – $2,270
Heat risk 7/10 · Major
- Hot days now (above 107°F)
- 7 days/yr
- Hot days in 30 yrs
- 22 days/yr
Wind risk 4/10 · Minor
- Chance of severe wind over 30 yrs
- 14.0%
Air-quality risk 1/10 · Minimal
- Unhealthy air days now
- 0 days/yr
- Unhealthy air days in 30 yrs
- 0 days/yr
Risk factors via First Street. Map © Google.
Why this score? — see what drove the B- grade
The composite is a weighted blend of 9 inputs, each scored 0–100. Each bar is that input's sub-score; the figure is the points it added to the 100-point composite (weight × sub-score).
- Cash flow +30.0/30.0
- 1% rule +10.0/10.0
- DSCR +10.0/10.0
- ARV discount +7.5/15.0
- Livability +3.7/5.0
- Schools +3.4/10.0
- Rent growth +2.5/5.0
- Condition / age +2.2/5.0
- Appreciation +0.0/10.0
$32,000
🖨 Deal sheet (PDF) 📄 Offer letter ✓ Due diligence
Listing remarks MLS
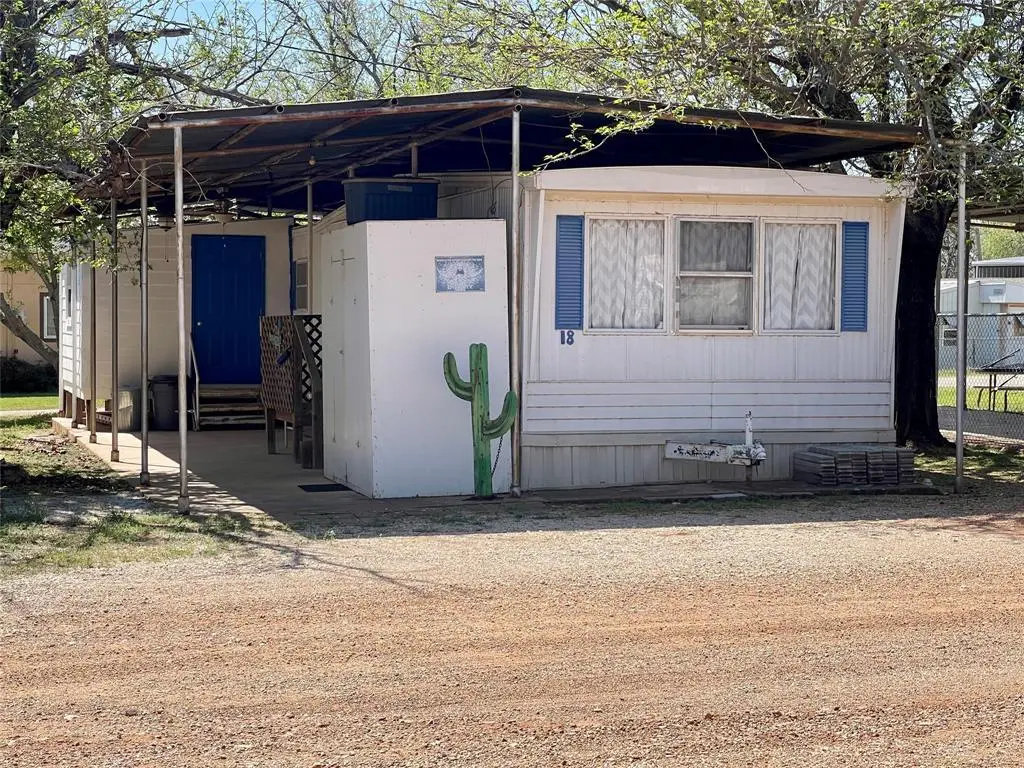
Adorable, move-in-ready lake retreat in the popular Fox Hollow Resort on the west side of Possum Kingdom Lake! Offered mostly furnished, this inviting home features an open-concept layout, three bedrooms, and a covered patio perfect for relaxing or entertaining after a day on the water. Enjoy easy lake access with the community boat ramp and courtesy slips—ideal for quick trips to Hell’s Gate or cruising the scenic shoreline. Conveniently located near The Hungry Fox Restaurant and Foxy’s Cantina, you’ll love having great dining and live entertainment just moments away. Whether you’re hosting friends or seeking a peaceful getaway, this charming lake home offers the best of both worlds. Fox Hollow is a leasehold community with an annual lease fee of $7,800 (2026). Landowner pays property taxes on the land; homeowner is responsible for taxes on improvements. Don’t miss your chance to experience the PK Lake lifestyle!
Key facts
- Easy lake access
- Community boat ramp
- Courtesy slips
Tags
Neighborhood map
What this means for you Summary
Snapshot
- This is a 3-bed/1.0-bath manufactured listed at $32k. Condition is rated fair.
Deal economics
- At list price, monthly cash flow is $617 ($7k/yr) — positive.
- The deal already cash-flows at list — no discount required.
- Meets the 1% rule at list price ($1k rent vs $32k).
- Recommended offer: $30k (6.0% below list) — sets the bar for market timing.
- Cap rate 29.4% vs local median 2.3% in Graham — top-decile yield for the area; either an underpriced asset or a hidden risk that comps aren't pricing in. Stress-test before assuming the spread holds.
Location & tenants
- Location reads 73/100 on livability (#232 in TX) — a middle-class / working-renter tenant base. Strengths: cost of living A+, housing A+, crime A; Watch: employment C-, health & safety C-, amenities F.
- Graford ISD (rural): math 35% / reading 40% proficiency, ranked #817 of 1,141 in TX (top 72%) — families likely to look elsewhere, expect single-tenant / working-renter base with shorter leases.
- Zoned schools: Graford School (math 37% / reading 42%, 321 students, 56% FRL) — zoned schools at 56% FRL track the district average.
- Market conditions: 188 active listings in the ZIP; 27 units permitted in Palo Pinto County in 2024 (0 in 5+ unit buildings).
Forward outlook
- Local home prices are declining (-3.0%/yr); year-one equity from $221 of loan paydown is wiped out by about $960 of value loss. Plan a longer hold.
- Palo Pinto County population projected to shrink 8% by 2050 — rents likely to lag national; underwrite the cash flow, not the appreciation.
- At projected returns (-3.0% appreciation + 3.0% rent growth), your $9k cash investment doubles in ~2 years — after that, you're playing with house money.
Negotiation context
- It's been on market 88 days — a 6% lower offer ($30k) is reasonable based on typical stale-listing flexibility.
Risks & watch-outs
- Climate carrying-cost: extreme-heat days projected 7→22/yr by 2055 (HVAC capex compounding) — expect insurance premiums to compound above CPI over the hold.
Questions for the listing agent
- It's been on market 88 days. Have you received any prior offers? Is the seller open to a 6% concession, seller financing, or rate buy-down credit?
- Have any recent inspections been done? Can we get a copy of the seller's disclosures and any deferred-maintenance estimates?
- Built in 1966 — when were the roof, HVAC, electrical panel, plumbing, and water heater last replaced?
- Why hasn't it sold? Are there any deal-killer items the seller is aware of (foundation, flood, title, zoning, code violations)?
- Is there a deadline driving the sale (1031 exchange, divorce, estate, relocation)? That informs how much negotiation room exists.
- What's the average days-on-market for RENTAL listings here right now (not sales)? A rising rental-DOM trend means longer vacancies and softer asking-rent achievability than the comps imply.
- What's the recent tenant-quality profile in this submarket — average credit score on applications, eviction rate, late-payment / NSF rate, and stable-employment percentage? A property-management company in the area should have these aggregated.
- How much new for-sale + rental construction is in the pipeline within 1–3 miles? Heavy new supply typically softens prices + rents 12–24 months out; constrained supply supports both.
Investment metrics
- 1% rule
- 3.32% ✓
- Cap rate
- 29.43%
- Cash-on-cash
- 82.65%
- DSCR
- 4.68
- GRM
- 2.5
CMA / ARV
- ARV (median comp)
- $262,663
- List price
- $32,000
- Delta
- -87.82%
- Verdict
- UNDERPRICED
- Comps
- 2 within 2.0 mi
Show comp detail 1 sale within ~0.75 mi
| Address | Dist | Beds/Ba | Sqft | Sold | Price | $/sf | Match |
|---|---|---|---|---|---|---|---|
| 4705 Fox Hollow Rd #41 | 0.08mi | 3/1.5 | 720 (-14%) | 7mo | $38,000 | $53 | 65 |
Match score weights: distance 35% · size 25% · config 20% · recency 20%. Top-matched comps best support the ARV.
Projected returns pro-forma
-3.0% appreciation · 3.0% rent growth · sell at horizon
- IRR
- 83.0%
- Equity multiple
- 4.81×
- Total profit
- $34,135
- Equity at exit
- $4,771
- IRR
- 86.3%
- Equity multiple
- 9.97×
- Total profit
- $80,400
- Equity at exit
- $2,767
Cash invested: $8,960 (down + closing). Projections, not guarantees.
Landlord ↔ Tenant lean methodology
- Overall (STATE)
- 87 Strongly Landlord-Friendly
- State Texas
- 87 Strongly Landlord-Friendly · R+5
- County
- — inherits STATE
- City
- — inherits STATE
ZIP-level market 76450
- Home prices YoY
- -24.0%
- Active inventory
- 188
- Price-to-rent
- 2.5×
Monthly cashflow live
- Estimated rent
- $1,061 medium interval (Pro) →
- Mortgage (P&I)
- −$168
- Tax est. 1.5%
- −$40 /mo · $480/yr
- Insurance
- −$13
- HOA
- −$0
- Vacancy / Maint / Mgmt
- −$223
- Net cashflow
- $617
Break-even live
Sensitivity live
| Price | -10% $639 | -5% $628 | +0% $617 | +5% $606 | +10% $595 |
|---|---|---|---|---|---|
| Rent | -10% $533 | -5% $575 | +0% $617 | +5% $659 | +10% $701 |
| Rate | -1.0pp $633 | -0.5pp $625 | base $617 | +0.5pp $609 | +1.0pp $600 |
UW: 25.0% down · 7.5% · 30yr · 1.5% tax · 5.0% vac · 8.0% maint · 8.0% mgmt
Financing live
Cash to close
- Down payment
- $8,000
- Closing costs
- $960
- Reserves months
- —
- Total cash needed
- —
Loan-product check · same deal, 3 products live
Conventional
25% down · 7.5% · 30yr
- Down + closing
- —
- Monthly P&I
- —
- Monthly cashflow
- —
- DSCR
- —
- Eligible?
- —
Personal DTI + credit; lowest rate.
DSCR
20% down · 8.5% · 30yr
- Down + closing
- —
- Monthly P&I
- —
- Monthly cashflow
- —
- DSCR
- —
- Eligible?
- —
No personal income docs; deal must DSCR.
Hard money
10% down · 12.0% · 12mo
- Down + closing
- —
- Monthly P&I
- —
- Monthly cashflow
- —
- DSCR
- —
- Eligible?
- —
Short-term bridge; refi at stabilization.
Listing history 18 events
-
2026-06-21days on market $32,000 Active 88 DOM
-
2026-06-19days on market $32,000 Active 86 DOM
-
2026-06-18days on market $32,000 Active 85 DOM
-
2026-06-17days on market $32,000 Active 84 DOM
-
2026-06-16days on market $32,000 Active 83 DOM
-
2026-06-15days on market $32,000 Active 82 DOM
-
2026-06-14days on market $32,000 Active 80 DOM
-
2026-06-12days on market $32,000 Active 79 DOM
-
2026-06-09days on market $32,000 Active 76 DOM
-
2026-06-08days on market $32,000 Active 75 DOM
-
2026-06-07days on market $32,000 Active 74 DOM
-
2026-06-05days on market $32,000 Active 72 DOM
-
2026-06-04days on market $32,000 Active 70 DOM
-
2026-06-02days on market $32,000 Active 69 DOM
-
2026-06-01days on market $32,000 Active 68 DOM
-
2026-05-31days on market $32,000 Active 67 DOM
-
2026-05-31days on market $32,000 Active 66 DOM
-
2026-03-24$32,000 Active 972-char remark
Show marketing remark (972 chars)
Adorable, move-in-ready lake retreat in the popular Fox Hollow Resort on the west side of Possum Kingdom Lake! Offered mostly furnished, this inviting home features an open-concept layout, three bedrooms, and a covered patio perfect for relaxing or entertaining after a day on the water. Enjoy easy lake access with the community boat ramp and courtesy slips—ideal for quick trips to Hell’s Gate or cruising the scenic shoreline. Conveniently located near The Hungry Fox Restaurant and Foxy’s Cantina, you’ll love having great dining and live entertainment just moments away. Whether you’re hosting friends or seeking a peaceful getaway, this charming lake home offers the best of both worlds. Fox Hollow is a leasehold community with an annual lease fee of $7,800 (2026). Landowner pays property taxes on the land; homeowner is responsible for taxes on improvements. Don’t miss your chance to experience the PK Lake lifestyle!
ⓘ Source: listings_history table (triggers on properties + properties_extension) + one-shot
backfill from property_details.listing_events for pre-trigger history.
Climate risk First Street
- Flood 1/10 Low FEMA zone X (unshaded) · 0% chance over 30 yrs
- Wildfire 4/10 Moderate
- Heat 7/10 Severe 7 d/yr ≥107°F today · 22 d/yr by 30 yrs out
- Wind 4/10 Moderate 14% chance of damaging wind over 30 yrs
- Air quality 1/10 Low 0 unhealthy d/yr today · 0 by 30 yrs out
Nearby sold comps map
Loading sold comps map…
Walkable amenities ~0.75 mi
Loading nearby amenities…
Taxation est. · year 1
- Rental income
- $12,733
- − Mortgage interest
- −$1,792
- − Property taxes
- −$480
- − Insurance
- −$160
- − Repairs & maintenance
- −$1,019
- − Management
- −$1,019
- − Depreciation
- −$931
- Taxable income
- $7,332
- Est. tax owed @ 24.0%
- −$1,760
- After-tax cash flow
- $5,646/yr
For passive investors: Depreciation is non-cash, so a rental often shows a tax loss while cash-flowing — sheltering income. Rental losses are passive: they offset passive income freely, and up to $25,000/yr can offset ordinary (W-2) income if you actively participate and your MAGI is under $100k (phasing out to $0 by $150k); unused losses carry forward. On sale, claimed depreciation is recaptured at up to 25%, and gains may owe capital-gains tax (a 1031 exchange can defer both). Figures are a year-1 estimate at your 24.0% rate — not tax advice; consult a CPA.
Condition & rehab AI · 13 photos
This mobile home is move-in ready with cosmetic updates needed to enhance its curb appeal and value.
Repairs flagged
- Major roof — visible wear
- Major exterior siding — some discoloration
Value-add opportunities
- Both paint exterior — enhances curb appeal and value
- Both replace carpet — improves comfort and value
- Both update kitchen cabinets — modernizes and increases value
- Both update bathroom fixtures — modernizes and increases value
Renovation cost estimate screening
| Repair item | Severity | Est. cost |
|---|---|---|
| roof · visible wear | Major | $15,000–50,000 |
| exterior siding · some discoloration | Major | $15,000–50,000 |
| Total estimated repair cost · 2 items | $30,000–100,000 |
Value-add ROI direction
- Both paint exterior — enhances curb appeal and value ↑
- Both replace carpet — improves comfort and value ↑
- Both update kitchen cabinets — modernizes and increases value ↑
- Both update bathroom fixtures — modernizes and increases value ↑
ⓘ Cost ranges are severity-bucket heuristics (US national rule-of-thumb). Get contractor quotes + a written scope before underwriting a rehab budget.
Schools (NCES district)
- District
- Graford ISD
- NCES district ID
- 4821330
- Math proficiency
- 35% ▬ 0.00%
- Reading proficiency
- 40% ▲ 10.00%
- Median HH income
- $43,275
- Composite
- 34.3/100
- National rank
- #10225
- State rank
- #817 of 1141 in TX
Livability — Graham
- Score
- 73/100
- State rank
- #232
- US rank
- #5580
Category grades
Schools grade is shown separately in the Schools card above.
Census & demographics
- Population (ZIP)
- 12,890
Population outlook (Palo Pinto County) Hauer SSP2
- Today (2025)
- 27,500 people
- By 2030
- 27,079 · -1.5%
- By 2040
- 26,135 · -5.0%
- By 2050
- 25,215 · -8.3%
- By 2075
- 23,416 · -14.9%
- By 2100
- 20,300 · -26.2%
Race, ethnicity, and origin ACS 2023
- Neighborhood character
- Predominantly White (74%)
- Race & ethnicity
- White 74% Hispanic / Latino 21% Two or more races 10% Black 2%
- Hispanic origin (detail)
- Mexican 16% Puerto Rican 3%
- Common ancestry
- Slovak 3% Italian 2% Serbian 1%
- Foreign-born
- 7% · Canada
- Languages at home
- 84% English-only · Spanish 15%
Political lean MEDSL · Palo Pinto
- 2024 margin
- Solid R (+67.1) · D 16.1% · R 83.2%
- 2008→2024 swing
- -18.9pp toward R · 2008: -48.2pp · 2024: -67.1pp
- All cycles
- 2024: R+67.1 2020: R+64.1 2016: R+64.1 2012: R+59.8 2008: R+48.2
Not yet ingested
- Civics
- —
Market trends
- HPI YoY
- ▼ -62.82%
- Current HPI
- 198.6373
- Rent YoY
- —
- Metro
- —
- State GDP YoY
- ▲ 3.95%
- F500 in state
- 110
Industry mix (Fortune 500 HQ in TX)
| Industry | F500 HQs | Revenue |
|---|---|---|
| Energy | 16 | $1,198B |
|
||
| Technology | 5 | $198B |
|
||
| Engineering / Construction | 4 | $72B |
|
||
| Energy Services | 3 | $60B |
|
||
| Utilities | 3 | $41B |
|
||
| Healthcare | 2 | $330B |
|
||
Price history
1 event — show timeline
- 2026-03-24 Listed $32,000 NTREIS
Cash-flow waterfall
monthlySold comps — $/sqft
last 12 mo · ≤1 miLoading sold comps…