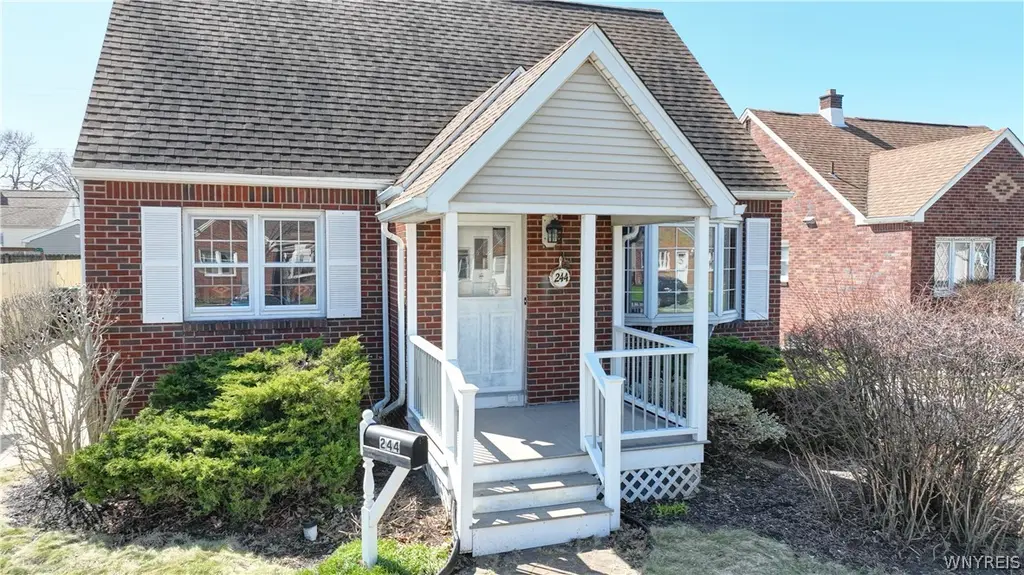
244 Renwood Ave · Tonawanda Town, NY
Flood risk 1/10 · Minimal
- FEMA flood zone
- X (unshaded)
- Chance of flooding over 30 yrs
- 0.0%
- Est. flood insurance / yr
- $473 – $860
Fire risk 1/10 · Minimal
- Est. fire insurance / yr
- $691 – $1,283
Heat risk 2/10 · Minimal
- Hot days now (above 93°F)
- 7 days/yr
- Hot days in 30 yrs
- 15 days/yr
Wind risk 1/10 · Minimal
- Chance of severe wind over 30 yrs
- —
Air-quality risk 3/10 · Minor
- Unhealthy air days now
- 3 days/yr
- Unhealthy air days in 30 yrs
- 4 days/yr
Risk factors via First Street. Map © Google.
Why this score? — see what drove the D grade
The composite is a weighted blend of 9 inputs, each scored 0–100. Each bar is that input's sub-score; the figure is the points it added to the 100-point composite (weight × sub-score).
- Cash flow +12.4/30.0
- ARV discount +8.8/15.0
- Rent growth +4.9/5.0
- 1% rule +4.4/10.0
- Schools +3.9/10.0
- DSCR +3.7/10.0
- Livability +2.5/5.0
- Condition / age +2.5/5.0
- Appreciation +0.0/10.0
$215,000
🖨 Deal sheet 📄 Offer letter ✓ Due diligence
Listing remarks
Start your day on the covered front porch, coffee in hand, as sunlight filters through the neighborhood. This is the kind of home that immediately feels familiar and comfortable. 244 Renwood Ave offers a blend of classic design and practical living, beginning with its inviting brick exterior and welcoming entry. Inside, hardwood floors stretch across much of the home, reflecting natural light that pours in through large windows and creating a warm, easygoing atmosphere throughout. The living room provides a spacious setting for everyday relaxation, while the formal dining room offers a defined space for meals, and special occasions. Just beyond, the eat-in kitchen is both functional and inv
Key facts
- Covered front porch
- Large windows
- Brick exterior
Tags
Property features AI
Exterior
- Parking: Detached garage with electricity; 2-car garage
- Utilities: Electricity connected (circuit breakers); Public water connected; Sewer connected; Cable available
- Home design: 2-story existing home; Main entry on primary level
- Construction: Brick and frame construction with vinyl siding; Asphalt roof; Copper plumbing; Poured foundation; Built as existing (pre-owned)
- Exterior features: Concrete driveway; Partial fencing; Near public transit; Rectangular residential lot; City street frontage
Interior
- Kitchen: Gas oven; Gas range; Microwave; Refrigerator; Eat-in kitchen layout
- Bedrooms: 1 main-level bedroom
- Flooring: Hardwood; Luxury vinyl; Varied flooring
- Bathrooms: 1 full bathroom (main level)
- Heating & cooling: Gas forced-air heating; Central air conditioning
- Interior features: Ceiling fans; Separate formal dining room; Entrance foyer; Eat-in kitchen; Separate formal living room; Sunroom/Florida room; Main level primary bedroom; Bedroom on main level
- Laundry & utility: Laundry in basement with accessible utilities; Gas water heater
Neighborhood map
What this means for you Summary
Snapshot
- This is a 3-bed/1.0-bath single-family listed at $215k.
Deal economics
- At list price, monthly cash flow is $-35 ($-423/yr) — negative.
- To cash-flow at today's rent, offer at most $209k (2.9% below list).
- To meet the 1% rule (rent ≥ 1% of price), the offer needs to be $203k (5.6% below list).
- Recommended offer: $203k (5.6% below list) — sets the bar for 1% rule.
- Cap rate 6.1% vs local median 4.1% in Tonawanda Town — top-decile yield for the area; either an underpriced asset or a hidden risk that comps aren't pricing in. Stress-test before assuming the spread holds.
Location & tenants
- Location reads: area grade D — affects rentability + tenant quality, not the cash-flow math above.
- Kenmore-Tonawanda Union Free School District (suburban): math 44% / reading 47% proficiency, ranked #453 of 590 in NY (top 77%) — families likely to look elsewhere, expect single-tenant / working-renter base with shorter leases.
- Market conditions: Rents rising fast (+9.8%/yr); 99 active listings in the ZIP; 11 comparable units currently listed for rent nearby; rentals at typical pace (median 24d on market — plan ~3-4 weeks tenant-placement turnaround); 1,244 units permitted in Erie County in 2024 (563 in 5+ unit buildings).
- This rent runs 33% of the median local income ($74k/yr) — at the standard rent-burdened threshold; future hikes will face affordability resistance.
Forward outlook
- Local home prices are declining (-3.0%/yr); year-one equity from $1k of loan paydown is wiped out by about $6k of value loss. Plan a longer hold.
Negotiation context
- Only 7 days on market — expect competitive offers; lowballing is unlikely to land.
Risks & watch-outs
- Watch-outs: built in 1954 — expect roof / HVAC / electrical / plumbing capex.
Questions for the listing agent
- What do current leases actually rent for vs. the listed asking? Can we see a recent rent roll and the last 12 months of T-12 income?
- Built in 1954 — when were the roof, HVAC, electrical panel, plumbing, and water heater last replaced?
- Is there a deadline driving the sale (1031 exchange, divorce, estate, relocation)? That informs how much negotiation room exists.
- The area grade is low — what's the realistic commute time and amenity access for the typical tenant pool here? Any planned neighborhood developments (good or bad) we should know about?
- What's the average days-on-market for RENTAL listings here right now (not sales)? A rising rental-DOM trend means longer vacancies and softer asking-rent achievability than the comps imply.
- What's the recent tenant-quality profile in this submarket — average credit score on applications, eviction rate, late-payment / NSF rate, and stable-employment percentage? A property-management company in the area should have these aggregated.
- How much new for-sale + rental construction is in the pipeline within 1–3 miles? Heavy new supply typically softens prices + rents 12–24 months out; constrained supply supports both.
Investment metrics
- 1% rule
- 0.94% ✗
- Cap rate
- 6.10%
- Cash-on-cash
- -0.70%
- DSCR
- 0.97
- GRM
- 8.8
CMA / ARV
- ARV (on-the-fly)
- $221,288
- Comps found
- 12
Show comp detail 12 sales within ~0.75 mi
| Address | Dist | Beds/Ba | Sqft | Sold | Price | $/sf | Match |
|---|---|---|---|---|---|---|---|
| 1835 Military Rd | 0.08mi | 2/1.0 (-1) | 1,064 (-4%) | 6mo | $165,000 | $155 | 79 |
| 275 Oakridge Ave | 0.10mi | 3/1.0 | 1,000 (-10%) | 0mo | $280,000 | $280 | 78 |
| 273 Homewood Ave | 0.26mi | 2/1.0 (-1) | 1,158 (+4%) | 7mo | $193,830 | $167 | 70 |
| 216 Waverly Ave | 0.12mi | 3/1.0 | 1,257 (+13%) | 6mo | $185,000 | $147 | 67 |
| 207 Waverly Ave | 0.16mi | 3/1.0 | 960 (-14%) | 9mo | $260,000 | $271 | 62 |
| 105 Oakridge Ave | 0.28mi | 3/2.0 | 1,018 (-8%) | 8mo | $276,000 | $271 | 62 |
| 84 Coventry Rd | 0.39mi | 2/1.0 (-1) | 1,194 (+7%) | 6mo | $295,000 | $247 | 59 |
| 16 Zimmerman Blvd | 0.53mi | 3/1.0 | 1,009 (-9%) | 3mo | $211,050 | $209 | 58 |
| 21 Waverly Ave | 0.43mi | 3/1.0 | 1,248 (+12%) | 8mo | $223,000 | $179 | 53 |
| 298 Lowell Rd | 0.51mi | 3/1.5 | 1,249 (+12%) | 2mo | $190,000 | $152 | 52 |
| 308 Lowell Rd | 0.51mi | 3/1.0 | 1,249 (+12%) | 6mo | $243,000 | $195 | 51 |
| 108 Mcconkey Dr | 0.72mi | 2/1.5 (-1) | 1,209 (+9%) | 9mo | $240,000 | $199 | 37 |
Match score weights: distance 35% · size 25% · config 20% · recency 20%. Top-matched comps best support the ARV.
Projected returns pro-forma
-3.0% appreciation · 8.0% rent growth · sell at horizon
- IRR
- -11.4%
- Equity multiple
- 0.56×
- Total profit
- $-26,233
- Equity at exit
- $32,057
- IRR
- 4.3%
- Equity multiple
- 1.39×
- Total profit
- $23,602
- Equity at exit
- $18,589
Cash invested: $60,200 (down + closing). Projections, not guarantees.
Landlord ↔ Tenant lean methodology
- Overall (STATE)
- 15 Strongly Tenant-Friendly
- State New York
- 15 Strongly Tenant-Friendly · D+10
- County
- — inherits STATE
- City
- — inherits STATE
ZIP-level market 14217
- Home prices YoY
- -34.3%
- Rents YoY
- 9.8%
- Active inventory
- 99
- Price-to-rent
- 8.8×
Monthly cashflow live
- Estimated rent
- $2,030 high interval (Pro) →
- Mortgage (P&I)
- −$1,127
- Tax from tax record
- −$422 /mo · $5,064/yr
- Insurance
- −$90
- HOA
- −$0
- Vacancy / Maint / Mgmt
- −$426
- Net cashflow
- $-35
Break-even live
UW: 25.0% down · 7.5% · 30yr · 1.5% tax · 5.0% vac · 8.0% maint · 8.0% mgmt
Financing live
Cash to close
- Down payment
- $53,750
- Closing costs
- $6,450
- Reserves months
- —
- Total cash needed
- —
Loan-product check · same deal, 3 products live
Conventional
25% down · 7.5% · 30yr
- Down + closing
- —
- Monthly P&I
- —
- Monthly cashflow
- —
- DSCR
- —
- Eligible?
- —
Personal DTI + credit; lowest rate.
DSCR
20% down · 8.5% · 30yr
- Down + closing
- —
- Monthly P&I
- —
- Monthly cashflow
- —
- DSCR
- —
- Eligible?
- —
No personal income docs; deal must DSCR.
Hard money
10% down · 12.0% · 12mo
- Down + closing
- —
- Monthly P&I
- —
- Monthly cashflow
- —
- DSCR
- —
- Eligible?
- —
Short-term bridge; refi at stabilization.
Rent comps 11 comps
| Address | Beds | Baths | Sqft | Rent | $/sqft | DOM | Units | Dist |
|---|---|---|---|---|---|---|---|---|
| 1835 Military Rd Buffalo, NY | 2.0 | 1.0 | 1064 | $2,175 | $2.04 | 17d | 1 | 0.09mi |
| 148 Colonial Ave Buffalo, NY | 4.0 | 2.0 | 1240 | $2,900 | $2.34 | 23d | 1 | 0.35mi |
| 36-46 Crowell Ct Unit 40 Tonawanda, NY | 3.0 | 1.0 | 1000 | $1,395 | $1.40 | 23d | 1 | 0.55mi |
| 53 Winkler Dr Tonawanda, NY | 3.0 | 1.0 | 1060 | $2,100 | $1.98 | 11d | 1 | 0.95mi |
| 49 Tulane Rd Buffalo, NY | 2.0 | 1.0 | 1100 | $1,600 | $1.45 | 17d | 1 | 0.96mi |
| 1950 Sheridan Dr Buffalo, NY | 1.0–2.0 | 1.0 | 704 | $1,485 | $2.11 | 1d | 5 | 1.10mi |
| 285 Crestmount Ave Tonawanda, NY | 1.0–2.0 | 1.0 | 725 | $1,905 | $2.63 | 1d | 9 | 1.11mi |
| 237 W Girard Blvd Buffalo, NY | 4.0 | 1.5 | 1329 | $4,000 | $3.01 | 23d | 1 | 1.11mi |
| 52 Somerton Ave Unit Upper Buffalo, NY | 2.0 | 1.0 | 900 | $1,200 | $1.33 | 23d | 1 | 1.15mi |
| 3113 Delaware Ave Unit 1 Buffalo, NY | 2.0 | 1.0 | 1083 | $1,200 | $1.11 | 23d | 1 | 1.37mi |
| 52 Kenwood Rd Unit 1 Buffalo, NY | 2.0 | 1.0 | 1100 | $1,250 | $1.14 | 23d | 1 | 1.43mi |
Listing history 2 events
-
2026-04-16status Pending
-
2026-04-08$215,000 Active
ⓘ Source: listings_history table (triggers on properties + properties_extension) + one-shot
backfill from property_details.listing_events for pre-trigger history.
Tax reassessment forecast NY · Partial reset (capped growth)
- Current annual tax
- $5,064 · $422/mo
- Projected year-2 tax
- $5,064 · $422/mo
- Expected delta
- $0/yr ($0/mo · 0.0%)
ⓘ Screening estimate from a state-policy table — verify with the county assessor before closing.
Climate risk First Street
- Flood 1/10 Low FEMA zone X (unshaded) · 0% chance over 30 yrs
- Wildfire 1/10 Low
- Heat 2/10 Low 7 d/yr ≥93°F today · 15 d/yr by 30 yrs out
- Wind 1/10 Low
- Air quality 3/10 Moderate 3 unhealthy d/yr today · 4 by 30 yrs out
Nearby sold comps map
Loading sold comps map…
Walkable amenities ~0.75 mi
Loading nearby amenities…
Taxation est. · year 1
- Rental income
- $24,362
- − Mortgage interest
- −$12,043
- − Property taxes
- −$5,064
- − Insurance
- −$1,075
- − Repairs & maintenance
- −$1,949
- − Management
- −$1,949
- − Depreciation
- −$6,255
- Taxable loss
- −$3,973
- Est. tax savings @ 24.0%
- +$954
- After-tax cash flow
- $530/yr
For passive investors: Depreciation is non-cash, so a rental often shows a tax loss while cash-flowing — sheltering income. Rental losses are passive: they offset passive income freely, and up to $25,000/yr can offset ordinary (W-2) income if you actively participate and your MAGI is under $100k (phasing out to $0 by $150k); unused losses carry forward. On sale, claimed depreciation is recaptured at up to 25%, and gains may owe capital-gains tax (a 1031 exchange can defer both). Figures are a year-1 estimate at your 24.0% rate — not tax advice; consult a CPA.
Schools (NCES district)
- District
- Kenmore-Tonawanda Union Free School District
- NCES district ID
- 3616230
- Math proficiency
- 44% ▼ -12.00%
- Reading proficiency
- 47% ▼ -1.00%
- Median HH income
- $51,433
- Composite
- 39.18/100
- National rank
- #4024
- State rank
- #453 of 590 in NY
Livability — Tonawanda Town
No livability data for this city. (Only ~50 U.S. cities are tracked.)
Census & demographics
- Census place
- Tonawanda Town, NY
- County
- Erie County · 714,559 people
- City population
- 63,948
- Metro
- Buffalo-Cheektowaga, NY
- Population (ZIP)
- 22,471
- Household income
- $73,800
- Rent vs Own
- Severe rent burden
- 727.0
Population outlook (Erie County) Hauer SSP2
- Today (2025)
- 933,037 people
- By 2030
- 935,181 · +0.2%
- By 2040
- 928,531 · -0.5%
- By 2050
- 905,725 · -2.9%
- By 2075
- 834,037 · -10.6%
- By 2100
- 708,033 · -24.1%
Race, ethnicity, and origin ACS 2023
- Neighborhood character
- Predominantly White (82%)
- Race & ethnicity
- White 82% Two or more races 8% Hispanic / Latino 6% Black 5%
- Hispanic origin (detail)
- Puerto Rican 4%
- Common ancestry
- Romanian 13% Italian 2% Slovak 2%
- Foreign-born
- 4% · Canada
- Languages at home
- 94% English-only · Spanish 3% Arabic 1% Russian/Polish/Slavic 1%
Political lean MEDSL · Erie
- 2024 margin
- Lean D (+9.7) · D 54.8% · R 45.2%
- 2008→2024 swing
- -7.9pp toward R · 2008: 17.5pp · 2024: 9.7pp
- All cycles
- 2024: D+9.7 2020: D+14.7 2016: D+4.8 2012: D+15.6 2008: D+17.5
Not yet ingested
- Civics
- —
Market trends
- HPI YoY
- ▼ -172.52%
- Current HPI
- 330.7596
- Rent YoY
- ▲ 9.76%
- Metro
- Buffalo-Cheektowaga, NY
- State GDP YoY
- ▲ 2.60%
- F500 in state
- 92
Industry mix (Fortune 500 HQ in NY)
| Industry | F500 HQs | Revenue |
|---|---|---|
| Financial Services | 10 | $950B |
|
||
| Consumer Goods | 9 | $162B |
|
||
| Insurance | 4 | $225B |
|
||
| Telecommunications | 2 | $144B |
|
||
| Pharmaceuticals | 2 | $112B |
|
||
| Media / Entertainment | 2 | $69B |
|
||
Price history
2 events — show timeline
- 2026-04-16 Pending — WNYREIS
- 2026-04-08 Listed $215,000 WNYREIS
Property tax history
+3.8%/yrLatest (2025): $5,064 · +1.1% YoY. Source: county tax records.
Cash-flow waterfall
monthlySold comps — $/sqft
last 12 mo · ≤1 miLoading sold comps…