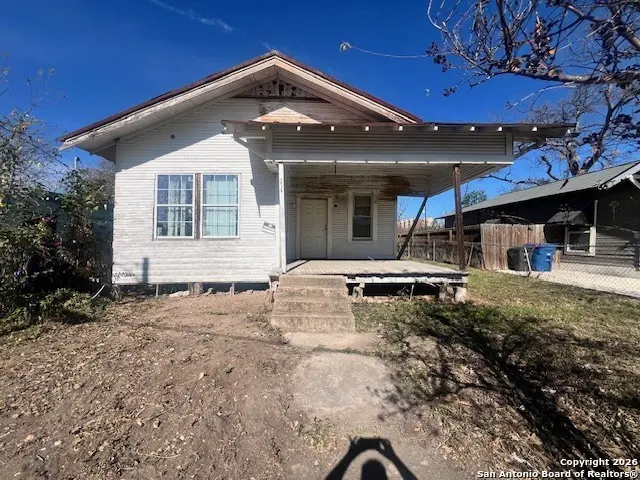
115 Glorietta · San Antonio, TX
Flood risk 1/10 · Minimal
- FEMA flood zone
- X (unshaded)
- Chance of flooding over 30 yrs
- 0.0%
- Est. flood insurance / yr
- $507 – $1,088
Fire risk 1/10 · Minimal
- Est. fire insurance / yr
- $1,222 – $2,270
Heat risk 8/10 · Major
- Hot days now (above 108°F)
- 7 days/yr
- Hot days in 30 yrs
- 22 days/yr
Wind risk 8/10 · Major
- Chance of severe wind over 30 yrs
- 80.0%
Air-quality risk 2/10 · Minimal
- Unhealthy air days now
- 1 days/yr
- Unhealthy air days in 30 yrs
- 2 days/yr
Risk factors via First Street. Map © Google.
Why this score? — see what drove the B grade
The composite is a weighted blend of 9 inputs, each scored 0–100. Each bar is that input's sub-score; the figure is the points it added to the 100-point composite (weight × sub-score).
- Cash flow +23.4/30.0
- ARV discount +15.0/15.0
- Appreciation +10.0/10.0
- DSCR +7.5/10.0
- 1% rule +6.2/10.0
- Rent growth +4.5/5.0
- Livability +4.0/5.0
- Condition / age +2.5/5.0
- Schools +1.4/10.0
$160,000
🖨 Deal sheet (PDF) 📄 Offer letter ✓ Due diligence
Listing remarks MLS
This home offers the unique charm of the 1900's w high ceilings & tons of natural light. You will find original wood floors/walls/ceilings throughout the entire home. The living room leads you to an open dining area which then leads to the oversized kitchen. One of the 3 bedrooms that faces the front of the home can easily be converted to an office or 2nd living room. There are 2 front doors & 2 back doors. With the right contractor you could turn this City Gem into a duplex or AIRBNB (See city regs) From the front porch you will be amazed with the city view of the Tower of Americas. This rare find places you at the heart of San Antonio's culture. You will be within walking distance of the Riverwalk, Rivercenter mall, famous haunted historic hotels, the Alamo Dome and the new Spurs arena. An investors dream that is completely fenced off for privacy.
Key facts
- Oversized kitchen
- Original wood floors
- 3,615 sq ft lot
Tags
Neighborhood map
What this means for you Summary
Snapshot
- This is a 3-bed/1.0-bath single-family listed at $160k.
Deal economics
- At list price, monthly cash flow is $297 ($4k/yr) — positive.
- The deal already cash-flows at list — no discount required.
- Meets the 1% rule at list price ($2k rent vs $160k).
- Recommended offer: $141k (12.0% below list) — sets the bar for market timing.
- Cap rate 8.5% vs local median 3.8% in San Antonio — top-decile yield for the area; either an underpriced asset or a hidden risk that comps aren't pricing in. Stress-test before assuming the spread holds.
Location & tenants
- Location reads 80/100 on livability (#31 in TX, #1,616 nationally) — a professional / high-income tenant draw. Strengths: amenities A+, commute A+, cost of living A+; Watch: schools C-, crime F.
- San Antonio ISD (urban): math 12% / reading 22% proficiency, ranked #805 of 826 in TX (top 98%) — low school quality limits family demand, transient renter base, plan for 1-2y turnover; 80% free/reduced lunch — lower-income household profile, screen leases tightly.
- Market conditions: Rents rising fast (+8.2%/yr); 201 active listings in the ZIP; 40 comparable units currently listed for rent nearby; rentals at typical pace (median 25d on market — plan ~3-4 weeks tenant-placement turnaround); 40% of comp listings sitting > 30 days — soft ceiling on asking rent; 8,308 units permitted in Bexar County in 2024 (2,506 in 5+ unit buildings).
- At $1,792/mo this rent would consume 45% of the median local household income ($47k/yr) (locally 543% of renters already pay >50% of income on rent) — very limited rent-growth headroom before tenants either downsize or default.
Forward outlook
- In year one you build about $17k of equity ($1k loan paydown + $16k appreciation (10.0% local appreciation)).
- Bexar County population projected at +50% by 2050 — long-run rental-demand tailwind backs the buy-and-hold thesis.
- At projected returns (10.0% appreciation + 8.0% rent growth), your $45k cash investment doubles in ~3 years — after that, you're playing with house money.
- By year 3, paydown + projected appreciation supports a ~$43k cash-out refi (75% LTV) — recoverable capital for the next deal without selling this one.
Negotiation context
- It's been on market 166 days — a 12% lower offer ($141k) is reasonable based on typical stale-listing flexibility.
Risks & watch-outs
- Watch-outs: built in 1920 — expect roof / HVAC / electrical / plumbing capex.
- Climate carrying-cost: severe wind risk, 80% chance of damaging wind over 30y; extreme-heat days projected 7→22/yr by 2055 (HVAC capex compounding) — expect insurance premiums to compound above CPI over the hold.
Questions for the listing agent
- It's been on market 166 days. Have you received any prior offers? Is the seller open to a 12% concession, seller financing, or rate buy-down credit?
- Built in 1920 — when were the roof, HVAC, electrical panel, plumbing, and water heater last replaced?
- Why hasn't it sold? Are there any deal-killer items the seller is aware of (foundation, flood, title, zoning, code violations)?
- Is there a deadline driving the sale (1031 exchange, divorce, estate, relocation)? That informs how much negotiation room exists.
- Crime grade is F in this area — have there been break-ins, vandalism, or insurance claims at this property in the last 3 years? What carrier currently insures it and at what premium?
- What's the average days-on-market for RENTAL listings here right now (not sales)? A rising rental-DOM trend means longer vacancies and softer asking-rent achievability than the comps imply.
- What's the recent tenant-quality profile in this submarket — average credit score on applications, eviction rate, late-payment / NSF rate, and stable-employment percentage? A property-management company in the area should have these aggregated.
- How much new for-sale + rental construction is in the pipeline within 1–3 miles? Heavy new supply typically softens prices + rents 12–24 months out; constrained supply supports both.
Investment metrics
- 1% rule
- 1.12% ✓
- Cap rate
- 8.52%
- Cash-on-cash
- 7.95%
- DSCR
- 1.35
- GRM
- 7.4
CMA / ARV
- ARV (median comp)
- $273,530
- List price
- $160,000
- Delta
- -41.51%
- Verdict
- UNDERPRICED
- Comps
- 20 within 1.0 mi
Show comp detail 12 sales within ~0.75 mi
| Address | Dist | Beds/Ba | Sqft | Sold | Price | $/sf | Match |
|---|---|---|---|---|---|---|---|
| 1108 E Crockett | 0.19mi | 2/1.5 (-1) | 1,082 (+1%) | 8mo | $184,000 | $170 | 76 |
| 204 Gorman | 0.37mi | 2/2.0 (-1) | 1,054 (-1%) | 3mo | $245,000 | $232 | 69 |
| 815 Burnet St | 0.36mi | 2/1.0 (-1) | 1,000 (-6%) | 0mo | $299,900 | $300 | 67 |
| 1019 Nolan | 0.44mi | 3/1.0 | 1,184 (+11%) | 2mo | $210,000 | $177 | 60 |
| 903 Dakota | 0.70mi | 2/1.0 (-1) | 1,064 (-0%) | 3mo | $168,000 | $158 | 59 |
| 418 S Olive | 0.66mi | 3/1.0 | 1,056 (-1%) | 12mo | $150,000 | $142 | 57 |
| 426 N Monumental St | 0.38mi | 2/1.5 (-1) | 960 (-10%) | 2mo | $209,000 | $218 | 57 |
| 1206 Nolan | 0.57mi | 2/1.0 (-1) | 987 (-8%) | 9mo | $145,000 | $147 | 48 |
| 1007 N Cherry St | 0.59mi | 2/2.0 (-1) | 996 (-7%) | 14mo | $169,000 | $170 | 40 |
| 321 S Olive | 0.59mi | 3/2.0 | 1,209 (+13%) | 8mo | $204,500 | $169 | 40 |
| 418 Muncey | 0.61mi | 2/1.0 (-1) | 936 (-12%) | 8mo | $165,000 | $176 | 39 |
| 1118 Hays St | 0.68mi | 2/1.0 (-1) | 944 (-12%) | 14mo | $200,000 | $212 | 32 |
Match score weights: distance 35% · size 25% · config 20% · recency 20%. Top-matched comps best support the ARV.
Projected returns pro-forma
10.0% appreciation · 8.0% rent growth · sell at horizon
- IRR
- 32.2%
- Equity multiple
- 3.58×
- Total profit
- $115,556
- Equity at exit
- $144,141
- IRR
- 29.5%
- Equity multiple
- 8.79×
- Total profit
- $348,954
- Equity at exit
- $310,845
Cash invested: $44,800 (down + closing). Projections, not guarantees.
Landlord ↔ Tenant lean methodology
- Overall (STATE)
- 87 Strongly Landlord-Friendly
- State Texas
- 87 Strongly Landlord-Friendly · R+5
- County
- — inherits STATE
- City
- — inherits STATE
ZIP-level market 78202
- Home prices YoY
- 27.0%
- Rents YoY
- 8.2%
- Active inventory
- 201
- Price-to-rent
- 7.4×
Monthly cashflow live
- Estimated rent
- $1,792 high interval (Pro) →
- Mortgage (P&I)
- −$839
- Tax from tax record
- −$213 /mo · $2,557/yr
- Insurance
- −$67
- HOA
- −$0
- Vacancy / Maint / Mgmt
- −$376
- Net cashflow
- $297
Break-even live
Sensitivity live
| Price | -10% $387 | -5% $342 | +0% $297 | +5% $252 | +10% $206 |
|---|---|---|---|---|---|
| Rent | -10% $155 | -5% $226 | +0% $297 | +5% $368 | +10% $438 |
| Rate | -1.0pp $377 | -0.5pp $338 | base $297 | +0.5pp $255 | +1.0pp $213 |
UW: 25.0% down · 7.5% · 30yr · 1.5% tax · 5.0% vac · 8.0% maint · 8.0% mgmt
Financing live
Cash to close
- Down payment
- $40,000
- Closing costs
- $4,800
- Reserves months
- —
- Total cash needed
- —
Loan-product check · same deal, 3 products live
Conventional
25% down · 7.5% · 30yr
- Down + closing
- —
- Monthly P&I
- —
- Monthly cashflow
- —
- DSCR
- —
- Eligible?
- —
Personal DTI + credit; lowest rate.
DSCR
20% down · 8.5% · 30yr
- Down + closing
- —
- Monthly P&I
- —
- Monthly cashflow
- —
- DSCR
- —
- Eligible?
- —
No personal income docs; deal must DSCR.
Hard money
10% down · 12.0% · 12mo
- Down + closing
- —
- Monthly P&I
- —
- Monthly cashflow
- —
- DSCR
- —
- Eligible?
- —
Short-term bridge; refi at stabilization.
Rent comps 40 comps
| Address | Beds | Baths | Sqft | Rent | $/sqft | DOM | Units | Dist |
|---|---|---|---|---|---|---|---|---|
| 431 N Mesquite St San Antonio, TX | 3.0 | 2.0 | 1220 | $1,750 | $1.43 | 16d | 1 | 0.10mi |
| 603 N Mesquite St San Antonio, TX | 3.0 | 2.5 | 1333 | $1,750 | $1.31 | 25d | 1 | 0.19mi |
| 239 Center St San Antonio, TX | 2.0 | 1.0–2.0 | 842 | $1,750 | $2.08 | 3d | 18 | 0.31mi |
| 215 Center St #307 San Antonio, TX | 2.0 | 2.0 | 1424 | $2,350 | $1.65 | 25d | 1 | 0.32mi |
| 215 Center St #307 San Antonio, TX | 2.0 | 2.0 | 1424 | $2,350 | $1.65 | 21d | 1 | 0.32mi |
| 704 N Cherry St Unit 704 San Antonio, TX | 2.0 | 2.5 | 1200 | $1,800 | $1.50 | 45d | 1 | 0.32mi |
| 511 N Monumental San Antonio, TX | 2.0 | 2.0 | 1206 | $1,595 | $1.32 | 5d | 1 | 0.35mi |
| 325 Montana St San Antonio, TX | 2.0 | 2.0 | 840 | $2,475 | $2.95 | 45d | 1 | 0.44mi |
| 630 Montana St Unit 301 San Antonio, TX | 2.0 | 2.0 | 1320 | $2,250 | $1.70 | 16d | 1 | 0.51mi |
| 811 Montana St Unit 1301 San Antonio, TX | 2.0 | 2.0 | 1240 | $1,800 | $1.45 | 45d | 1 | 0.54mi |
| 802 Montana St Unit 2 San Antonio, TX | 3.0 | 1.0 | 1440 | $1,500 | $1.04 | 12d | 1 | 0.55mi |
| 103 Saint Charles Unit NA San Antonio, TX | 2.0 | 2.0 | 995 | $1,300 | $1.31 | 45d | 1 | 0.58mi |
| 1205 Wyoming St San Antonio, TX | 2.0 | 2.0 | 1114 | $2,300 | $2.06 | 45d | 1 | 0.58mi |
| 1123 N Olive St San Antonio, TX | 2.0 | 1.0 | 840 | $1,600 | $1.90 | 25d | 1 | 0.60mi |
| 431 S Mesquite St San Antonio, TX | 3.0 | 2.0 | 1220 | $1,750 | $1.43 | 17d | 1 | 0.62mi |
| 723 Paso Hondo San Antonio, TX | 3.0 | 1.0 | 1224 | $1,500 | $1.23 | 45d | 1 | 0.63mi |
| 1225 Burnet St Unit 101 San Antonio, TX | 3.0 | 2.0 | 1218 | $1,850 | $1.52 | 45d | 1 | 0.63mi |
| 155 Canton San Antonio, TX | 2.0 | 2.0 | 1078 | $1,250 | $1.16 | 25d | 1 | 0.63mi |
| 118 Canadian St San Antonio, TX | 3.0 | 2.0 | 1232 | $2,300 | $1.87 | 45d | 1 | 0.64mi |
| 210 Piedmont Ave Unit 101 San Antonio, TX | 2.0 | 2.5 | 1050 | $1,395 | $1.33 | 45d | 1 | 0.64mi |
| 610 E Market St #2915 San Antonio, TX | 2.0 | 2.0 | 1497 | $3,800 | $2.54 | 23d | 1 | 0.64mi |
| 821 Burleson San Antonio, TX | 2.0 | 2.5 | 1456 | $1,629 | $1.12 | 45d | 1 | 0.66mi |
| 1419 Wyoming St San Antonio, TX | 2.0 | 1.0 | 1232 | $1,550 | $1.26 | 5d | 1 | 0.67mi |
| 415 S Olive St San Antonio, TX | 3.0 | 2.0 | 1348 | $2,600 | $1.93 | 45d | 1 | 0.67mi |
| 620 Potomac San Antonio, TX | 2.0 | 1.0 | 900 | $1,050 | $1.17 | 23d | 1 | 0.67mi |
| 103 Saint John San Antonio, TX | 2.0 | 1.0 | 943 | $1,245 | $1.32 | 45d | 1 | 0.71mi |
| 603 S Mesquite St San Antonio, TX | 3.0 | 2.5 | 1333 | $1,750 | $1.31 | 23d | 1 | 0.73mi |
| 1021 N Alamo St San Antonio, TX | 2.0 | 1.0 | 1202 | $2,000 | $1.66 | 45d | 1 | 0.74mi |
| 313 Toledo San Antonio, TX | 2.0 | 1.0 | 924 | $1,400 | $1.52 | 12d | 1 | 0.74mi |
| 316 Toledo St Unit 102 San Antonio, TX | 2.0 | 2.0 | 1168 | $2,200 | $1.88 | 45d | 1 | 0.76mi |
| 1102 Burleson San Antonio, TX | 3.0 | 2.0 | 1400 | $2,500 | $1.79 | 25d | 1 | 0.79mi |
| 231 Cactus St San Antonio, TX | 2.0 | 1.0 | 876 | $1,195 | $1.36 | 25d | 1 | 0.80mi |
| 850 Nevada St Unit NA San Antonio, TX | 2.0 | 1.0 | 1345 | $1,795 | $1.33 | 13d | 1 | 0.81mi |
| 891 Avenue B San Antonio, TX | 2.0 | 2.0 | 1053 | $1,777 | $1.69 | 45d | 1 | 0.83mi |
| 1615 Nolan St Unit A San Antonio, TX | 2.0 | 1.0 | 1066 | $1,400 | $1.31 | 12d | 1 | 0.83mi |
| 110 Labor St Unit 710 San Antonio, TX | 2.0 | 2.0 | 994 | $1,681 | $1.69 | 4d | 1 | 0.86mi |
| 110 Labor St Unit 9004 San Antonio, TX | 2.0 | 2.0 | 1054 | $1,750 | $1.66 | 45d | 1 | 0.86mi |
| 109 Gravel St San Antonio, TX | 3.0 | 1.0 | 900 | $1,250 | $1.39 | 25d | 1 | 0.87mi |
| 401 Santos St San Antonio, TX | 1.0–2.0 | 1.0–2.0 | 927 | $1,478 | $1.59 | 5d | 12 | 0.87mi |
| 120 9th St San Antonio, TX | 1.0–2.0 | 1.0–2.0 | 923 | $1,757 | $1.90 | 3d | 20 | 0.88mi |
Listing history 15 events
-
2026-06-21days on market $160,000 Active 166 DOM
-
2026-06-18days on market $160,000 Active 163 DOM
-
2026-06-17days on market $160,000 Active 162 DOM
-
2026-06-16days on market $160,000 Active 161 DOM
-
2026-06-15days on market $160,000 Active 160 DOM
-
2026-06-13days on market $160,000 Active 158 DOM
-
2026-06-09days on market $160,000 Active 154 DOM
-
2026-06-08days on market $160,000 Active 153 DOM
-
2026-06-07days on market $160,000 Active 152 DOM
-
2026-06-04days on market $160,000 Active 149 DOM
-
2026-06-03days on market $160,000 Active 148 DOM
-
2026-06-02days on market $160,000 Active 147 DOM
-
2026-06-01days on market $160,000 Active 146 DOM
-
2026-05-31days on market $160,000 Active 145 DOM
-
2026-01-06$160,000 New 869-char remark
Show marketing remark (869 chars)
This home offers the unique charm of the 1900's w high ceilings & tons of natural light. You will find original wood floors/walls/ceilings throughout the entire home. The living room leads you to an open dining area which then leads to the oversized kitchen. One of the 3 bedrooms that faces the front of the home can easily be converted to an office or 2nd living room. There are 2 front doors & 2 back doors. With the right contractor you could turn this City Gem into a duplex or AIRBNB (See city regs) From the front porch you will be amazed with the city view of the Tower of Americas. This rare find places you at the heart of San Antonio's culture. You will be within walking distance of the Riverwalk, Rivercenter mall, famous haunted historic hotels, the Alamo Dome and the new Spurs arena. An investors dream that is completely fenced off for privacy.
ⓘ Source: listings_history table (triggers on properties + properties_extension) + one-shot
backfill from property_details.listing_events for pre-trigger history.
Tax reassessment forecast TX · Resets to sale price
- Current annual tax
- $2,557 · $213/mo
- Projected year-2 tax
- $2,928 · $244/mo
- Expected delta
- +$371/yr (+$31/mo · 14.5%)
ⓘ Screening estimate from a state-policy table — verify with the county assessor before closing.
Climate risk First Street
- Flood 1/10 Low FEMA zone X (unshaded) · 0% chance over 30 yrs
- Wildfire 1/10 Low
- Heat 8/10 Severe 7 d/yr ≥108°F today · 22 d/yr by 30 yrs out
- Wind 8/10 Severe 80% chance of damaging wind over 30 yrs
- Air quality 2/10 Low 1 unhealthy d/yr today · 2 by 30 yrs out
Nearby sold comps map
Loading sold comps map…
Walkable amenities ~0.75 mi
Loading nearby amenities…
Taxation est. · year 1
- Rental income
- $21,504
- − Mortgage interest
- −$8,962
- − Property taxes
- −$2,557
- − Insurance
- −$800
- − Repairs & maintenance
- −$1,720
- − Management
- −$1,720
- − Depreciation
- −$4,655
- Taxable income
- $1,090
- Est. tax owed @ 24.0%
- −$262
- After-tax cash flow
- $3,301/yr
For passive investors: Depreciation is non-cash, so a rental often shows a tax loss while cash-flowing — sheltering income. Rental losses are passive: they offset passive income freely, and up to $25,000/yr can offset ordinary (W-2) income if you actively participate and your MAGI is under $100k (phasing out to $0 by $150k); unused losses carry forward. On sale, claimed depreciation is recaptured at up to 25%, and gains may owe capital-gains tax (a 1031 exchange can defer both). Figures are a year-1 estimate at your 24.0% rate — not tax advice; consult a CPA.
Schools (NCES district)
- District
- San Antonio ISD
- NCES district ID
- 4838730
- Math proficiency
- 12% ▼ -21.00%
- Reading proficiency
- 22% ▼ -7.00%
- Median HH income
- $30,952
- Composite
- 13.57/100
- National rank
- #9512
- State rank
- #805 of 826 in TX
Livability — San Antonio
- Score
- 80/100
- State rank
- #31
- US rank
- #1616
Category grades
Schools grade is shown separately in the Schools card above.
Census & demographics
- Census place
- San Antonio, TX
- County
- Bexar County · 1,990,555 people
- City population
- 1,806,925
- Metro
- San Antonio-New Braunfels, TX
- Population (ZIP)
- 10,224
- Household income
- $47,478
- Rent vs Own
- Severe rent burden
- 543.0
Population outlook (Bexar County) Hauer SSP2
- Today (2025)
- 2,336,851 people
- By 2030
- 2,560,728 · +9.6%
- By 2040
- 3,020,569 · +29.3%
- By 2050
- 3,493,522 · +49.5%
- By 2075
- 4,668,459 · +99.8%
- By 2100
- 5,533,242 · +136.8%
Race, ethnicity, and origin ACS 2023
- Neighborhood character
- Predominantly Hispanic (66%)
- Race & ethnicity
- Hispanic / Latino 66% Two or more races 28% White 17% Black 16% Native American 1%
- Hispanic origin (detail)
- Mexican 57% Puerto Rican 1% Cuban 1%
- Common ancestry
- Italian 2% Slovak 1%
- Foreign-born
- 14% · Canada
- Languages at home
- 59% English-only · Spanish 41%
Political lean MEDSL · Bexar
- 2024 margin
- Lean D (+9.8) · D 54.3% · R 44.6% · Other 1.1%
- 2008→2024 swing
- +4.2pp toward D · 2008: 5.6pp · 2024: 9.8pp
- All cycles
- 2024: D+9.8 2020: D+18.2 2016: D+13.5 2012: D+4.6 2008: D+5.6
Not yet ingested
- Civics
- —
Market trends
- HPI YoY
- ▲ 53.82%
- Current HPI
- 253.3196
- Rent YoY
- ▲ 8.20%
- Metro
- San Antonio-New Braunfels, TX
- State GDP YoY
- ▲ 3.95%
- F500 in state
- 110
Industry mix (Fortune 500 HQ in TX)
| Industry | F500 HQs | Revenue |
|---|---|---|
| Energy | 16 | $1,198B |
|
||
| Technology | 5 | $198B |
|
||
| Engineering / Construction | 4 | $72B |
|
||
| Energy Services | 3 | $60B |
|
||
| Utilities | 3 | $41B |
|
||
| Healthcare | 2 | $330B |
|
||
Price history
1 event — show timeline
- 2026-01-06 Listed $160,000 LERA
Property tax history
+8.6%/yrLatest (2025): $2,557 · +0.0% YoY. Source: county tax records.
Cash-flow waterfall
monthlySold comps — $/sqft
last 12 mo · ≤1 miLoading sold comps…