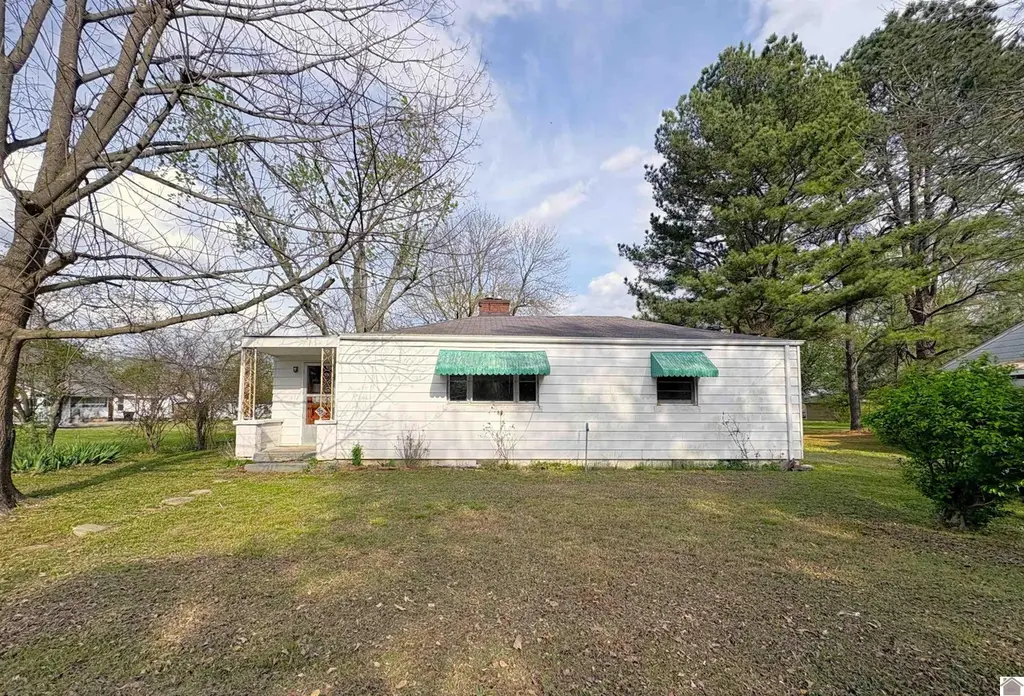
601 Broad St · Murray, KY
Flood risk 1/10 · Minimal
- FEMA flood zone
- X (unshaded)
- Chance of flooding over 30 yrs
- 0.0%
- Est. flood insurance / yr
- $507 – $1,088
Fire risk 3/10 · Minor
- Est. fire insurance / yr
- $839 – $1,559
Heat risk 5/10 · Moderate
- Hot days now (above 108°F)
- 7 days/yr
- Hot days in 30 yrs
- 20 days/yr
Wind risk 4/10 · Minor
- Chance of severe wind over 30 yrs
- 9.0%
Air-quality risk 1/10 · Minimal
- Unhealthy air days now
- 0 days/yr
- Unhealthy air days in 30 yrs
- 0 days/yr
Risk factors via First Street. Map © Google.
Why this score? — see what drove the B+ grade
The composite is a weighted blend of 9 inputs, each scored 0–100. Each bar is that input's sub-score; the figure is the points it added to the 100-point composite (weight × sub-score).
- Cash flow +30.0/30.0
- ARV discount +15.0/15.0
- 1% rule +10.0/10.0
- DSCR +10.0/10.0
- Schools +5.0/10.0
- Rent growth +4.3/5.0
- Livability +3.1/5.0
- Condition / age +2.5/5.0
- Appreciation +0.0/10.0
$67,000
🖨 Deal sheet 📄 Offer letter ✓ Due diligence
Listing remarks MLS
Great investment opportunity! This home offers spacious rooms, kitchen with ample storage and counter space, a designated dining room and loads of potential! With a clear renovation plan and imagination, this could be perfect for future rental income or a future starter/downsizer's home! Great location with quick and easy access to all the shops, restaurants and businesses in Murray!
Key facts
- Ample storage
- 4,550 sq ft lot
Tags
Neighborhood map
What this means for you Summary
Snapshot
- This is a 2-bed/1.0-bath single-family listed at $67k.
Deal economics
- At list price, monthly cash flow is $617 ($7k/yr) — positive.
- The deal already cash-flows at list — no discount required.
- Meets the 1% rule at list price ($1k rent vs $67k).
- Cap rate 17.3% vs local median 3.6% in Murray — top-decile yield for the area; either an underpriced asset or a hidden risk that comps aren't pricing in. Stress-test before assuming the spread holds.
Location & tenants
- Location reads 61/100 on livability (#380 in KY) — a middle-class / working-renter tenant base. Strengths: cost of living A+, crime A; Watch: amenities F, commute F, employment F.
- Murray Independent (town): math 58% / reading 63% proficiency, ranked #5 of 165 in KY (top 3%) — acceptable for families but not a draw, mixed tenant base, ~2y average lease.
- Market conditions: Rents rising fast (+7.2%/yr); 256 active listings in the ZIP; 4 comparable units currently listed for rent nearby; rentals lingering (median 44d on market — plan ~5-8 weeks vacancy on turnover, expect pricing pressure); 100% of comp listings sitting > 30 days — soft ceiling on asking rent; 81 units permitted in Calloway County in 2024 (66 in 5+ unit buildings).
- This rent runs 31% of the median local income ($50k/yr) — at the standard rent-burdened threshold; future hikes will face affordability resistance.
Forward outlook
- Local home prices are declining (-3.0%/yr); year-one equity from $463 of loan paydown is wiped out by about $2k of value loss. Plan a longer hold.
- Calloway County population projected at +18% by 2050 — long-run rental-demand tailwind backs the buy-and-hold thesis.
- At projected returns (-3.0% appreciation + 7.2% rent growth), your $19k cash investment doubles in ~3 years — after that, you're playing with house money.
Negotiation context
- Only 1 days on market — expect competitive offers; lowballing is unlikely to land.
- Current owner paid $14k; list at $67k implies a 362% gain — meaningful room to come down on a strong offer.
Risks & watch-outs
- Climate carrying-cost: extreme-heat days projected 7→20/yr by 2055 (HVAC capex compounding) — expect insurance premiums to compound above CPI over the hold.
Questions for the listing agent
- Is there a deadline driving the sale (1031 exchange, divorce, estate, relocation)? That informs how much negotiation room exists.
- Schools are B-rated — typically a magnet for longer-tenancy family renters. What's the average tenant stay here, and is there a school-zone premium baked into asking?
- What's the average days-on-market for RENTAL listings here right now (not sales)? A rising rental-DOM trend means longer vacancies and softer asking-rent achievability than the comps imply.
- What's the recent tenant-quality profile in this submarket — average credit score on applications, eviction rate, late-payment / NSF rate, and stable-employment percentage? A property-management company in the area should have these aggregated.
- How much new for-sale + rental construction is in the pipeline within 1–3 miles? Heavy new supply typically softens prices + rents 12–24 months out; constrained supply supports both.
Investment metrics
- 1% rule
- 1.92% ✓
- Cap rate
- 17.34%
- Cash-on-cash
- 39.45%
- DSCR
- 2.76
- GRM
- 4.3
CMA / ARV
- ARV (median comp)
- $122,900
- List price
- $67,000
- Delta
- -45.48%
- Verdict
- UNDERPRICED
- Comps
- 20 within 1.0 mi
Show comp detail 12 sales within ~0.75 mi
| Address | Dist | Beds/Ba | Sqft | Sold | Price | $/sf | Match |
|---|---|---|---|---|---|---|---|
| 903 Vine St | 0.34mi | 2/1.0 | 958 (-5%) | 8mo | $153,000 | $160 | 69 |
| 609 S 9th St | 0.21mi | 2/1.0 | 871 (-14%) | 2mo | $125,000 | $144 | 65 |
| 500 Chantilly Dr | 0.59mi | 2/2.0 | 1,033 (+2%) | 4mo | $157,000 | $152 | 62 |
| 610 S 9th St | 0.24mi | 2/1.0 | 878 (-13%) | 10mo | $30,000 | $34 | 58 |
| 412 Sycamore St | 0.18mi | 3/1.0 (+1) | 1,140 (+13%) | 10mo | $77,500 | $68 | 57 |
| 515 Whitnell Ave | 0.59mi | 3/1.0 (+1) | 999 (-1%) | 12mo | $189,000 | $189 | 56 |
| 316 S 13th St | 0.55mi | 2/1.0 | 1,094 (+8%) | 11mo | $162,000 | $148 | 51 |
| 321 Irvan St | 0.65mi | 3/1.0 (+1) | 1,060 (+5%) | 9mo | $185,000 | $175 | 48 |
| 319 Irvan St | 0.65mi | 2/1.0 | 864 (-14%) | 7mo | $135,000 | $156 | 40 |
| 114 N 7th St | 0.70mi | 2/1.0 | 868 (-14%) | 7mo | $122,000 | $141 | 38 |
| 520 S 13th St | 0.57mi | 3/1.0 (+1) | 1,156 (+14%) | 9mo | $165,000 | $143 | 37 |
| 113 N 9th St | 0.72mi | 3/1.5 (+1) | 1,126 (+11%) | 10mo | $180,000 | $160 | 32 |
Match score weights: distance 35% · size 25% · config 20% · recency 20%. Top-matched comps best support the ARV.
Projected returns pro-forma
-3.0% appreciation · 7.18% rent growth · sell at horizon
- IRR
- 40.1%
- Equity multiple
- 2.81×
- Total profit
- $34,032
- Equity at exit
- $9,990
- IRR
- 48.3%
- Equity multiple
- 6.61×
- Total profit
- $105,316
- Equity at exit
- $5,793
Cash invested: $18,760 (down + closing). Projections, not guarantees.
Landlord ↔ Tenant lean methodology
- Overall (STATE)
- 83 Strongly Landlord-Friendly
- State Kentucky
- 83 Strongly Landlord-Friendly · R+16
- County
- — inherits STATE
- City
- — inherits STATE
ZIP-level market 42071
- Home prices YoY
- -8.5%
- Rents YoY
- 7.2%
- Active inventory
- 256
- Price-to-rent
- 4.3×
Monthly cashflow live
- Estimated rent
- $1,285 medium interval (Pro) →
- Mortgage (P&I)
- −$351
- Tax from tax record
- −$19 /mo · $228/yr
- Insurance
- −$28
- HOA
- −$0
- Vacancy / Maint / Mgmt
- −$270
- Net cashflow
- $617
Break-even live
UW: 25.0% down · 7.5% · 30yr · 1.5% tax · 5.0% vac · 8.0% maint · 8.0% mgmt
Financing live
Cash to close
- Down payment
- $16,750
- Closing costs
- $2,010
- Reserves months
- —
- Total cash needed
- —
Loan-product check · same deal, 3 products live
Conventional
25% down · 7.5% · 30yr
- Down + closing
- —
- Monthly P&I
- —
- Monthly cashflow
- —
- DSCR
- —
- Eligible?
- —
Personal DTI + credit; lowest rate.
DSCR
20% down · 8.5% · 30yr
- Down + closing
- —
- Monthly P&I
- —
- Monthly cashflow
- —
- DSCR
- —
- Eligible?
- —
No personal income docs; deal must DSCR.
Hard money
10% down · 12.0% · 12mo
- Down + closing
- —
- Monthly P&I
- —
- Monthly cashflow
- —
- DSCR
- —
- Eligible?
- —
Short-term bridge; refi at stabilization.
Rent comps 4 comps
| Address | Beds | Baths | Sqft | Rent | $/sqft | DOM | Units | Dist |
|---|---|---|---|---|---|---|---|---|
| 400a Main St Murray, KY | 2.0 | 1.0 | 1200 | $1,298 | $1.08 | 43d | 1 | 0.67mi |
| 104 Williams Ave Murray, KY | 3.0 | 2.0 | 1200 | $1,698 | $1.42 | 43d | 1 | 1.26mi |
| 102 Williams Ave Unit A Murray, KY | 2.0 | 1.0 | 845 | $1,300 | $1.54 | 43d | 1 | 1.26mi |
| 1634 Hamilton Ave Murray, KY | 2.0 | 1.0 | 930 | $1,099 | $1.18 | 44d | 1 | 1.47mi |
Listing history 18 events
-
2026-06-19days on market $67,000 Active 1 DOM
-
2026-06-18days on market $67,000 Active 73 DOM
-
2026-06-17days on market $67,000 Active 72 DOM
-
2026-06-16days on market $67,000 Active 71 DOM
-
2026-06-15days on market $67,000 Active 70 DOM
-
2026-06-14days on market $67,000 Active 68 DOM
-
2026-06-12days on market $67,000 Active 67 DOM
-
2026-06-09days on market $67,000 Active 64 DOM
-
2026-06-08days on market $67,000 Active 63 DOM
-
2026-06-07days on market $67,000 Active 62 DOM
-
2026-06-05days on market $67,000 Active 59 DOM
-
2026-06-02days on market $67,000 Active 57 DOM
-
2026-06-01days on market $67,000 Active 56 DOM
-
2026-05-31days on market $67,000 Active 55 DOM
-
2026-05-30days on market $67,000 Active 54 DOM
-
2026-05-01price $67,000 386-char remark
Show marketing remark (386 chars)
Great investment opportunity! This home offers spacious rooms, kitchen with ample storage and counter space, a designated dining room and loads of potential! With a clear renovation plan and imagination, this could be perfect for future rental income or a future starter/downsizer's home! Great location with quick and easy access to all the shops, restaurants and businesses in Murray!
-
2026-04-03$69,000 Active 386-char remark
Show marketing remark (386 chars)
Great investment opportunity! This home offers spacious rooms, kitchen with ample storage and counter space, a designated dining room and loads of potential! With a clear renovation plan and imagination, this could be perfect for future rental income or a future starter/downsizer's home! Great location with quick and easy access to all the shops, restaurants and businesses in Murray!
-
1982-06-01soldstatus $14,500
ⓘ Source: listings_history table (triggers on properties + properties_extension) + one-shot
backfill from property_details.listing_events for pre-trigger history.
Tax reassessment forecast KY · Resets to sale price
- Current annual tax
- $228 · $19/mo
- Projected year-2 tax
- $576 · $48/mo
- Expected delta
- +$349/yr (+$29/mo · 153.1%)
ⓘ Screening estimate from a state-policy table — verify with the county assessor before closing.
Climate risk First Street
- Flood 1/10 Low FEMA zone X (unshaded) · 0% chance over 30 yrs
- Wildfire 3/10 Moderate
- Heat 5/10 Major 7 d/yr ≥108°F today · 20 d/yr by 30 yrs out
- Wind 4/10 Moderate 9% chance of damaging wind over 30 yrs
- Air quality 1/10 Low 0 unhealthy d/yr today · 0 by 30 yrs out
Nearby sold comps map
Loading sold comps map…
Walkable amenities ~0.75 mi
Loading nearby amenities…
Taxation est. · year 1
- Rental income
- $15,417
- − Mortgage interest
- −$3,753
- − Property taxes
- −$228
- − Insurance
- −$335
- − Repairs & maintenance
- −$1,233
- − Management
- −$1,233
- − Depreciation
- −$1,949
- Taxable income
- $6,685
- Est. tax owed @ 24.0%
- −$1,605
- After-tax cash flow
- $5,796/yr
For passive investors: Depreciation is non-cash, so a rental often shows a tax loss while cash-flowing — sheltering income. Rental losses are passive: they offset passive income freely, and up to $25,000/yr can offset ordinary (W-2) income if you actively participate and your MAGI is under $100k (phasing out to $0 by $150k); unused losses carry forward. On sale, claimed depreciation is recaptured at up to 25%, and gains may owe capital-gains tax (a 1031 exchange can defer both). Figures are a year-1 estimate at your 24.0% rate — not tax advice; consult a CPA.
Schools (NCES district)
- District
- Murray Independent
- NCES district ID
- 2104380
- Math proficiency
- 58% ▼ -15.00%
- Reading proficiency
- 63% ▼ -14.00%
- Median HH income
- $37,625
- Composite
- 50.29/100
- National rank
- #1882
- State rank
- #5 of 165 in KY
Livability — Murray
- Score
- 61/100
- State rank
- #380
- US rank
- #18091
Category grades
Schools grade is shown separately in the Schools card above.
Census & demographics
- Census place
- Murray, KY
- County
- Calloway County · 30,981 people
- City population
- 30,981
- Metro
- Murray, KY
- Population (ZIP)
- 30,981
- Household income
- $50,198
- Rent vs Own
- Severe rent burden
- 1046.0
Population outlook (Calloway County) Hauer SSP2
- Today (2025)
- 41,071 people
- By 2030
- 42,608 · +3.7%
- By 2040
- 45,435 · +10.6%
- By 2050
- 48,501 · +18.1%
- By 2075
- 56,481 · +37.5%
- By 2100
- 63,271 · +54.1%
Race, ethnicity, and origin ACS 2023
- Neighborhood character
- Predominantly White (87%)
- Race & ethnicity
- White 87% Black 4% Hispanic / Latino 3% Two or more races 3% Asian 2%
- Common ancestry
- Italian 3% Lithuanian 2% Slovak 2%
- Foreign-born
- 4% · Canada
- Languages at home
- 96% English-only · Spanish 2% Other Asian/Pacific 1% Other Indo-European 1%
Political lean MEDSL · Calloway
- 2024 margin
- Solid R (+38.0) · D 30.2% · R 68.1% · Other 1.7%
- 2008→2024 swing
- -19.6pp toward R · 2008: -18.4pp · 2024: -38.0pp
- All cycles
- 2024: R+38.0 2020: R+31.8 2016: R+35.0 2012: R+27.4 2008: R+18.4
Not yet ingested
- Civics
- —
Market trends
- HPI YoY
- ▼ -25.43%
- Current HPI
- 274.5366
- Rent YoY
- ▲ 7.18%
- Metro
- Murray, KY
- State GDP YoY
- ▲ 1.81%
- F500 in state
- 4
Industry mix (Fortune 500 HQ in KY)
| Industry | F500 HQs | Revenue |
|---|---|---|
| Healthcare | 1 | $118B |
|
||
| Food / Beverage | 1 | $7B |
|
||
Price history
+362.1% since first listed3 events — show timeline
- 2026-05-01 Price Changed $67,000 WKRMLS
- 2026-04-03 Listed $69,000 WKRMLS
- 1982-06-01 Sold (Public Records) $14,500 Public Records
Property tax history
-3.6%/yrLatest (2025): $228 · +22.6% YoY. Source: county tax records.
Cash-flow waterfall
monthlySold comps — $/sqft
last 12 mo · ≤1 miLoading sold comps…