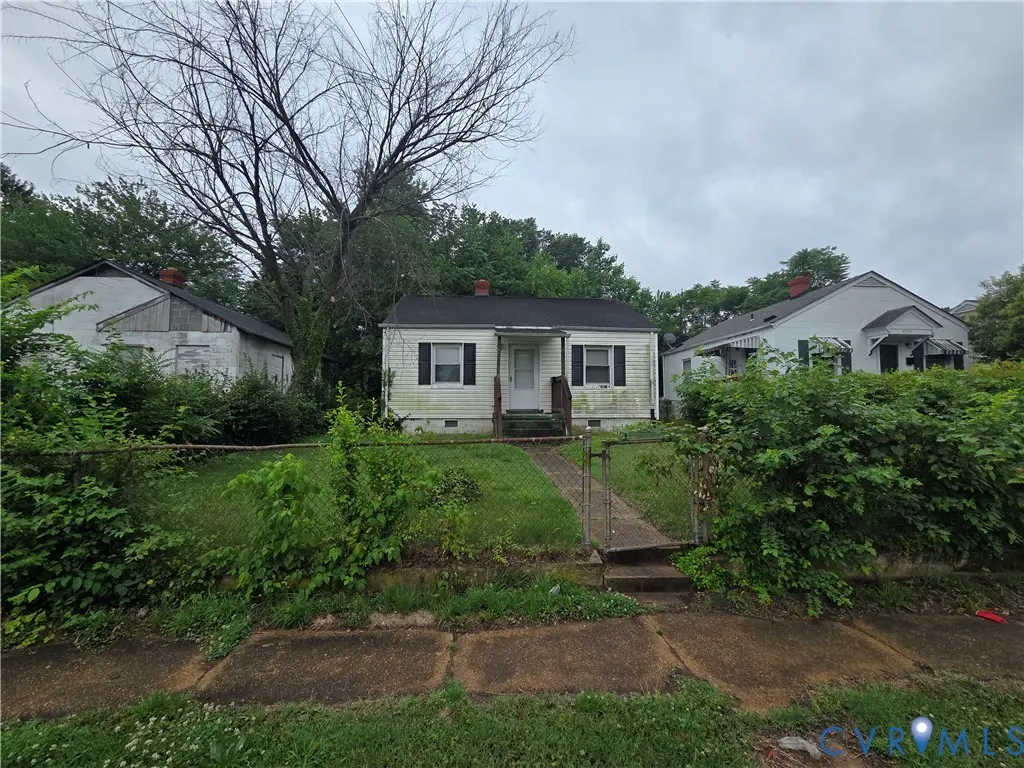
2511 Redwood · Richmond, VA
Flood risk 1/10 · Minimal
- FEMA flood zone
- X (unshaded)
- Chance of flooding over 30 yrs
- 0.0%
- Est. flood insurance / yr
- $507 – $1,088
Fire risk 1/10 · Minimal
- Est. fire insurance / yr
- $666 – $1,236
Heat risk 7/10 · Major
- Hot days now (above 105°F)
- 7 days/yr
- Hot days in 30 yrs
- 16 days/yr
Wind risk 6/10 · Moderate
- Chance of severe wind over 30 yrs
- 27.0%
Air-quality risk 2/10 · Minimal
- Unhealthy air days now
- 1 days/yr
- Unhealthy air days in 30 yrs
- 3 days/yr
Risk factors via First Street. Map © Google.
Why this score? — see what drove the B+ grade
The composite is a weighted blend of 9 inputs, each scored 0–100. Each bar is that input's sub-score; the figure is the points it added to the 100-point composite (weight × sub-score).
- Cash flow +30.0/30.0
- ARV discount +15.0/15.0
- DSCR +10.0/10.0
- 1% rule +9.1/10.0
- Livability +4.2/5.0
- Rent growth +4.1/5.0
- Schools +3.3/10.0
- Condition / age +2.5/5.0
- Appreciation +0.0/10.0
$114,900
🖨 Deal sheet 📄 Offer letter ✓ Due diligence
Listing remarks MLS
GREAT RENTAL PROPERTY OR STARTER HOME
Key facts
- Strong bones
- Local shopping
- Built 1949
Tags
Property features AI
Finance
- Other: Above-grade finished area reported (698); Tax information available
Exterior
- Parking: Off-street parking; On-street parking
- Utilities: Public water; Public sewer
- Home design: Single-story home; Vinyl siding exterior; Asphalt roof
- Construction: Built (actual year reported); Vinyl siding construction; Asphalt roof
- Exterior features: Off-street and on-street parking available
Interior
- Bedrooms: Total of 4 rooms (includes living spaces and sleeping areas)
- Bathrooms: 1 full bathroom with tub and shower (on the first level)
- Heating & cooling: Central air conditioning; Heating available via electric and natural gas
- Interior features: Resale condition
Neighborhood map
What this means for you Summary
Snapshot
- This is a 3-bed/1.0-bath single-family listed at $115k.
Deal economics
- At list price, monthly cash flow is $555 ($7k/yr) — positive.
- The deal already cash-flows at list — no discount required.
- Meets the 1% rule at list price ($2k rent vs $115k).
- Cap rate 12.1% vs local median 3.3% in Richmond — top-decile yield for the area; either an underpriced asset or a hidden risk that comps aren't pricing in. Stress-test before assuming the spread holds.
Location & tenants
- Location reads 84/100 on livability (#33 in VA, #793 nationally) — a professional / high-income tenant draw. Strengths: amenities A+, commute A+, health & safety A+; Watch: crime D-.
- Richmond City Public School District (urban): math 32% / reading 47% proficiency, ranked #123 of 131 in VA (top 94%) — families likely to look elsewhere, expect single-tenant / working-renter base with shorter leases; 74% free/reduced lunch — lower-income household profile, screen leases tightly.
- Market conditions: Rents rising fast (+6.4%/yr); 337 active listings in the ZIP; 40 comparable units currently listed for rent nearby; rentals at typical pace (median 21d on market — plan ~3-4 weeks tenant-placement turnaround); 2,540 units permitted in Richmond city in 2024 (2,077 in 5+ unit buildings).
- This rent runs 35% of the median local income ($56k/yr) — at the standard rent-burdened threshold; future hikes will face affordability resistance.
Forward outlook
- Local home prices are declining (-3.0%/yr); year-one equity from $794 of loan paydown is wiped out by about $3k of value loss. Plan a longer hold.
- Richmond County population projected at +40% by 2050 — long-run rental-demand tailwind backs the buy-and-hold thesis.
- At projected returns (-3.0% appreciation + 6.4% rent growth), your $32k cash investment doubles in ~6 years — after that, you're playing with house money.
Negotiation context
- Only 2 days on market — expect competitive offers; lowballing is unlikely to land.
- 3 sale attempts since 24y ago with the ask held roughly flat each time — persistent listings suggest the price (not the market) is what's stuck; bring a comps-based counter.
- Current owner paid $27k; list at $115k implies a 326% gain — meaningful room to come down on a strong offer.
Risks & watch-outs
- Watch-outs: built in 1949 — expect roof / HVAC / electrical / plumbing capex.
- Climate carrying-cost: major wind risk, 27% chance of damaging wind over 30y; extreme-heat days projected 7→16/yr by 2055 (HVAC capex compounding) — expect insurance premiums to compound above CPI over the hold.
Questions for the listing agent
- Built in 1949 — when were the roof, HVAC, electrical panel, plumbing, and water heater last replaced?
- Is there a deadline driving the sale (1031 exchange, divorce, estate, relocation)? That informs how much negotiation room exists.
- Schools are A-rated — typically a magnet for longer-tenancy family renters. What's the average tenant stay here, and is there a school-zone premium baked into asking?
- Crime grade is D in this area — have there been break-ins, vandalism, or insurance claims at this property in the last 3 years? What carrier currently insures it and at what premium?
- What's the average days-on-market for RENTAL listings here right now (not sales)? A rising rental-DOM trend means longer vacancies and softer asking-rent achievability than the comps imply.
- What's the recent tenant-quality profile in this submarket — average credit score on applications, eviction rate, late-payment / NSF rate, and stable-employment percentage? A property-management company in the area should have these aggregated.
- How much new for-sale + rental construction is in the pipeline within 1–3 miles? Heavy new supply typically softens prices + rents 12–24 months out; constrained supply supports both.
Investment metrics
- 1% rule
- 1.41% ✓
- Cap rate
- 12.09%
- Cash-on-cash
- 20.70%
- DSCR
- 1.92
- GRM
- 5.9
CMA / ARV
- ARV (on-the-fly)
- $184,970
- Comps found
- 12
Show comp detail 12 sales within ~0.75 mi
| Address | Dist | Beds/Ba | Sqft | Sold | Price | $/sf | Match |
|---|---|---|---|---|---|---|---|
| 2511 Redwood | 0.00mi | 2/1.0 (-1) | 698 (0%) | 0mo | $108,000 | $155 | 95 |
| 2502 Redwood Ave | 0.04mi | 2/1.0 (-1) | 698 (0%) | 7mo | $145,000 | $208 | 87 |
| 2517 Ford Ave | 0.11mi | 2/1.0 (-1) | 768 (+10%) | 10mo | $222,000 | $289 | 64 |
| 1813 N 24th St | 0.61mi | 2/1.0 (-1) | 667 (-4%) | 1mo | $220,000 | $330 | 59 |
| 2013 Cool Ln | 0.46mi | 2/1.0 (-1) | 761 (+9%) | 1mo | $160,000 | $210 | 58 |
| 2117 Selden St | 0.44mi | 3/1.0 | 796 (+14%) | 2mo | $190,000 | $239 | 54 |
| 1701 Peter Paul Blvd | 0.75mi | 2/1.0 (-1) | 720 (+3%) | 4mo | $160,000 | $222 | 51 |
| 2503 Peter Paul Blvd | 0.68mi | 2/1.0 (-1) | 720 (+3%) | 8mo | $150,000 | $208 | 51 |
| 1703 Peter Paul Blvd | 0.75mi | 3/1.5 | 720 (+3%) | 18mo | $230,000 | $319 | 43 |
| 1708 N 24th St | 0.58mi | 2/1.0 (-1) | 648 (-7%) | 15mo | $225,000 | $347 | 43 |
| 1902 N 25th St | 0.64mi | 3/1.0 | 778 (+12%) | 21mo | $220,000 | $283 | 33 |
| 2317 T St | 0.69mi | 2/2.0 (-1) | 792 (+14%) | 19mo | $210,000 | $265 | 20 |
Match score weights: distance 35% · size 25% · config 20% · recency 20%. Top-matched comps best support the ARV.
Projected returns pro-forma
-3.0% appreciation · 6.38% rent growth · sell at horizon
- IRR
- 16.6%
- Equity multiple
- 1.70×
- Total profit
- $22,407
- Equity at exit
- $17,132
- IRR
- 27.4%
- Equity multiple
- 3.80×
- Total profit
- $90,035
- Equity at exit
- $9,934
Cash invested: $32,172 (down + closing). Projections, not guarantees.
Landlord ↔ Tenant lean methodology
- Overall (STATE)
- 55 Moderately Landlord-Leaning
- State Virginia
- 55 Moderately Landlord-Leaning · D+2
- County
- — inherits STATE
- City
- — inherits STATE
ZIP-level market 23223
- Rents YoY
- 6.4%
- Active inventory
- 337
- Price-to-rent
- 5.9×
Monthly cashflow live
- Estimated rent
- $1,622 high interval (Pro) →
- Mortgage (P&I)
- −$603
- Tax from tax record
- −$76 /mo · $912/yr
- Insurance
- −$48
- HOA
- −$0
- Vacancy / Maint / Mgmt
- −$341
- Net cashflow
- $555
Break-even live
UW: 25.0% down · 7.5% · 30yr · 1.5% tax · 5.0% vac · 8.0% maint · 8.0% mgmt
Financing live
Cash to close
- Down payment
- $28,725
- Closing costs
- $3,447
- Reserves months
- —
- Total cash needed
- —
Loan-product check · same deal, 3 products live
Conventional
25% down · 7.5% · 30yr
- Down + closing
- —
- Monthly P&I
- —
- Monthly cashflow
- —
- DSCR
- —
- Eligible?
- —
Personal DTI + credit; lowest rate.
DSCR
20% down · 8.5% · 30yr
- Down + closing
- —
- Monthly P&I
- —
- Monthly cashflow
- —
- DSCR
- —
- Eligible?
- —
No personal income docs; deal must DSCR.
Hard money
10% down · 12.0% · 12mo
- Down + closing
- —
- Monthly P&I
- —
- Monthly cashflow
- —
- DSCR
- —
- Eligible?
- —
Short-term bridge; refi at stabilization.
Rent comps 40 comps
| Address | Beds | Baths | Sqft | Rent | $/sqft | DOM | Units | Dist |
|---|---|---|---|---|---|---|---|---|
| 1901 Whitcomb St Richmond, VA | 2.0 | 1.0 | 750 | $1,200 | $1.60 | 23d | 1 | 0.41mi |
| 2108 Phaup St Unit D Richmond, VA | 2.0 | 1.0 | 700 | $995 | $1.42 | 23d | 1 | 0.45mi |
| 1906 N 29th St Richmond, VA | 2.0 | 1.0 | 704 | $1,000 | $1.42 | 4d | 1 | 0.88mi |
| 500 N 18th St Richmond, VA | 1.0–2.0 | 1.0–2.0 | 737 | $1,837 | $2.49 | 1d | 11 | 1.02mi |
| 2000 Lamb Ave Apt C Richmond, VA | 2.0 | 1.0 | 750 | $1,295 | $1.73 | 43d | 1 | 1.11mi |
| 1820 E Broad St Richmond, VA | 1.0–2.0 | 1.0–2.0 | 665 | $2,476 | $3.72 | 21d | 15 | 1.17mi |
| 1903 E Marshall St Richmond, VA | 3.0 | 1.0–2.0 | 723 | $1,799 | $2.49 | 1d | 57 | 1.17mi |
| 700 N 2nd St Unit 203 Richmond, VA | 2.0 | 1.0 | 690 | $1,250 | $1.81 | 43d | 1 | 1.21mi |
| 1806 E Franklin St Richmond, VA | 1.0–2.0 | 1.0–2.0 | 703 | $2,005 | $2.85 | 1d | 12 | 1.34mi |
| 417 Fritz St Richmond, VA | 2.0 | 1.0 | 725 | $1,295 | $1.79 | 43d | 1 | 1.36mi |
| 230 N 6th St Richmond, VA | 1.0–2.0 | 1.0–2.0 | 982 | $2,496 | $2.54 | 1d | 8 | 1.36mi |
| 326 E Broad St Richmond, VA | 1.0–3.0 | 1.0–2.0 | 925 | $2,199 | $2.38 | 2d | 4 | 1.37mi |
| 1508 Hickory St Richmond, VA | 2.0 | 1.0 | 725 | $1,195 | $1.65 | 43d | 1 | 1.38mi |
| 501 Fritz St Richmond, VA | 2.0 | 1.0 | 725 | $1,295 | $1.79 | 43d | 1 | 1.39mi |
| 509 N 30th St Unit 2 Richmond, VA | 2.0 | 1.0 | 750 | $1,365 | $1.82 | 21d | 1 | 1.40mi |
| 700 E Franklin St Richmond, VA | 2.0 | 1.0–2.0 | 588 | $1,989 | $3.38 | 2d | 9 | 1.41mi |
| 2001 E Franklin St Richmond, VA | 1.0–2.0 | 1.0–2.0 | 761 | $1,862 | $2.45 | 3d | 34 | 1.41mi |
| 510 W Bacon St Richmond, VA | 2.0 | 1.0 | 725 | $1,295 | $1.79 | 43d | 1 | 1.41mi |
| 621 N 32nd St Unit C Richmond, VA | 2.0 | 1.0 | 700 | $1,299 | $1.86 | 4d | 1 | 1.42mi |
| 600 N 32nd St Unit C Richmond, VA | 2.0 | 1.0 | 700 | $1,350 | $1.93 | 43d | 1 | 1.43mi |
| 613 N 32nd St Apt C Richmond, VA | 2.0 | 1.0 | 600 | $1,650 | $2.75 | 4d | 1 | 1.43mi |
| 2201 E Franklin St Richmond, VA | 1.0–3.0 | 1.0–3.0 | 905 | $2,349 | $2.59 | 3d | 7 | 1.43mi |
| 16 N 22nd St Richmond, VA | 1.0–2.0 | 1.0–2.0 | 844 | $1,675 | $1.98 | 3d | 7 | 1.44mi |
| 1313 E Main St Richmond, VA | 1.0–2.0 | 1.0–2.0 | 752 | $1,939 | $2.58 | 1d | 5 | 1.44mi |
| 306 E Grace St Richmond, VA | 2.0–3.0 | 1.0–2.0 | 713 | $1,895 | $2.66 | 23d | 1 | 1.45mi |
| 1607 Brookfield St Richmond, VA | 2.0 | 1.0 | 725 | $1,195 | $1.65 | 23d | 1 | 1.45mi |
| 1609 Brookfield St Richmond, VA | 2.0 | 1.0 | 725 | $1,295 | $1.79 | 43d | 1 | 1.45mi |
| 2213 E Franklin St Richmond, VA | 1.0–2.0 | 1.0–2.0 | 862 | $2,049 | $2.38 | 4d | 6 | 1.46mi |
| 1001 E Main St Richmond, VA | 1.0–2.0 | 1.0–2.0 | 611 | $2,350 | $3.85 | 2d | 12 | 1.46mi |
| 527 Fritz St Richmond, VA | 2.0 | 1.0 | 725 | $1,195 | $1.65 | 43d | 1 | 1.46mi |
| 1619 Brookfield St Richmond, VA | 2.0 | 1.0 | 725 | $1,295 | $1.79 | 43d | 1 | 1.46mi |
| 219 E Broad St Richmond, VA | 2.0 | 1.0–2.0 | 716 | $2,063 | $2.88 | 3d | 14 | 1.47mi |
| 1711 Brookfield St Richmond, VA | 2.0 | 1.0 | 725 | $1,195 | $1.65 | 43d | 1 | 1.48mi |
| 1608 Brookfield St Richmond, VA | 2.0 | 1.0 | 725 | $1,195 | $1.65 | 23d | 1 | 1.48mi |
| 1817 E Main St Richmond, VA | 2.0 | 1.0–2.0 | 846 | $1,955 | $2.31 | 1d | 40 | 1.49mi |
| 600 W Bacon St Richmond, VA | 2.0 | 1.0 | 725 | $1,295 | $1.79 | 43d | 1 | 1.49mi |
| 1708 Brookfield St Richmond, VA | 2.0 | 1.0 | 725 | $1,295 | $1.79 | 43d | 1 | 1.49mi |
| 1601 Roane St Richmond, VA | 1.0–3.0 | 1.0–2.5 | 914 | $2,100 | $2.30 | 1d | 28 | 1.49mi |
| 100 S 15th St Richmond, VA | 1.0–2.0 | 1.0–2.0 | 825 | $1,749 | $2.12 | 4d | 4 | 1.49mi |
| 1706 Brookfield St Richmond, VA | 2.0 | 1.0 | 725 | $1,195 | $1.65 | 23d | 1 | 1.50mi |
Listing history 7 events
-
2026-05-31status $114,900 Pending 2 DOM
-
2026-05-28$114,900 Active
-
2002-03-07soldstatus $27,000 37-char remark
Show marketing remark (37 chars)
GREAT RENTAL PROPERTY OR STARTER HOME
-
2002-01-31$38,000
Show marketing remark (37 chars)
GREAT RENTAL PROPERTY OR STARTER HOME
-
2002-01-31$38,000 37-char remark
Show marketing remark (37 chars)
GREAT RENTAL PROPERTY OR STARTER HOME
-
1997-12-16soldstatus $23,800
-
1956-04-18soldstatus $7,300
ⓘ Source: listings_history table (triggers on properties + properties_extension) + one-shot
backfill from property_details.listing_events for pre-trigger history.
Tax reassessment forecast VA · Resets to sale price
- Current annual tax
- $912 · $76/mo
- Projected year-2 tax
- $942 · $79/mo
- Expected delta
- +$30/yr (+$3/mo · 3.3%)
ⓘ Screening estimate from a state-policy table — verify with the county assessor before closing.
Climate risk First Street
- Flood 1/10 Low FEMA zone X (unshaded) · 0% chance over 30 yrs
- Wildfire 1/10 Low
- Heat 7/10 Severe 7 d/yr ≥105°F today · 16 d/yr by 30 yrs out
- Wind 6/10 Major 27% chance of damaging wind over 30 yrs
- Air quality 2/10 Low 1 unhealthy d/yr today · 3 by 30 yrs out
Nearby sold comps map
Loading sold comps map…
Walkable amenities ~0.75 mi
Loading nearby amenities…
Taxation est. · year 1
- Rental income
- $19,463
- − Mortgage interest
- −$6,436
- − Property taxes
- −$912
- − Insurance
- −$574
- − Repairs & maintenance
- −$1,557
- − Management
- −$1,557
- − Depreciation
- −$3,343
- Taxable income
- $5,084
- Est. tax owed @ 24.0%
- −$1,220
- After-tax cash flow
- $5,438/yr
For passive investors: Depreciation is non-cash, so a rental often shows a tax loss while cash-flowing — sheltering income. Rental losses are passive: they offset passive income freely, and up to $25,000/yr can offset ordinary (W-2) income if you actively participate and your MAGI is under $100k (phasing out to $0 by $150k); unused losses carry forward. On sale, claimed depreciation is recaptured at up to 25%, and gains may owe capital-gains tax (a 1031 exchange can defer both). Figures are a year-1 estimate at your 24.0% rate — not tax advice; consult a CPA.
Schools (NCES district)
- District
- Richmond City Public School District
- NCES district ID
- 5103240
- Math proficiency
- 32% ▼ -24.00%
- Reading proficiency
- 47% ▼ -9.00%
- Median HH income
- $40,276
- Composite
- 33.09/100
- National rank
- #5564
- State rank
- #123 of 131 in VA
Livability — Richmond
- Score
- 84/100
- State rank
- #33
- US rank
- #793
Category grades
Schools grade is shown separately in the Schools card above.
Census & demographics
- Census place
- Richmond, VA
- County
- Henrico County · 334,490 people
- City population
- 287,109
- Metro
- Richmond, VA
- Population (ZIP)
- 54,659
- Household income
- $55,731
- Rent vs Own
- Severe rent burden
- 3530.0
Population outlook (Richmond County) Hauer SSP2
- Today (2025)
- 262,263 people
- By 2030
- 284,503 · +8.5%
- By 2040
- 327,353 · +24.8%
- By 2050
- 367,946 · +40.3%
- By 2075
- 449,560 · +71.4%
- By 2100
- 500,301 · +90.8%
Race, ethnicity, and origin ACS 2023
- Neighborhood character
- Predominantly Black (71%)
- Race & ethnicity
- Black 71% White 19% Two or more races 5% Hispanic / Latino 5%
- Common ancestry
- Romanian 1% Lithuanian 1% Slovak 1%
- Foreign-born
- 4% · Canada
- Languages at home
- 93% English-only · Spanish 4% French/Haitian/Cajun 1% Other Indo-European 1%
Political lean MEDSL · Richmond
- 2024 margin
- Solid D (+66.3) · D 82.0% · R 15.8% · Other 2.2%
- 2008→2024 swing
- +7.2pp toward D · 2008: 59.1pp · 2024: 66.3pp
- All cycles
- 2024: D+66.3 2020: D+68.0 2016: D+63.8 2012: D+55.7 2008: D+59.1
Not yet ingested
- Civics
- —
Market trends
- HPI YoY
- ▼ -257.81%
- Current HPI
- 324.0589
- Rent YoY
- ▲ 6.38%
- Metro
- Richmond, VA
- State GDP YoY
- ▲ 2.40%
- F500 in state
- 50
Industry mix (Fortune 500 HQ in VA)
| Industry | F500 HQs | Revenue |
|---|---|---|
| Aerospace / Defense | 4 | $236B |
|
||
| Technology / Defense | 3 | $32B |
|
||
| Financial Services | 2 | $176B |
|
||
| Utilities | 2 | $27B |
|
||
| Insurance | 2 | $25B |
|
||
| Technology | 2 | $15B |
|
||
Price history
+1474.0% since first listed6 events — show timeline
- 2026-05-28 Listed $114,900 CVRMLS
- 2002-03-07 Sold (MLS) $27,000 CVRMLS
- 2002-01-31 Listed $38,000 CVRMLS
- 2002-01-31 Listed $38,000 CVRMLS
- 1997-12-16 Sold (Public Records) $23,800 Public Records
- 1956-04-18 Sold (Public Records) $7,300 Public Records
Property tax history
+4.8%/yrLatest (2022): $912 · +31.0% YoY. Source: county tax records.
Cash-flow waterfall
monthlySold comps — $/sqft
last 12 mo · ≤1 miLoading sold comps…