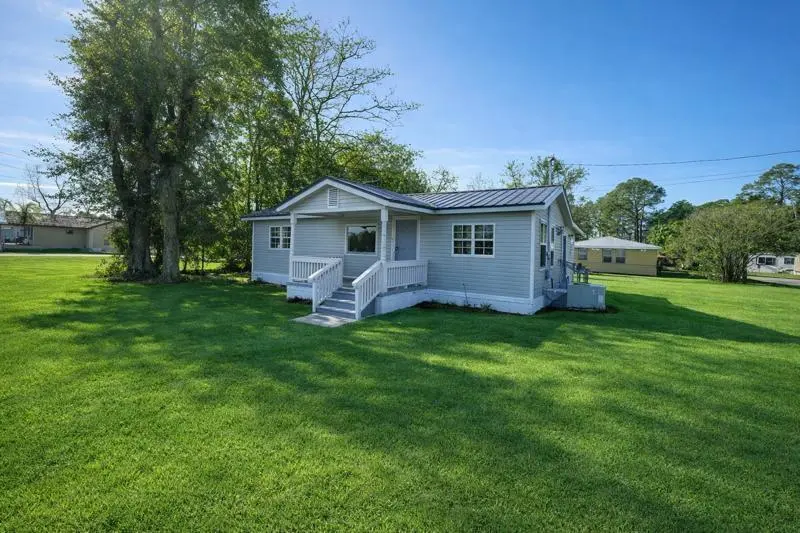
703 North Elm St · Adel, GA
Flood risk 1/10 · Minimal
- FEMA flood zone
- X (unshaded)
- Chance of flooding over 30 yrs
- 0.0%
- Est. flood insurance / yr
- $507 – $1,088
Fire risk 6/10 · Moderate
- Est. fire insurance / yr
- $963 – $1,789
Heat risk 8/10 · Major
- Hot days now (above 109°F)
- 7 days/yr
- Hot days in 30 yrs
- 19 days/yr
Wind risk 8/10 · Major
- Chance of severe wind over 30 yrs
- 99.0%
Air-quality risk 6/10 · Moderate
- Unhealthy air days now
- 9 days/yr
- Unhealthy air days in 30 yrs
- 12 days/yr
Risk factors via First Street. Map © Google.
Why this score? — see what drove the B- grade
The composite is a weighted blend of 9 inputs, each scored 0–100. Each bar is that input's sub-score; the figure is the points it added to the 100-point composite (weight × sub-score).
- Cash flow +27.7/30.0
- ARV discount +10.9/15.0
- DSCR +9.8/10.0
- 1% rule +7.1/10.0
- Livability +3.5/5.0
- Rent growth +2.5/5.0
- Condition / age +2.5/5.0
- Schools +2.3/10.0
- Appreciation +0.0/10.0
$109,900
🖨 Deal sheet 📄 Offer letter ✓ Due diligence
Listing remarks
Extensively renovated residence featuring a reconfigured 4-bedroom, 2-bath layout with substantial 2025 capital improvements throughout. The home includes a newly built addition constructed to modern standards, along with new flooring, walls, finishes, and systems across the original structure. Over $80,000 in upgrades were invested to deliver long-term durability, functionality, and livability. The result is a solid, refreshed home designed to perform well for years to come. Ideal for owner-occupants or investors seeking a materially upgraded property in Adel
Key facts
- New walls
- Renovated residence
- New finishes
Tags
Neighborhood map
What this means for you Summary
Snapshot
- This is a 4-bed/2.0-bath single-family listed at $110k.
Deal economics
- At list price, monthly cash flow is $333 ($4k/yr) — positive.
- The deal already cash-flows at list — no discount required.
- Meets the 1% rule at list price ($1k rent vs $110k).
- Recommended offer: $100k (9.0% below list) — sets the bar for market timing.
- Cap rate 9.9% vs local median 3.4% in Adel — top-decile yield for the area; either an underpriced asset or a hidden risk that comps aren't pricing in. Stress-test before assuming the spread holds.
Location & tenants
- Location reads 69/100 on livability (#105 in GA) — a middle-class / working-renter tenant base. Strengths: cost of living A+, health & safety A+, housing B+; Watch: crime C-, schools F, amenities F.
- Cook County (rural): math 29% / reading 27% proficiency, ranked #111 of 174 in GA (top 64%) — low school quality limits family demand, transient renter base, plan for 1-2y turnover; 63% free/reduced lunch — lower-income household profile, screen leases tightly.
- Market conditions: 55 active listings in the ZIP; 47 units permitted in Cook County in 2024 (0 in 5+ unit buildings).
Forward outlook
- Local home prices are declining (-3.0%/yr); year-one equity from $760 of loan paydown is wiped out by about $3k of value loss. Plan a longer hold.
- Cook County population projected to shrink 8% by 2050 — rents likely to lag national; underwrite the cash flow, not the appreciation.
- At projected returns (-3.0% appreciation + 3.0% rent growth), your $31k cash investment doubles in ~9 years — after that, you're playing with house money.
Negotiation context
- It's been on market 107 days — a 9% lower offer ($100k) is reasonable based on typical stale-listing flexibility.
Risks & watch-outs
- Climate carrying-cost: severe wind risk, 99% chance of damaging wind over 30y; major wildfire risk; extreme-heat days projected 7→19/yr by 2055 (HVAC capex compounding) — expect insurance premiums to compound above CPI over the hold.
Questions for the listing agent
- It's been on market 107 days. Have you received any prior offers? Is the seller open to a 9% concession, seller financing, or rate buy-down credit?
- Why hasn't it sold? Are there any deal-killer items the seller is aware of (foundation, flood, title, zoning, code violations)?
- Is there a deadline driving the sale (1031 exchange, divorce, estate, relocation)? That informs how much negotiation room exists.
- Schools are F-rated, which usually means shorter tenancies and higher turnover. Who's the typical renter profile here, and what's been the actual vacancy rate?
- What's the average days-on-market for RENTAL listings here right now (not sales)? A rising rental-DOM trend means longer vacancies and softer asking-rent achievability than the comps imply.
- What's the recent tenant-quality profile in this submarket — average credit score on applications, eviction rate, late-payment / NSF rate, and stable-employment percentage? A property-management company in the area should have these aggregated.
- How much new for-sale + rental construction is in the pipeline within 1–3 miles? Heavy new supply typically softens prices + rents 12–24 months out; constrained supply supports both.
Investment metrics
- 1% rule
- 1.21% ✓
- Cap rate
- 9.93%
- Cash-on-cash
- 12.98%
- DSCR
- 1.58
- GRM
- 6.9
CMA / ARV
- ARV (on-the-fly)
- $119,000
- Comps found
- 3
Show comp detail 3 sales within ~0.75 mi
| Address | Dist | Beds/Ba | Sqft | Sold | Price | $/sf | Match |
|---|---|---|---|---|---|---|---|
| 414 Birch St | 0.30mi | 4/2.0 | 1,325 (-5%) | 3mo | $41,500 | $31 | 75 |
| 704 N Cleveland Ave | 0.67mi | 3/1.0 (-1) | 1,347 (-4%) | 13mo | $139,000 | $103 | 42 |
| 215 N Cleveland Ave | 0.74mi | 3/2.0 (-1) | 1,461 (+4%) | 15mo | $124,900 | $85 | 41 |
Match score weights: distance 35% · size 25% · config 20% · recency 20%. Top-matched comps best support the ARV.
Projected returns pro-forma
-3.0% appreciation · 3.0% rent growth · sell at horizon
- IRR
- 2.9%
- Equity multiple
- 1.11×
- Total profit
- $3,389
- Equity at exit
- $16,386
- IRR
- 12.4%
- Equity multiple
- 1.98×
- Total profit
- $30,237
- Equity at exit
- $9,502
Cash invested: $30,772 (down + closing). Projections, not guarantees.
Landlord ↔ Tenant lean methodology
- Overall (STATE)
- 90 Strongly Landlord-Friendly
- State Georgia
- 90 Strongly Landlord-Friendly · R+3
- County
- — inherits STATE
- City
- — inherits STATE
ZIP-level market 31620
- Home prices YoY
- -15.1%
- Active inventory
- 55
- Price-to-rent
- 6.9×
Monthly cashflow live
- Estimated rent
- $1,334 medium interval (Pro) →
- Mortgage (P&I)
- −$576
- Tax from tax record
- −$99 /mo · $1,185/yr
- Insurance
- −$46
- HOA
- −$0
- Vacancy / Maint / Mgmt
- −$280
- Net cashflow
- $333
Break-even live
UW: 25.0% down · 7.5% · 30yr · 1.5% tax · 5.0% vac · 8.0% maint · 8.0% mgmt
Financing live
Cash to close
- Down payment
- $27,475
- Closing costs
- $3,297
- Reserves months
- —
- Total cash needed
- —
Loan-product check · same deal, 3 products live
Conventional
25% down · 7.5% · 30yr
- Down + closing
- —
- Monthly P&I
- —
- Monthly cashflow
- —
- DSCR
- —
- Eligible?
- —
Personal DTI + credit; lowest rate.
DSCR
20% down · 8.5% · 30yr
- Down + closing
- —
- Monthly P&I
- —
- Monthly cashflow
- —
- DSCR
- —
- Eligible?
- —
No personal income docs; deal must DSCR.
Hard money
10% down · 12.0% · 12mo
- Down + closing
- —
- Monthly P&I
- —
- Monthly cashflow
- —
- DSCR
- —
- Eligible?
- —
Short-term bridge; refi at stabilization.
Listing history 4 events
-
2026-04-24status Pending
-
2026-03-20price $109,900
-
2026-01-07$114,900 Active
-
2025-04-17price $139,900
ⓘ Source: listings_history table (triggers on properties + properties_extension) + one-shot
backfill from property_details.listing_events for pre-trigger history.
Tax reassessment forecast GA · Resets to sale price
- Current annual tax
- $1,185 · $99/mo
- Projected year-2 tax
- $1,185 · $99/mo
- Expected delta
- $0/yr ($0/mo · 0.0%)
ⓘ Screening estimate from a state-policy table — verify with the county assessor before closing.
Climate risk First Street
- Flood 1/10 Low FEMA zone X (unshaded) · 0% chance over 30 yrs
- Wildfire 6/10 Major
- Heat 8/10 Severe 7 d/yr ≥109°F today · 19 d/yr by 30 yrs out
- Wind 8/10 Severe 99% chance of damaging wind over 30 yrs
- Air quality 6/10 Major 9 unhealthy d/yr today · 12 by 30 yrs out
Nearby sold comps map
Loading sold comps map…
Walkable amenities ~0.75 mi
Loading nearby amenities…
Taxation est. · year 1
- Rental income
- $16,006
- − Mortgage interest
- −$6,156
- − Property taxes
- −$1,185
- − Insurance
- −$550
- − Repairs & maintenance
- −$1,280
- − Management
- −$1,280
- − Depreciation
- −$3,197
- Taxable income
- $2,358
- Est. tax owed @ 24.0%
- −$566
- After-tax cash flow
- $3,429/yr
For passive investors: Depreciation is non-cash, so a rental often shows a tax loss while cash-flowing — sheltering income. Rental losses are passive: they offset passive income freely, and up to $25,000/yr can offset ordinary (W-2) income if you actively participate and your MAGI is under $100k (phasing out to $0 by $150k); unused losses carry forward. On sale, claimed depreciation is recaptured at up to 25%, and gains may owe capital-gains tax (a 1031 exchange can defer both). Figures are a year-1 estimate at your 24.0% rate — not tax advice; consult a CPA.
Schools (NCES district)
- District
- Cook County
- NCES district ID
- 1301470
- Math proficiency
- 29% ▼ -3.00%
- Reading proficiency
- 27% ▼ -5.00%
- Median HH income
- $35,135
- Composite
- 23.14/100
- National rank
- #7951
- State rank
- #111 of 174 in GA
Livability — Adel
- Score
- 69/100
- State rank
- #105
- US rank
- #8186
Category grades
Schools grade is shown separately in the Schools card above.
Census & demographics
- Census place
- Adel, GA
- City population
- 11,199
- Population (ZIP)
- 11,199
Population outlook (Cook County) Hauer SSP2
- Today (2025)
- 16,984 people
- By 2030
- 16,800 · -1.1%
- By 2040
- 16,343 · -3.8%
- By 2050
- 15,696 · -7.6%
- By 2075
- 13,451 · -20.8%
- By 2100
- 10,357 · -39.0%
Race, ethnicity, and origin ACS 2023
- Neighborhood character
- Majority White (63%)
- Race & ethnicity
- White 63% Black 25% Hispanic / Latino 8% Two or more races 7%
- Hispanic origin (detail)
- Puerto Rican 4% Cuban 1%
- Common ancestry
- Slovak 4% Serbian 1% Portuguese 1%
- Foreign-born
- 2% · Canada
- Languages at home
- 95% English-only · Spanish 5%
Political lean MEDSL · Cook
- 2024 margin
- Solid R (+46.5) · D 26.6% · R 73.0%
- 2008→2024 swing
- -17.5pp toward R · 2008: -28.9pp · 2024: -46.5pp
- All cycles
- 2024: R+46.5 2020: R+40.4 2016: R+40.1 2012: R+31.4 2008: R+28.9
Not yet ingested
- Civics
- —
Market trends
- HPI YoY
- ▼ -39.58%
- Current HPI
- 222.35
- Rent YoY
- —
- Metro
- —
- State GDP YoY
- ▲ 2.66%
- F500 in state
- 28
Industry mix (Fortune 500 HQ in GA)
| Industry | F500 HQs | Revenue |
|---|---|---|
| Paper / Packaging | 2 | $29B |
|
||
| Retail | 1 | $160B |
|
||
| Transportation / Logistics | 1 | $91B |
|
||
| Airlines | 1 | $62B |
|
||
| Consumer Goods | 1 | $47B |
|
||
| Utilities | 1 | $25B |
|
||
Price history
-21.4% since first listed4 events — show timeline
- 2026-04-24 Pending — SGMLS
- 2026-03-20 Price Changed $109,900 SGMLS
- 2026-01-07 Listed $114,900 SGMLS
- 2025-04-17 Price Changed $139,900 SGMLS
Property tax history
+17.0%/yrLatest (2025): $1,185 · +335.5% YoY. Source: county tax records.
Cash-flow waterfall
monthlySold comps — $/sqft
last 12 mo · ≤1 miLoading sold comps…