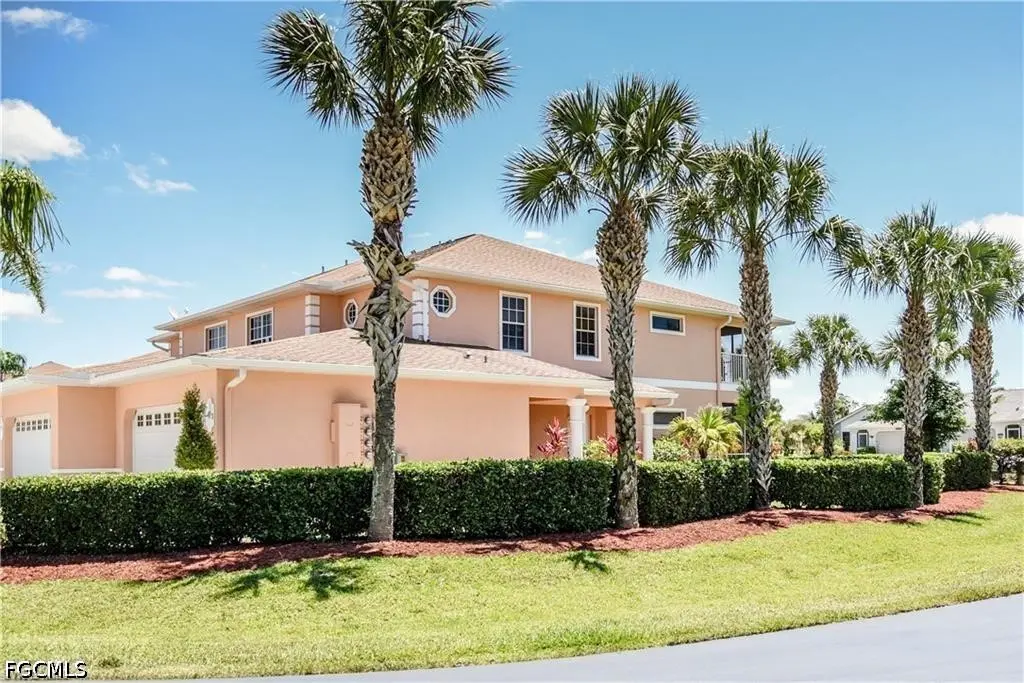
19914 Lake Vista Cir N #3 · Lehigh Acres, FL
Flood risk 1/10 · Minimal
- FEMA flood zone
- X (unshaded)
- Chance of flooding over 30 yrs
- 0.0%
- Est. flood insurance / yr
- $507 – $1,088
Fire risk 3/10 · Minor
- Est. fire insurance / yr
- $947 – $1,759
Heat risk 10/10 · Severe
- Hot days now (above 108°F)
- 7 days/yr
- Hot days in 30 yrs
- 29 days/yr
Wind risk 10/10 · Severe
- Chance of severe wind over 30 yrs
- 99.0%
Air-quality risk 2/10 · Minimal
- Unhealthy air days now
- 1 days/yr
- Unhealthy air days in 30 yrs
- 2 days/yr
Risk factors via First Street. Map © Google.
Why this score? — see what drove the C grade
The composite is a weighted blend of 9 inputs, each scored 0–100. Each bar is that input's sub-score; the figure is the points it added to the 100-point composite (weight × sub-score).
- Cash flow +16.6/30.0
- ARV discount +15.0/15.0
- 1% rule +7.2/10.0
- DSCR +5.2/10.0
- Schools +4.1/10.0
- Condition / age +3.8/5.0
- Livability +3.0/5.0
- Rent growth +2.3/5.0
- Appreciation +0.0/10.0
$159,000
🖨 Deal sheet 📄 Offer letter ✓ Due diligence
Listing remarks
Welcome Home to this Beautiful 3 bed 2 bath Dream Coach Home in Majestic Golf Course!! You will not find a better Located Coach Home in the Community!! As you come up the stairs you will notice The Vaulted Ceilings in the Living Area and Kitchen! The Spacious Living Area has Tiled Floors, Plenty of Natural Light, a beautiful wooden accent wall , and a Sliding Door out to the Lanai! The Kitchen Boasts Stainless Steel Appliances and a Massive Amount Of Cabinets, Drawers, and Countertop Space along with Breakfast Bar and a accented back splash! The Master Bedroom has a Newer Carpet, Vaulted Ceiling, a sliding door out to the Lanai, and Plenty of space for your furnishings! Down The Master Bedr
Key facts
- Tiled floors
- Natural light
- Vaulted ceilings
Tags
Property features AI
Finance
- Other: Pets allowed (call/conditional)
- Financial info: Land lease expires 2026-07-31
- HOA & community: Homeowners association with management; Quarterly association fee of $920; Additional annual association fee of $432; Association covers irrigation water, grounds maintenance and road maintenance; Community is non-gated with street lights; Community contains 4 units
Exterior
- Parking: Attached 2-car garage; Driveway parking; Underground access; Paved parking; Garage door opener
- Security: Smoke detectors
- Utilities: Public water; Public sewer; Cable available; High-speed internet available; Irrigation water included in assessment; Well
- Home design: 2-story building; Entry level: 2; Faces north; Resale property; Zoned RM-2
- Construction: Block, concrete and stucco construction; Shingle roof; Built with standard foundation materials
- Exterior features: Balcony; Screened porch; Corner lot; Rectangular lot; South exposure
Interior
- Kitchen: Electric cooktop; Range; Self-cleaning oven; Microwave; Dishwasher; Refrigerator; Freezer; Breakfast bar; Pantry
- Flooring: Carpet; Tile
- Bathrooms: 2 full bathrooms
- Heating & cooling: Central heating (electric); Central air conditioning (electric); Ceiling fans
- Interior features: Furnished; Breakfast bar; Living/dining room; Pantry; Shower-only bath with separate shower; Vaulted ceilings; High-speed internet; Split bedroom floor plan; Display windows
- Laundry & utility: Washer and dryer included; Laundry inside unit (in garage)
Neighborhood map
What this means for you Summary
Snapshot
- This is a 3-bed/2.0-bath townhouse listed at $159k. Condition is rated good.
Deal economics
- At list price, monthly cash flow is $97 ($1k/yr) — positive.
- The deal already cash-flows at list — no discount required.
- Meets the 1% rule at list price ($2k rent vs $159k).
- Recommended offer: $157k (1.5% below list) — sets the bar for market timing.
- Cap rate 7.0% vs local median 4.7% in Lehigh Acres — top-decile yield for the area; either an underpriced asset or a hidden risk that comps aren't pricing in. Stress-test before assuming the spread holds.
Location & tenants
- Location reads 59/100 on livability (#826 in FL) — a working-class tenant base; expect higher turnover. Strengths: cost of living A+, housing A+; Watch: crime C-, employment D+, schools D-.
- Lee (suburban): math 47% / reading 50% proficiency, ranked #42 of 73 in FL (top 58%) — families likely to look elsewhere, expect single-tenant / working-renter base with shorter leases.
- Market conditions: Rents soft (-0.8%/yr); 641 active listings in the ZIP; 40 comparable units currently listed for rent nearby; rentals at typical pace (median 24d on market — plan ~3-4 weeks tenant-placement turnaround); 15,411 units permitted in Lee County in 2024 (4,686 in 5+ unit buildings).
- At $1,946/mo this rent would consume 45% of the median local household income ($51k/yr) (locally 1027% of renters already pay >50% of income on rent) — very limited rent-growth headroom before tenants either downsize or default.
Forward outlook
- Local home prices are declining (-3.0%/yr); year-one equity from $1k of loan paydown is wiped out by about $5k of value loss. Plan a longer hold.
- Lee County population projected at +44% by 2050 — long-run rental-demand tailwind backs the buy-and-hold thesis.
Negotiation context
- It's been on market 15 days — a 2% lower offer ($157k) is reasonable based on typical stale-listing flexibility.
Risks & watch-outs
- Climate carrying-cost: severe wind risk, 99% chance of damaging wind over 30y; extreme-heat days projected 7→29/yr by 2055 (HVAC capex compounding) — expect insurance premiums to compound above CPI over the hold.
Questions for the listing agent
- What does the HOA fee cover, when was the last increase, and are there any pending special assessments or reserve-fund shortfalls?
- Is there a deadline driving the sale (1031 exchange, divorce, estate, relocation)? That informs how much negotiation room exists.
- Schools are D-rated, which usually means shorter tenancies and higher turnover. Who's the typical renter profile here, and what's been the actual vacancy rate?
- What's the average days-on-market for RENTAL listings here right now (not sales)? A rising rental-DOM trend means longer vacancies and softer asking-rent achievability than the comps imply.
- What's the recent tenant-quality profile in this submarket — average credit score on applications, eviction rate, late-payment / NSF rate, and stable-employment percentage? A property-management company in the area should have these aggregated.
- How much new for-sale + rental construction is in the pipeline within 1–3 miles? Heavy new supply typically softens prices + rents 12–24 months out; constrained supply supports both.
Investment metrics
- 1% rule
- 1.22% ✓
- Cap rate
- 7.02%
- Cash-on-cash
- 2.61%
- DSCR
- 1.12
- GRM
- 6.8
CMA / ARV
- ARV (on-the-fly)
- $204,795
- Comps found
- 2
Show comp detail 2 sales within ~0.75 mi
| Address | Dist | Beds/Ba | Sqft | Sold | Price | $/sf | Match |
|---|---|---|---|---|---|---|---|
| 19949 Lake Vista Cir Unit 16A | 0.06mi | 3/2.0 | 1,442 (-5%) | 3mo | $195,000 | $135 | 87 |
| 20068 Lake Vista Cir N Unit 2B DOOR 4 | 0.22mi | 3/2.0 | 1,442 (-5%) | 7mo | $185,000 | $128 | 76 |
Match score weights: distance 35% · size 25% · config 20% · recency 20%. Top-matched comps best support the ARV.
Projected returns pro-forma
-3.0% appreciation · 0.0% rent growth · sell at horizon
- IRR
- -16.5%
- Equity multiple
- 0.44×
- Total profit
- $-25,064
- Equity at exit
- $23,707
- IRR
- -17.3%
- Equity multiple
- 0.21×
- Total profit
- $-34,958
- Equity at exit
- $13,747
Cash invested: $44,520 (down + closing). Projections, not guarantees.
Landlord ↔ Tenant lean methodology
- Overall (STATE)
- 87 Strongly Landlord-Friendly
- State Florida
- 87 Strongly Landlord-Friendly · R+3
- County
- — inherits STATE
- City
- — inherits STATE
ZIP-level market 33936
- Home prices YoY
- -19.9%
- Rents YoY
- -0.8%
- Active inventory
- 641
- Price-to-rent
- 6.8×
Monthly cashflow live
- Estimated rent
- $1,946 high interval (Pro) →
- Mortgage (P&I)
- −$834
- Tax est. 1.5%
- −$199 /mo · $2,385/yr
- Insurance
- −$66
- HOA
- −$342
- Vacancy / Maint / Mgmt
- −$409
- Net cashflow
- $97
Break-even live
UW: 25.0% down · 7.5% · 30yr · 1.5% tax · 5.0% vac · 8.0% maint · 8.0% mgmt
Financing live
Cash to close
- Down payment
- $39,750
- Closing costs
- $4,770
- Reserves months
- —
- Total cash needed
- —
Loan-product check · same deal, 3 products live
Conventional
25% down · 7.5% · 30yr
- Down + closing
- —
- Monthly P&I
- —
- Monthly cashflow
- —
- DSCR
- —
- Eligible?
- —
Personal DTI + credit; lowest rate.
DSCR
20% down · 8.5% · 30yr
- Down + closing
- —
- Monthly P&I
- —
- Monthly cashflow
- —
- DSCR
- —
- Eligible?
- —
No personal income docs; deal must DSCR.
Hard money
10% down · 12.0% · 12mo
- Down + closing
- —
- Monthly P&I
- —
- Monthly cashflow
- —
- DSCR
- —
- Eligible?
- —
Short-term bridge; refi at stabilization.
Rent comps 40 comps
| Address | Beds | Baths | Sqft | Rent | $/sqft | DOM | Units | Dist |
|---|---|---|---|---|---|---|---|---|
| 19933 Lake Vista Cir Lehigh Acres, FL | 3.0 | 2.0 | 1776 | $1,750 | $0.99 | 19d | 1 | 0.04mi |
| 19949 Lake Vista Cir Unit 16C Lehigh Acres, FL | 3.0 | 2.0 | 1517 | $1,600 | $1.05 | 24d | 1 | 0.04mi |
| 19949 Lake Vista Cir N #1 Lehigh Acres, FL | 3.0 | 2.0 | 1442 | $1,800 | $1.25 | 24d | 1 | 0.04mi |
| 351 Ranchito Ave Lehigh Acres, FL | 3.0 | 2.5 | 1500 | $2,000 | $1.33 | 24d | 1 | 0.18mi |
| 20012 Petrucka Cir N Unit D Lehigh Acres, FL | 3.0 | 2.0 | 1517 | $1,750 | $1.15 | 24d | 1 | 0.26mi |
| 20055 Lake Vista Cir N Lehigh Acres, FL | 3.0 | 2.0 | 1442 | $1,700 | $1.18 | 24d | 1 | 0.26mi |
| 337 Rancho Ave Lehigh Acres, FL | 3.0 | 2.0 | 1723 | $2,150 | $1.25 | 24d | 1 | 0.29mi |
| 448 Reading St Lehigh Acres, FL | 3.0 | 2.0 | 1100 | $1,890 | $1.72 | 3d | 1 | 0.30mi |
| 438 Poplar St Lehigh Acres, FL | 3.0 | 2.0 | 1640 | $2,150 | $1.31 | 3d | 1 | 0.32mi |
| 334 Ranch Ave Lehigh Acres, FL | 3.0 | 2.0 | 1645 | $2,150 | $1.31 | 3d | 1 | 0.34mi |
| 467 Raymer St Lehigh Acres, FL | 4.0 | 2.0 | 1833 | $1,850 | $1.01 | 10d | 1 | 0.35mi |
| 532 Ilaria Ct Lehigh Acres, FL | 4.0 | 2.0 | 1598 | $2,300 | $1.44 | 16d | 1 | 0.35mi |
| 437 Reading St Lehigh Acres, FL | 4.0 | 2.0 | 1833 | $1,795 | $0.98 | 2d | 1 | 0.37mi |
| 463 Piedmont St Unit 463 Lehigh Acres, FL | 3.0 | 2.0 | 1200 | $1,350 | $1.12 | 3d | 1 | 0.40mi |
| 477 Rayford St Lehigh Acres, FL | 4.0 | 3.0 | 1715 | $2,000 | $1.17 | 24d | 1 | 0.40mi |
| 472 Rajah St Lehigh Acres, FL | 3.0 | 2.0 | 1715 | $2,200 | $1.28 | 3d | 1 | 0.42mi |
| 19882 Green Pasture Rd Lehigh Acres, FL | 4.0 | 2.0 | 1942 | $2,350 | $1.21 | 24d | 1 | 0.43mi |
| 19931 Green Pasture Rd Lehigh Acres, FL | 4.0 | 2.0 | 1817 | $2,248 | $1.24 | 24d | 1 | 0.46mi |
| 448 Grant Blvd Unit 1 Lehigh Acres, FL | 2.0 | 2.0 | 1244 | $1,595 | $1.28 | 2d | 1 | 0.46mi |
| 448 Grant Blvd Unit 1 Lehigh Acres, FL | 3.0 | 2.0 | 1244 | $1,650 | $1.33 | 21d | 1 | 0.46mi |
| 448 Grant Blvd Unit 1 Lehigh Acres, FL | 2.0 | 2.0 | 1244 | $1,595 | $1.28 | 2d | 1 | 0.46mi |
| 442 Grant Blvd Lehigh Acres, FL | 3.0 | 2.0 | 1199 | $1,625 | $1.36 | 14d | 1 | 0.49mi |
| 20050 Caroline Creek Pl Lehigh Acres, FL | 4.0 | 2.5 | 1885 | $2,300 | $1.22 | 24d | 1 | 0.58mi |
| 11918 Savanna Lakes Blvd Lehigh Acres, FL | 3.0 | 2.0 | 1484 | $2,000 | $1.35 | 24d | 1 | 0.58mi |
| 11621 Savanna Lakes Blvd Lehigh Acres, FL | 4.0 | 3.0 | 2174 | $2,200 | $1.01 | 16d | 1 | 0.59mi |
| 20190 Caroline Creek Pl Unit 250 Lehigh Acres, FL | 3.0 | 2.0 | 1448 | $2,200 | $1.52 | 24d | 1 | 0.62mi |
| 20190 Caroline Creek Pl Unit 250 Lehigh Acres, FL | 3.0 | 2.0 | 1448 | $1,900 | $1.31 | 3d | 1 | 0.62mi |
| 333 Pinehurst Ave Lehigh Acres, FL | 3.0 | 2.0 | 1545 | $2,100 | $1.36 | 24d | 1 | 0.65mi |
| 12321 Dakota Ridge Pl Lehigh Acres, FL | 3.0 | 2.0 | 1448 | $1,850 | $1.28 | 14d | 1 | 0.65mi |
| 12312 Amber Waves Rd Lehigh Acres, FL | 4.0 | 2.0 | 1937 | $2,325 | $1.20 | 19d | 1 | 0.67mi |
| 12312 Amber Waves Rd Unit NA Lehigh Acres, FL | 4.0 | 2.0 | 1941 | $2,325 | $1.20 | 24d | 1 | 0.67mi |
| 374 Compese Ave S Lehigh Acres, FL | 3.0 | 2.0 | 1200 | $1,750 | $1.46 | 16d | 1 | 0.69mi |
| 363 Grant Blvd Lehigh Acres, FL | 3.0 | 2.0 | 1158 | $1,700 | $1.47 | 24d | 1 | 0.71mi |
| 520 Creuset Ave S Lehigh Acres, FL | 2.0 | 2.0 | 1050 | $1,700 | $1.62 | 24d | 1 | 0.71mi |
| 357 Grant Blvd Lehigh Acres, FL | 3.0 | 2.0 | 1200 | $1,800 | $1.50 | 16d | 1 | 0.72mi |
| 12441 Dakota Ridge Pl Lehigh Acres, FL | 4.0 | 2.5 | 1885 | $2,150 | $1.14 | 24d | 1 | 0.74mi |
| 19750 Garden Ridge Ct Lehigh Acres, FL | 4.0 | 2.5 | 1400 | $2,200 | $1.57 | 24d | 1 | 0.76mi |
| 418 Pickford Ave Lehigh Acres, FL | 4.0 | 2.0 | 1937 | $2,450 | $1.26 | 24d | 1 | 0.76mi |
| 510 Caywood Ave S Lehigh Acres, FL | 3.0 | 2.0 | 1582 | $2,664 | $1.68 | 24d | 1 | 0.79mi |
| 397 Carrillon Ave S Lehigh Acres, FL | 3.0 | 2.0 | 1200 | $1,550 | $1.29 | 3d | 1 | 0.79mi |
HOA detail
- Monthly dues
- $342 · $4,104/yr
Listing history 10 events
-
2026-06-18days on market $159,000 Active 15 DOM
-
2026-06-17days on market $159,000 Active 14 DOM
-
2026-06-16days on market $159,000 Active 13 DOM
-
2026-06-15days on market $159,000 Active 12 DOM
-
2026-06-13days on market $159,000 Active 10 DOM
-
2026-06-10days on market $159,000 Active 7 DOM
-
2026-06-09days on market $159,000 Active 6 DOM
-
2026-06-08days on market $159,000 Active 5 DOM
-
2026-06-07remarks 699-char remark
-
2026-06-07$159,000 Active 4 DOM
ⓘ Source: listings_history table (triggers on properties + properties_extension) + one-shot
backfill from property_details.listing_events for pre-trigger history.
Climate risk First Street
- Flood 1/10 Low FEMA zone X (unshaded) · 0% chance over 30 yrs
- Wildfire 3/10 Moderate
- Heat 10/10 Extreme 7 d/yr ≥108°F today · 29 d/yr by 30 yrs out
- Wind 10/10 Extreme 99% chance of damaging wind over 30 yrs
- Air quality 2/10 Low 1 unhealthy d/yr today · 2 by 30 yrs out
Nearby sold comps map
Loading sold comps map…
Walkable amenities ~0.75 mi
Loading nearby amenities…
Taxation est. · year 1
- Rental income
- $23,356
- − Mortgage interest
- −$8,906
- − Property taxes
- −$2,385
- − Insurance
- −$795
- − Repairs & maintenance
- −$1,868
- − Management
- −$1,868
- − HOA
- −$4,104
- − Depreciation
- −$4,625
- Taxable loss
- −$1,197
- Est. tax savings @ 24.0%
- +$287
- After-tax cash flow
- $1,449/yr
For passive investors: Depreciation is non-cash, so a rental often shows a tax loss while cash-flowing — sheltering income. Rental losses are passive: they offset passive income freely, and up to $25,000/yr can offset ordinary (W-2) income if you actively participate and your MAGI is under $100k (phasing out to $0 by $150k); unused losses carry forward. On sale, claimed depreciation is recaptured at up to 25%, and gains may owe capital-gains tax (a 1031 exchange can defer both). Figures are a year-1 estimate at your 24.0% rate — not tax advice; consult a CPA.
Condition & rehab AI · 13 photos
This well-maintained, move-in-ready townhouse in a golf course community offers a good investment opportunity with minor updates for increased value.
Value-add opportunities
- Resale Paint exterior siding — Enhances curb appeal and property value
- Resale Replace carpet in bedrooms — Fresh carpet improves comfort and aesthetics
- Rental Clean and organize kitchen countertops — Keeps the kitchen looking tidy and inviting
Renovation cost estimate screening
Value-add ROI direction
- Resale Paint exterior siding — Enhances curb appeal and property value ↑
- Resale Replace carpet in bedrooms — Fresh carpet improves comfort and aesthetics ↑
- Rental Clean and organize kitchen countertops — Keeps the kitchen looking tidy and inviting ↑
ⓘ Cost ranges are severity-bucket heuristics (US national rule-of-thumb). Get contractor quotes + a written scope before underwriting a rehab budget.
Schools (NCES district)
- District
- Lee
- NCES district ID
- 1201080
- Math proficiency
- 47% ▼ -11.00%
- Reading proficiency
- 50% ▼ -4.00%
- Median HH income
- $49,518
- Composite
- 41.49/100
- National rank
- #3458
- State rank
- #42 of 73 in FL
Livability — Lehigh Acres
- Score
- 59/100
- State rank
- #826
- US rank
- #20055
Category grades
Schools grade is shown separately in the Schools card above.
Census & demographics
- Census place
- Lehigh Acres, FL
- County
- Lee County · 788,662 people
- City population
- 130,638
- Metro
- Cape Coral-Fort Myers, FL
- Population (ZIP)
- 27,967
- Household income
- $51,417
- Rent vs Own
- Severe rent burden
- 1027.0
Population outlook (Lee County) Hauer SSP2
- Today (2025)
- 871,946 people
- By 2030
- 955,468 · +9.6%
- By 2040
- 1,113,587 · +27.7%
- By 2050
- 1,256,891 · +44.1%
- By 2075
- 1,560,270 · +78.9%
- By 2100
- 1,726,848 · +98.0%
Race, ethnicity, and origin ACS 2023
- Neighborhood character
- Diverse neighborhood (Simpson 0.63)
- Race & ethnicity
- Hispanic / Latino 44% White 41% Two or more races 21% Black 9% Asian 1%
- Hispanic origin (detail)
- Mexican 7% Puerto Rican 9% Cuban 18% Dominican 2%
- Common ancestry
- Hispanic 3% Romanian 2% Lithuanian 1%
- Foreign-born
- 28% · Canada, Jamaica
- Languages at home
- 59% English-only · Spanish 36% French/Haitian/Cajun 3% Tagalog/Filipino 1%
Political lean MEDSL · Lee
- 2024 margin
- Strong R (+28.4) · D 35.5% · R 63.9%
- 2008→2024 swing
- -18.0pp toward R · 2008: -10.4pp · 2024: -28.4pp
- All cycles
- 2024: R+28.4 2020: R+19.2 2016: R+20.4 2012: R+16.6 2008: R+10.4
Not yet ingested
- Civics
- —
Market trends
- HPI YoY
- ▼ -86.78%
- Current HPI
- 348.8631
- Rent YoY
- ▼ -0.77%
- Metro
- Cape Coral-Fort Myers, FL
- State GDP YoY
- ▲ 3.28%
- F500 in state
- 36
Industry mix (Fortune 500 HQ in FL)
| Industry | F500 HQs | Revenue |
|---|---|---|
| Industrial Technology | 2 | $29B |
|
||
| Insurance | 2 | $17B |
|
||
| Retail | 1 | $60B |
|
||
| Technology Distribution | 1 | $58B |
|
||
| Homebuilding | 1 | $35B |
|
||
| Technology Manufacturing | 1 | $35B |
|
||
Price history
1 event — show timeline
- 2026-06-03 Listed $159,000 FORTMLS
Cash-flow waterfall
monthlySold comps — $/sqft
last 12 mo · ≤1 miLoading sold comps…