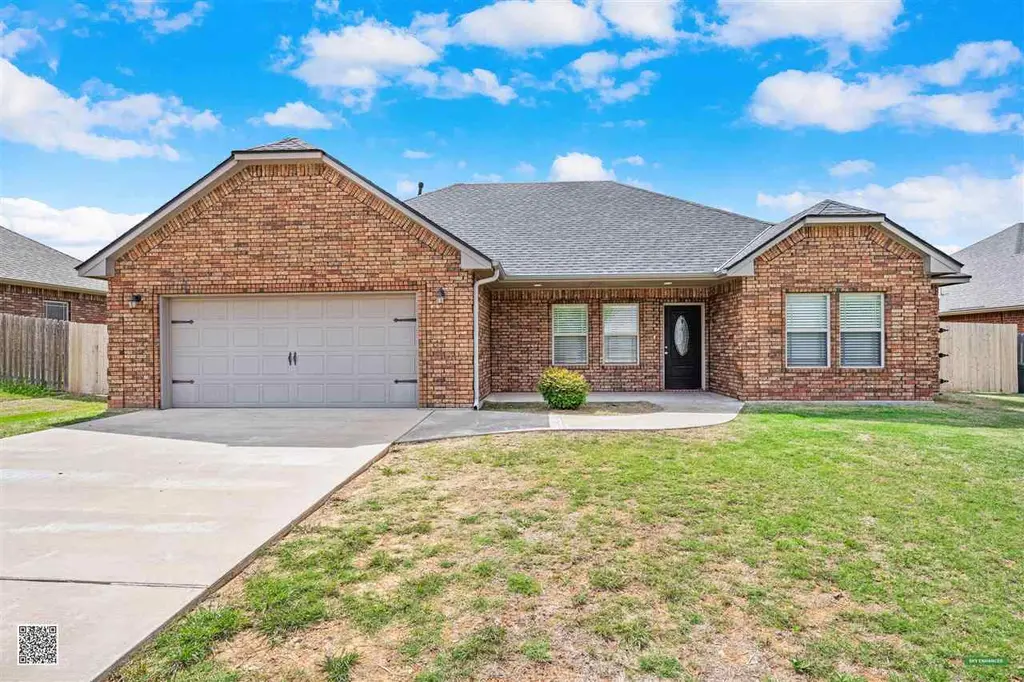
35 Blue Meadow Dr · Elgin, OK
Flood risk 1/10 · Minimal
- FEMA flood zone
- X (unshaded)
- Chance of flooding over 30 yrs
- 0.0%
- Est. flood insurance / yr
- $507 – $1,088
Fire risk 8/10 · Major
- Est. fire insurance / yr
- $2,463 – $4,575
Heat risk 6/10 · Moderate
- Hot days now (above 108°F)
- 7 days/yr
- Hot days in 30 yrs
- 19 days/yr
Wind risk 3/10 · Minor
- Chance of severe wind over 30 yrs
- 6.0%
Air-quality risk 1/10 · Minimal
- Unhealthy air days now
- 0 days/yr
- Unhealthy air days in 30 yrs
- 0 days/yr
Risk factors via First Street. Map © Google.
Why this score? — see what drove the D+ grade
The composite is a weighted blend of 9 inputs, each scored 0–100. Each bar is that input's sub-score; the figure is the points it added to the 100-point composite (weight × sub-score).
- Cash flow +11.8/30.0
- Appreciation +10.0/10.0
- ARV discount +7.1/15.0
- Livability +3.7/5.0
- DSCR +3.5/10.0
- Schools +3.0/10.0
- 1% rule +2.9/10.0
- Rent growth +2.5/5.0
- Condition / age +2.5/5.0
$264,900
🖨 Deal sheet (PDF) 📄 Offer letter ✓ Due diligence
Listing remarks
Welcome to this beautifully maintained home located in the highly sought-after Elgin public school district. Nestled in a quiet cul-de-sac, this approximately 1700 sq ft home offers the perfect blend of comfort, functionality, and modern finishes. A brand-new wood privacy fence adds both security and charm to the spacious backyard- ideal for relaxing evenings or entertaining guests. Step inside to a thoughtfully designed split floor plan featuring 4 bedrooms and 2 full bathrooms. The open concept living, dining and Kitchen area creates a seamless flow, perfect for everyday living and hosting. The kitchen is equipped with stainless steel appliances, granite countertops, a large pantry and am
Key facts
- Open concept living
- Spacious backyard
- Split floor plan
Tags
Property features AI
Exterior
- Parking: 2 total parking spaces; 2 covered spaces; 2-car garage with garage door opener; Driveway; Also has open parking
- Security: Carbon monoxide detector; Smoke detectors
- Utilities: Public water; Public sewer; Natural gas available
- Home design: Single-family residence; One level
- Construction: Brick veneer construction; Composition roof; Slab foundation; Built in 2026
- Exterior features: Covered patio and porch; Porch; Wood fencing; Cul-de-sac lot
Interior
- Kitchen: Cooktop; Oven; Microwave; Dishwasher; Garbage disposal; Refrigerator; Granite counters; Kitchen island; Breakfast bar; Pantry
- Flooring: Ceramic tile
- Bathrooms: 2 full bathrooms
- Heating & cooling: Central heating (natural gas); Fireplace heating; Central air; Ceiling fans; Electric cooling
- Interior features: Breakfast bar; Kitchen island; Walk-in closets; Pantry; Granite counters; Double-pane windows; Window coverings; Gas, ventless fireplace
- Laundry & utility: Washer hookup; Washer; Dryer; Gas water heater
Neighborhood map
What this means for you Summary
Snapshot
- This is a 4-bed/2.0-bath single-family listed at $265k.
Deal economics
- At list price, monthly cash flow is $-72 ($-864/yr) — negative.
- To cash-flow at today's rent, offer at most $252k (4.8% below list).
- To meet the 1% rule (rent ≥ 1% of price), the offer needs to be $208k (21.5% below list).
- Recommended offer: $208k (21.5% below list) — sets the bar for 1% rule.
Location & tenants
- Location reads 73/100 on livability (#17 in OK) — a middle-class / working-renter tenant base. Strengths: crime A+, housing A+, cost of living A; Watch: amenities F, commute F, health & safety F.
- Elgin (rural): math 29% / reading 36% proficiency, ranked #38 of 270 in OK (top 14%) — families likely to look elsewhere, expect single-tenant / working-renter base with shorter leases.
- Zoned schools: Elgin Es (math 36% / reading 33%, grade F, #168 of 845 statewide, top 24%, 945 students, 0% FRL); Elgin Ms (math 26% / reading 34%, grade F, #49 of 345 statewide, top 15%, 791 students, 0% FRL); Elgin Hs (math 27% / reading 47%, grade F, #42 of 447 statewide, top 10%, 771 students, 0% FRL) — zoned schools average 0% FRL vs 29% district-wide (29 pts lower); this property's tenant base skews higher-income than the district average.
- Market conditions: 96 active listings in the ZIP; 5 comparable units currently listed for rent nearby; rentals at typical pace (median 23d on market — plan ~3-4 weeks tenant-placement turnaround); solid renter incomes; 133 units permitted in Comanche County in 2024 (0 in 5+ unit buildings).
Forward outlook
- In year one you build about $28k of equity ($2k loan paydown + $26k appreciation (10.0% local appreciation)).
- Comanche County population projected to shrink 3% by 2050 — rents likely to lag national; underwrite the cash flow, not the appreciation.
- At projected returns (10.0% appreciation + 3.0% rent growth), your $74k cash investment doubles in ~3 years — after that, you're playing with house money.
- By year 2, paydown + projected appreciation supports a ~$46k cash-out refi (75% LTV) — recoverable capital for the next deal without selling this one.
Negotiation context
- Only 13 days on market — expect competitive offers; lowballing is unlikely to land.
- 3 sale attempts with the ask held roughly flat each time — persistent listings suggest the price (not the market) is what's stuck; bring a comps-based counter.
- Current owner paid $80k; list at $265k implies a 231% gain — meaningful room to come down on a strong offer.
Risks & watch-outs
- Climate carrying-cost: severe wildfire risk; extreme-heat days projected 7→19/yr by 2055 (HVAC capex compounding) — expect insurance premiums to compound above CPI over the hold.
Questions for the listing agent
- What do current leases actually rent for vs. the listed asking? Can we see a recent rent roll and the last 12 months of T-12 income?
- Is there a deadline driving the sale (1031 exchange, divorce, estate, relocation)? That informs how much negotiation room exists.
- The area grade is low — what's the realistic commute time and amenity access for the typical tenant pool here? Any planned neighborhood developments (good or bad) we should know about?
- What's the average days-on-market for RENTAL listings here right now (not sales)? A rising rental-DOM trend means longer vacancies and softer asking-rent achievability than the comps imply.
- What's the recent tenant-quality profile in this submarket — average credit score on applications, eviction rate, late-payment / NSF rate, and stable-employment percentage? A property-management company in the area should have these aggregated.
- How much new for-sale + rental construction is in the pipeline within 1–3 miles? Heavy new supply typically softens prices + rents 12–24 months out; constrained supply supports both.
Investment metrics
- 1% rule
- 0.79% ✗
- Cap rate
- 5.97%
- Cash-on-cash
- -1.16%
- DSCR
- 0.95
- GRM
- 10.6
CMA / ARV
- ARV (on-the-fly)
- $262,504
- Comps found
- 12
Show comp detail 12 sales within ~0.75 mi
| Address | Dist | Beds/Ba | Sqft | Sold | Price | $/sf | Match |
|---|---|---|---|---|---|---|---|
| 33 Blue Mdw | 0.02mi | 4/2.0 | 1,700 (+2%) | 1mo | $255,000 | $150 | 96 |
| 18 NE Summerwood Dr | 0.07mi | 4/2.0 | 1,700 (+2%) | 3mo | $255,000 | $150 | 92 |
| 16 Summerwood Dr | 0.04mi | 4/2.0 | 1,800 (+8%) | 1mo | $260,000 | $144 | 84 |
| 1404 Limestone Way | 0.36mi | 4/2.0 | 1,700 (+2%) | 2mo | $267,000 | $157 | 79 |
| 1430 Limestone Way | 0.44mi | 4/2.0 | 1,564 (-6%) | 0mo | $245,000 | $157 | 68 |
| 1414 Limestone Way | 0.41mi | 4/2.0 | 1,805 (+8%) | 1mo | $275,000 | $152 | 67 |
| 1325 NE Saddle Rock Dr | 0.38mi | 4/2.0 | 1,800 (+8%) | 3mo | $267,000 | $148 | 67 |
| 1420 Limestone Way | 0.43mi | 4/2.0 | 1,800 (+8%) | 1mo | $290,000 | $161 | 67 |
| 1209 Pebble Trl | 0.36mi | 4/2.0 | 1,800 (+8%) | 5mo | $282,500 | $157 | 66 |
| 1206 Hershel Dr | 0.31mi | 3/2.0 (-1) | 1,500 (-10%) | 0mo | $240,000 | $160 | 63 |
| 1511 NE Stonehouse Dr | 0.46mi | 4/2.0 | 1,800 (+8%) | 4mo | $281,000 | $156 | 62 |
| 1110 Apple Creek Dr | 0.40mi | 4/2.0 | 1,900 (+14%) | 2mo | $299,000 | $157 | 57 |
Match score weights: distance 35% · size 25% · config 20% · recency 20%. Top-matched comps best support the ARV.
Projected returns pro-forma
10.0% appreciation · 3.0% rent growth · sell at horizon
- IRR
- 23.4%
- Equity multiple
- 2.88×
- Total profit
- $139,648
- Equity at exit
- $238,643
- IRR
- 20.9%
- Equity multiple
- 6.59×
- Total profit
- $414,767
- Equity at exit
- $514,642
Cash invested: $74,172 (down + closing). Projections, not guarantees.
Landlord ↔ Tenant lean methodology
- Overall (STATE)
- 83 Strongly Landlord-Friendly
- State Oklahoma
- 83 Strongly Landlord-Friendly · R+20
- County
- — inherits STATE
- City
- — inherits STATE
ZIP-level market 73538
- Home prices YoY
- 22.9%
- Active inventory
- 96
- Price-to-rent
- 10.6×
Monthly cashflow live
- Estimated rent
- $2,080 high interval (Pro) →
- Mortgage (P&I)
- −$1,389
- Tax from tax record
- −$216 /mo · $2,592/yr
- Insurance
- −$110
- HOA
- −$0
- Vacancy / Maint / Mgmt
- −$437
- Net cashflow
- $-72
Break-even live
Sensitivity live
| Price | -10% $78 | -5% $3 | +0% $-72 | +5% $-147 | +10% $-222 |
|---|---|---|---|---|---|
| Rent | -10% $-236 | -5% $-154 | +0% $-72 | +5% $10 | +10% $92 |
| Rate | -1.0pp $61 | -0.5pp $-5 | base $-72 | +0.5pp $-141 | +1.0pp $-210 |
UW: 25.0% down · 7.5% · 30yr · 1.5% tax · 5.0% vac · 8.0% maint · 8.0% mgmt
Financing live
Cash to close
- Down payment
- $66,225
- Closing costs
- $7,947
- Reserves months
- —
- Total cash needed
- —
Loan-product check · same deal, 3 products live
Conventional
25% down · 7.5% · 30yr
- Down + closing
- —
- Monthly P&I
- —
- Monthly cashflow
- —
- DSCR
- —
- Eligible?
- —
Personal DTI + credit; lowest rate.
DSCR
20% down · 8.5% · 30yr
- Down + closing
- —
- Monthly P&I
- —
- Monthly cashflow
- —
- DSCR
- —
- Eligible?
- —
No personal income docs; deal must DSCR.
Hard money
10% down · 12.0% · 12mo
- Down + closing
- —
- Monthly P&I
- —
- Monthly cashflow
- —
- DSCR
- —
- Eligible?
- —
Short-term bridge; refi at stabilization.
Rent comps 5 comps
| Address | Beds | Baths | Sqft | Rent | $/sqft | DOM | Units | Dist |
|---|---|---|---|---|---|---|---|---|
| 1205 Alma Dr Elgin, OK | 4.0 | 2.0 | 1800 | $1,900 | $1.06 | 13d | 1 | 0.27mi |
| 107 Oak St Elgin, OK | 4.0 | 1.0 | 1300 | $1,295 | $1.00 | 13d | 1 | 0.40mi |
| 1517 Stonehouse Dr Elgin, OK | 4.0 | 2.0 | 1565 | $1,700 | $1.09 | 23d | 1 | 0.46mi |
| 1534 Stonehouse Dr Elgin, OK | 3.0 | 2.0 | 1700 | $1,975 | $1.16 | 25d | 1 | 0.46mi |
| 313 Marilyn Glover Dr Elgin, OK | 3.0 | 2.0 | 1600 | $1,650 | $1.03 | 25d | 1 | 1.22mi |
Listing history 8 events
-
2026-05-19status Pending
-
2026-05-13historical Active Under Contract
-
2026-05-05$264,900 Active
-
2025-10-22soldstatus $80,000
-
2025-08-10historical $1,900
-
2025-07-26$1,900
-
2025-03-09historical $1,800
-
2025-01-28$1,800
ⓘ Source: listings_history table (triggers on properties + properties_extension) + one-shot
backfill from property_details.listing_events for pre-trigger history.
Tax reassessment forecast OK · Resets to sale price
- Current annual tax
- $2,592 · $216/mo
- Projected year-2 tax
- $2,592 · $216/mo
- Expected delta
- $0/yr ($0/mo · 0.0%)
ⓘ Screening estimate from a state-policy table — verify with the county assessor before closing.
Climate risk First Street
- Flood 1/10 Low FEMA zone X (unshaded) · 0% chance over 30 yrs
- Wildfire 8/10 Severe
- Heat 6/10 Major 7 d/yr ≥108°F today · 19 d/yr by 30 yrs out
- Wind 3/10 Moderate 6% chance of damaging wind over 30 yrs
- Air quality 1/10 Low 0 unhealthy d/yr today · 0 by 30 yrs out
Nearby sold comps map
Loading sold comps map…
Walkable amenities ~0.75 mi
Loading nearby amenities…
Taxation est. · year 1
- Rental income
- $24,966
- − Mortgage interest
- −$14,839
- − Property taxes
- −$2,592
- − Insurance
- −$1,324
- − Repairs & maintenance
- −$1,997
- − Management
- −$1,997
- − Depreciation
- −$7,706
- Taxable loss
- −$5,490
- Est. tax savings @ 24.0%
- +$1,318
- After-tax cash flow
- $454/yr
For passive investors: Depreciation is non-cash, so a rental often shows a tax loss while cash-flowing — sheltering income. Rental losses are passive: they offset passive income freely, and up to $25,000/yr can offset ordinary (W-2) income if you actively participate and your MAGI is under $100k (phasing out to $0 by $150k); unused losses carry forward. On sale, claimed depreciation is recaptured at up to 25%, and gains may owe capital-gains tax (a 1031 exchange can defer both). Figures are a year-1 estimate at your 24.0% rate — not tax advice; consult a CPA.
Schools (NCES district)
- District
- Elgin
- NCES district ID
- 4010710
- Math proficiency
- 29% ▼ -9.00%
- Reading proficiency
- 36% ▼ -5.00%
- Median HH income
- $65,900
- Composite
- 29.77/100
- National rank
- #6432
- State rank
- #38 of 270 in OK
Livability — Elgin
- Score
- 73/100
- State rank
- #17
- US rank
- #5411
Category grades
Schools grade is shown separately in the Schools card above.
Census & demographics
- Census place
- Elgin, OK
- County
- Comanche County · 96,361 people
- City population
- 7,128
- Metro
- Lawton, OK
- Population (ZIP)
- 7,128
- Household income
- $91,324
- Rent vs Own
- Severe rent burden
- 70.0
Population outlook (Comanche County) Hauer SSP2
- Today (2025)
- 124,518 people
- By 2030
- 124,231 · -0.2%
- By 2040
- 122,193 · -1.9%
- By 2050
- 120,368 · -3.3%
- By 2075
- 120,492 · -3.2%
- By 2100
- 123,113 · -1.1%
Race, ethnicity, and origin ACS 2023
- Neighborhood character
- Predominantly White (71%)
- Race & ethnicity
- White 71% Two or more races 15% Hispanic / Latino 13% Native American 4% Black 2% Asian 1%
- Hispanic origin (detail)
- Mexican 11% Puerto Rican 2%
- Common ancestry
- Slovak 5% Romanian 2% Serbian 1%
- Foreign-born
- 3% · Canada
- Languages at home
- 93% English-only · Spanish 4% German/W. Germanic 1%
Political lean MEDSL · Comanche
- 2024 margin
- Strong R (+23.3) · D 37.4% · R 60.7% · Other 1.9%
- 2008→2024 swing
- -5.8pp toward R · 2008: -17.5pp · 2024: -23.3pp
- All cycles
- 2024: R+23.3 2020: R+20.1 2016: R+23.7 2012: R+17.0 2008: R+17.5
Not yet ingested
- Civics
- —
Market trends
- HPI YoY
- ▲ 45.70%
- Current HPI
- 245.4249
- Rent YoY
- —
- Metro
- Lawton, OK
- State GDP YoY
- ▲ 1.55%
- F500 in state
- 6
Industry mix (Fortune 500 HQ in OK)
| Industry | F500 HQs | Revenue |
|---|---|---|
| Energy | 3 | $48B |
|
||
Price history
+14616.7% since first listed8 events — show timeline
- 2026-05-19 Pending — LBRMLS
- 2026-05-13 Contingent — LBRMLS
- 2026-05-05 Listed $264,900 LBRMLS
- 2025-10-22 Sold (Public Records) $80,000 Public Records
- 2025-08-10 Rental Removed $1,900 BUILDIUM
- 2025-07-26 Listed for Rent $1,900 BUILDIUM
- 2025-03-09 Rental Removed $1,800 BUILDIUM
- 2025-01-28 Listed for Rent $1,800 BUILDIUM
Property tax history
+104.3%/yrLatest (2025): $2,592 · +1.1% YoY. Source: county tax records.
Cash-flow waterfall
monthlySold comps — $/sqft
last 12 mo · ≤1 miLoading sold comps…