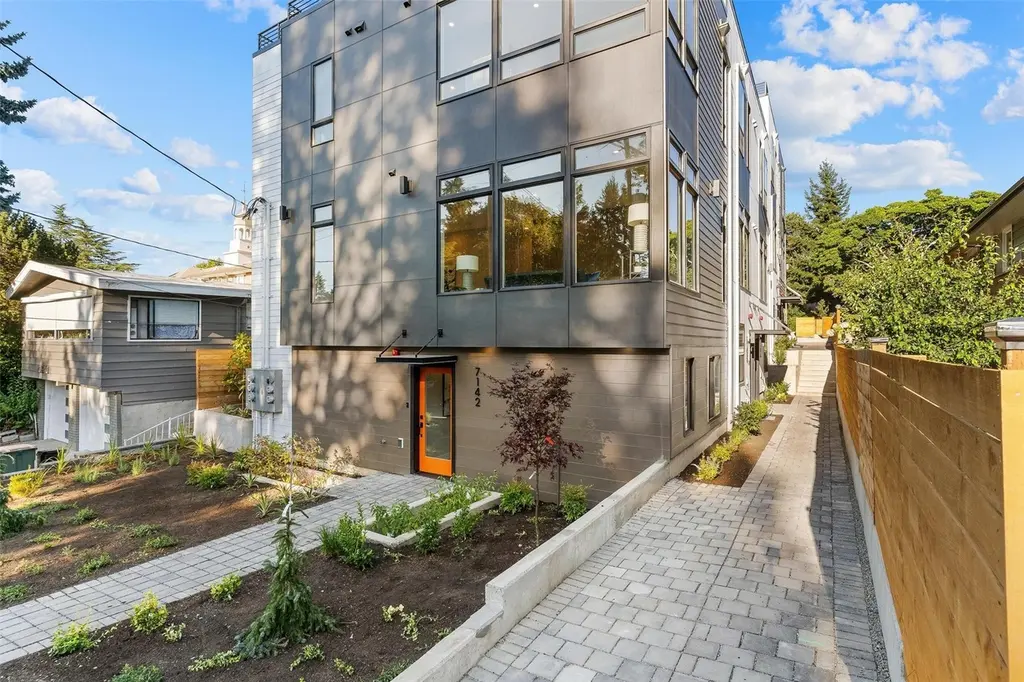
7144 47th Ave SW · Seattle, WA
Flood risk No data
- FEMA flood zone
- —
- Chance of flooding over 30 yrs
- —
- Est. flood insurance / yr
- —
Fire risk No data
- Est. fire insurance / yr
- —
Heat risk No data
- Hot days now (above threshold)
- —
- Hot days in 30 yrs
- —
Wind risk No data
- Chance of severe wind over 30 yrs
- —
Air-quality risk No data
- Unhealthy air days now
- —
- Unhealthy air days in 30 yrs
- —
Risk factors via First Street. Map © Google.
Why this score? — see what drove the D- grade
The composite is a weighted blend of 9 inputs, each scored 0–100. Each bar is that input's sub-score; the figure is the points it added to the 100-point composite (weight × sub-score).
- ARV discount +14.8/15.0
- Cash flow +6.1/30.0
- Schools +6.1/10.0
- Rent growth +4.5/5.0
- Livability +3.8/5.0
- Condition / age +2.5/5.0
- DSCR +0.5/10.0
- 1% rule +0.4/10.0
- Appreciation +0.0/10.0
$699,999
🖨 Deal sheet 📄 Offer letter ✓ Due diligence
Listing remarks
Enjoy modern living in these NEW CONSTRUCTION West Seattle townhomes. Designed for comfort, style & flexibility, this home offers street or alley entries The bright open layout will delight you, featuring a main level with beautiful spacious kitchen w/ quartz counters & stainless appliances, and hidden half bath. Upstairs, unwind in the luxurious primary suite w/ walk-in closet & spa-like bath. The spacious home also offers 2 more bedrooms, full bath & private lower entrance—perfect for guests or office. The roomy and private 450 sq ft rooftop deck showcases Puget Sound & Olympic Mtn. views. Sitting on a quiet street, you are close to everything West S
Key facts
- Spa-like bath
- Hidden half bath
- New construction
Tags
Neighborhood map
What this means for you Summary
Snapshot
- This is a 3-bed/2.5-bath townhouse listed at $700k.
Deal economics
- At list price, monthly cash flow is $-1k ($-16k/yr) — negative.
- To cash-flow at today's rent, offer at most $471k (32.7% below list).
- To meet the 1% rule (rent ≥ 1% of price), the offer needs to be $379k (45.8% below list).
- Recommended offer: $379k (45.8% below list) — sets the bar for 1% rule.
- Cap rate 4.1% vs local median 1.6% in Seattle — top-decile yield for the area; either an underpriced asset or a hidden risk that comps aren't pricing in. Stress-test before assuming the spread holds.
Location & tenants
- Location reads 75/100 on livability (#166 in WA, #4,033 nationally) — a middle-class / working-renter tenant base. Strengths: amenities A+, commute A+, employment A+; Watch: crime F, cost of living F.
- Seattle Public Schools (urban): math 64% / reading 72% proficiency, ranked #19 of 291 in WA (top 6%) — acceptable for families but not a draw, mixed tenant base, ~2y average lease.
- Market conditions: Rents rising fast (+7.8%/yr); 109 active listings in the ZIP; 14 comparable units currently listed for rent nearby; rentals leasing fast (median 2d on market — plan ~1-2 weeks tenant-placement turnaround); high-income renter base; 10,555 units permitted in King County in 2024 (7,119 in 5+ unit buildings).
- This rent runs 31% of the median local income ($149k/yr) — at the standard rent-burdened threshold; future hikes will face affordability resistance.
Forward outlook
- Local home prices are declining (-3.0%/yr); year-one equity from $5k of loan paydown is wiped out by about $21k of value loss. Plan a longer hold.
- King County population projected at +44% by 2050 — long-run rental-demand tailwind backs the buy-and-hold thesis.
Negotiation context
- It's been on market 188 days — a 12% lower offer ($616k) is reasonable based on typical stale-listing flexibility.
Questions for the listing agent
- What do current leases actually rent for vs. the listed asking? Can we see a recent rent roll and the last 12 months of T-12 income?
- It's been on market 188 days. Have you received any prior offers? Is the seller open to a 46% concession, seller financing, or rate buy-down credit?
- Why hasn't it sold? Are there any deal-killer items the seller is aware of (foundation, flood, title, zoning, code violations)?
- Is there a deadline driving the sale (1031 exchange, divorce, estate, relocation)? That informs how much negotiation room exists.
- Schools are A-rated — typically a magnet for longer-tenancy family renters. What's the average tenant stay here, and is there a school-zone premium baked into asking?
- Crime grade is F in this area — have there been break-ins, vandalism, or insurance claims at this property in the last 3 years? What carrier currently insures it and at what premium?
- The area grade is low — what's the realistic commute time and amenity access for the typical tenant pool here? Any planned neighborhood developments (good or bad) we should know about?
- What's the average days-on-market for RENTAL listings here right now (not sales)? A rising rental-DOM trend means longer vacancies and softer asking-rent achievability than the comps imply.
- What's the recent tenant-quality profile in this submarket — average credit score on applications, eviction rate, late-payment / NSF rate, and stable-employment percentage? A property-management company in the area should have these aggregated.
- How much new for-sale + rental construction is in the pipeline within 1–3 miles? Heavy new supply typically softens prices + rents 12–24 months out; constrained supply supports both.
Investment metrics
- 1% rule
- 0.54% ✗
- Cap rate
- 4.07%
- Cash-on-cash
- -7.93%
- DSCR
- 0.65
- GRM
- 15.4
CMA / ARV
- ARV (median comp)
- $835,628
- List price
- $699,999
- Delta
- -16.23%
- Verdict
- UNDERPRICED
- Comps
- 20 within 1.0 mi
Show comp detail 12 sales within ~0.75 mi
| Address | Dist | Beds/Ba | Sqft | Sold | Price | $/sf | Match |
|---|---|---|---|---|---|---|---|
| 7142 47th Ave SW | 0.00mi | 3/2.5 | 1,540 (+3%) | 6mo | $775,000 | $503 | 90 |
| 7323 Bainbridge Pl SW | 0.07mi | 3/2.5 | 1,566 (+4%) | 10mo | $875,000 | $559 | 81 |
| 7019 47th Ave SW #3 | 0.11mi | 2/2.0 (-1) | 1,550 (+3%) | 10mo | $925,000 | $597 | 74 |
| 6920 California Ave SW #45 | 0.35mi | 3/2.0 | 1,543 (+3%) | 5mo | $655,000 | $424 | 73 |
| 7321 47th Ave SW Unit B | 0.07mi | 3/3.0 | 1,640 (+9%) | 10mo | $694,000 | $423 | 71 |
| 6531 42nd Ave SW Unit C | 0.48mi | 3/1.5 | 1,480 (-1%) | 1mo | $695,000 | $470 | 70 |
| 6402 Fauntleroy Way SW | 0.60mi | 3/2.5 | 1,549 (+3%) | 4mo | $786,500 | $508 | 64 |
| 4300 SW Mills St | 0.34mi | 3/2.5 | 1,344 (-10%) | 8mo | $725,000 | $539 | 61 |
| 6032 42nd Ave SW Unit B | 0.72mi | 3/2.5 | 1,484 (-1%) | 10mo | $725,000 | $489 | 56 |
| 6037 42nd Ave SW Unit B | 0.70mi | 3/2.5 | 1,394 (-7%) | 0mo | $670,000 | $481 | 56 |
| 6032 42nd Ave SW Unit A | 0.72mi | 3/2.5 | 1,554 (+4%) | 10mo | $815,000 | $524 | 52 |
| 6408 Fauntleroy Way SW | 0.57mi | 3/2.5 | 1,312 (-12%) | 1mo | $688,000 | $524 | 52 |
Match score weights: distance 35% · size 25% · config 20% · recency 20%. Top-matched comps best support the ARV.
Projected returns pro-forma
-3.0% appreciation · 7.8% rent growth · sell at horizon
- IRR
- -25.9%
- Equity multiple
- 0.10×
- Total profit
- $-177,014
- Equity at exit
- $104,372
- IRR
- -13.0%
- Equity multiple
- 0.11×
- Total profit
- $-174,448
- Equity at exit
- $60,523
Cash invested: $196,000 (down + closing). Projections, not guarantees.
Landlord ↔ Tenant lean methodology
- Overall (CITY)
- 0 Strongly Tenant-Friendly
- State Washington
- 28 Tenant-Leaning · D+8
- County
- — inherits STATE
- City Seattle
- 0 Strongly Tenant-Friendly · D+52
ZIP-level market 98136
- Rents YoY
- 7.8%
- Active inventory
- 109
- Price-to-rent
- 15.4×
Monthly cashflow live
- Estimated rent
- $3,794 high interval (Pro) →
- Mortgage (P&I)
- −$3,671
- Tax from tax record
- −$331 /mo · $3,969/yr
- Insurance
- −$292
- HOA
- −$0
- Vacancy / Maint / Mgmt
- −$797
- Net cashflow
- $-1,296
Break-even live
UW: 25.0% down · 7.5% · 30yr · 1.5% tax · 5.0% vac · 8.0% maint · 8.0% mgmt
Financing live
Cash to close
- Down payment
- $175,000
- Closing costs
- $21,000
- Reserves months
- —
- Total cash needed
- —
Loan-product check · same deal, 3 products live
Conventional
25% down · 7.5% · 30yr
- Down + closing
- —
- Monthly P&I
- —
- Monthly cashflow
- —
- DSCR
- —
- Eligible?
- —
Personal DTI + credit; lowest rate.
DSCR
20% down · 8.5% · 30yr
- Down + closing
- —
- Monthly P&I
- —
- Monthly cashflow
- —
- DSCR
- —
- Eligible?
- —
No personal income docs; deal must DSCR.
Hard money
10% down · 12.0% · 12mo
- Down + closing
- —
- Monthly P&I
- —
- Monthly cashflow
- —
- DSCR
- —
- Eligible?
- —
Short-term bridge; refi at stabilization.
Rent comps 14 comps
| Address | Beds | Baths | Sqft | Rent | $/sqft | DOM | Units | Dist |
|---|---|---|---|---|---|---|---|---|
| 7331 Fauntleroy Way SW Seattle, WA | 4.0 | 2.5 | 1889 | $4,950 | $2.62 | 1d | 1 | 0.07mi |
| 7311 40th Ave SW Seattle, WA | 3.0 | 2.0 | 1800 | $3,745 | $2.08 | 1d | 1 | 0.42mi |
| 6708 California Ave SW Unit 3 Seattle, WA | 2.0 | 1.0 | 1080 | $2,395 | $2.22 | 14d | 1 | 0.43mi |
| 6708 California Ave SW Seattle, WA | 2.0 | 1.0 | 1080 | $2,295 | $2.12 | 1d | 1 | 0.43mi |
| 4143 SW Kenyon St Seattle, WA | 4.0 | 2.0 | 1740 | $4,495 | $2.58 | 1d | 1 | 0.51mi |
| 4143 SW Kenyon St Seattle, WA | 4.0 | 2.0 | 1740 | $4,495 | $2.58 | 2d | 1 | 0.51mi |
| 6500 34th Ave SW Seattle, WA | 2.0 | 2.0 | 1240 | $3,000 | $2.42 | 43d | 1 | 0.96mi |
| 6023 35th Ave SW Seattle, WA | 4.0 | 2.0 | 1980 | $4,395 | $2.22 | 1d | 1 | 1.01mi |
| 7734 31st Ave SW Seattle, WA | 2.0 | 2.0 | 1350 | $3,800 | $2.81 | 1d | 1 | 1.04mi |
| 5619 Fauntleroy Way SW Seattle, WA | 3.0 | 3.0 | 2000 | $3,500 | $1.75 | 43d | 1 | 1.06mi |
| 7527 29th Ave SW Seattle, WA | 3.0 | 1.5 | 1530 | $3,350 | $2.19 | 1d | 1 | 1.09mi |
| 2632 SW Myrtle St Seattle, WA | 2.0 | 2.5 | 1550 | $3,695 | $2.38 | 1d | 1 | 1.19mi |
| 5259 Fauntleroy Way SW Seattle, WA | 3.0 | 2.5 | 1278 | $3,750 | $2.93 | 19d | 1 | 1.23mi |
| 7901 Delridge Way SW Seattle, WA | 1.0–2.0 | 1.0–2.0 | 870 | $3,050 | $3.51 | 1d | 9 | 1.49mi |
Listing history 21 events
-
2026-06-19days on market $699,999 Active 188 DOM
-
2026-06-18price $699,999 Active 187 DOM
-
2026-06-18days on market $750,000 Active 187 DOM
-
2026-06-17days on market $750,000 Active 186 DOM
-
2026-06-16days on market $750,000 Active 185 DOM
-
2026-06-15days on market $750,000 Active 184 DOM
-
2026-06-15days on market $750,000 Active 183 DOM
-
2026-06-13days on market $750,000 Active 182 DOM
-
2026-06-12days on market $750,000 Active 181 DOM
-
2026-06-10days on market $750,000 Active 179 DOM
-
2026-06-09days on market $750,000 Active 178 DOM
-
2026-06-08days on market $750,000 Active 177 DOM
-
2026-06-07days on market $750,000 Active 176 DOM
-
2026-06-07days on market $750,000 Active 175 DOM
-
2026-06-04days on market $750,000 Active 173 DOM
-
2026-06-03days on market $750,000 Active 172 DOM
-
2026-06-02days on market $750,000 Active 171 DOM
-
2026-06-01days on market $750,000 Active 170 DOM
-
2026-05-31days on market $750,000 Active 169 DOM
-
2026-03-27price $750,000
-
2025-12-13$775,000 Active
ⓘ Source: listings_history table (triggers on properties + properties_extension) + one-shot
backfill from property_details.listing_events for pre-trigger history.
Tax reassessment forecast WA · Resets to sale price
- Current annual tax
- $3,969 · $331/mo
- Projected year-2 tax
- $6,860 · $572/mo
- Expected delta
- +$2,891/yr (+$241/mo · 72.8%)
ⓘ Screening estimate from a state-policy table — verify with the county assessor before closing.
Nearby sold comps map
Loading sold comps map…
Walkable amenities ~0.75 mi
Loading nearby amenities…
Taxation est. · year 1
- Rental income
- $45,534
- − Mortgage interest
- −$39,211
- − Property taxes
- −$3,969
- − Insurance
- −$3,500
- − Repairs & maintenance
- −$3,643
- − Management
- −$3,643
- − Depreciation
- −$20,364
- Taxable loss
- −$28,795
- Est. tax savings @ 24.0%
- +$6,911
- After-tax cash flow
- $-8,637/yr
For passive investors: Depreciation is non-cash, so a rental often shows a tax loss while cash-flowing — sheltering income. Rental losses are passive: they offset passive income freely, and up to $25,000/yr can offset ordinary (W-2) income if you actively participate and your MAGI is under $100k (phasing out to $0 by $150k); unused losses carry forward. On sale, claimed depreciation is recaptured at up to 25%, and gains may owe capital-gains tax (a 1031 exchange can defer both). Figures are a year-1 estimate at your 24.0% rate — not tax advice; consult a CPA.
Schools (NCES district)
- District
- Seattle Public Schools
- NCES district ID
- 5307710
- Math proficiency
- 64% ▼ -1.00%
- Reading proficiency
- 72% ▬ 0.00%
- Median HH income
- $68,695
- Composite
- 60.76/100
- National rank
- #1649
- State rank
- #19 of 291 in WA
Livability — Seattle
- Score
- 75/100
- State rank
- #166
- US rank
- #4033
Category grades
Schools grade is shown separately in the Schools card above.
Census & demographics
- Census place
- Seattle, WA
- County
- King County · 2,251,916 people
- City population
- 706,262
- Metro
- Seattle-Tacoma-Bellevue, WA
- Population (ZIP)
- 17,252
- Household income
- $149,269
- Rent vs Own
- Severe rent burden
- 499.0
Population outlook (King County) Hauer SSP2
- Today (2025)
- 2,576,485 people
- By 2030
- 2,803,316 · +8.8%
- By 2040
- 3,255,921 · +26.4%
- By 2050
- 3,706,444 · +43.9%
- By 2075
- 4,746,063 · +84.2%
- By 2100
- 5,407,730 · +109.9%
Race, ethnicity, and origin ACS 2023
- Neighborhood character
- Predominantly White (77%)
- Race & ethnicity
- White 77% Two or more races 11% Hispanic / Latino 10% Asian 3% Black 2%
- Hispanic origin (detail)
- Mexican 7%
- Common ancestry
- Lithuanian 7% Portuguese 6% Italian 4%
- Foreign-born
- 11% · Canada, China, Vietnam
- Languages at home
- 88% English-only · Spanish 5% German/W. Germanic 1% Chinese 1%
Political lean MEDSL · King
- 2024 margin
- Solid D (+51.7) · D 74.2% · R 22.5% · Other 3.4%
- 2008→2024 swing
- +9.6pp toward D · 2008: 42.1pp · 2024: 51.7pp
- All cycles
- 2024: D+51.7 2020: D+52.7 2016: D+50.4 2012: D+39.9 2008: D+42.1
Not yet ingested
- Civics
- —
Market trends
- HPI YoY
- ▼ -1208.27%
- Current HPI
- 293.2998
- Rent YoY
- ▲ 7.80%
- Metro
- Seattle-Tacoma-Bellevue, WA
- State GDP YoY
- ▲ 4.65%
- F500 in state
- 22
Industry mix (Fortune 500 HQ in WA)
| Industry | F500 HQs | Revenue |
|---|---|---|
| Retail | 2 | $269B |
|
||
| Technology / Retail | 1 | $638B |
|
||
| Technology | 1 | $245B |
|
||
| Telecommunications | 1 | $38B |
|
||
| Food / Beverage | 1 | $36B |
|
||
| Automotive / Trucks | 1 | $34B |
|
||
Price history
-3.2% since first listed2 events — show timeline
- 2026-03-27 Price Changed $750,000 NWMLS as Distributed by MLS Grid
- 2025-12-13 Listed $775,000 NWMLS as Distributed by MLS Grid
Cash-flow waterfall
monthlySold comps — $/sqft
last 12 mo · ≤1 miLoading sold comps…