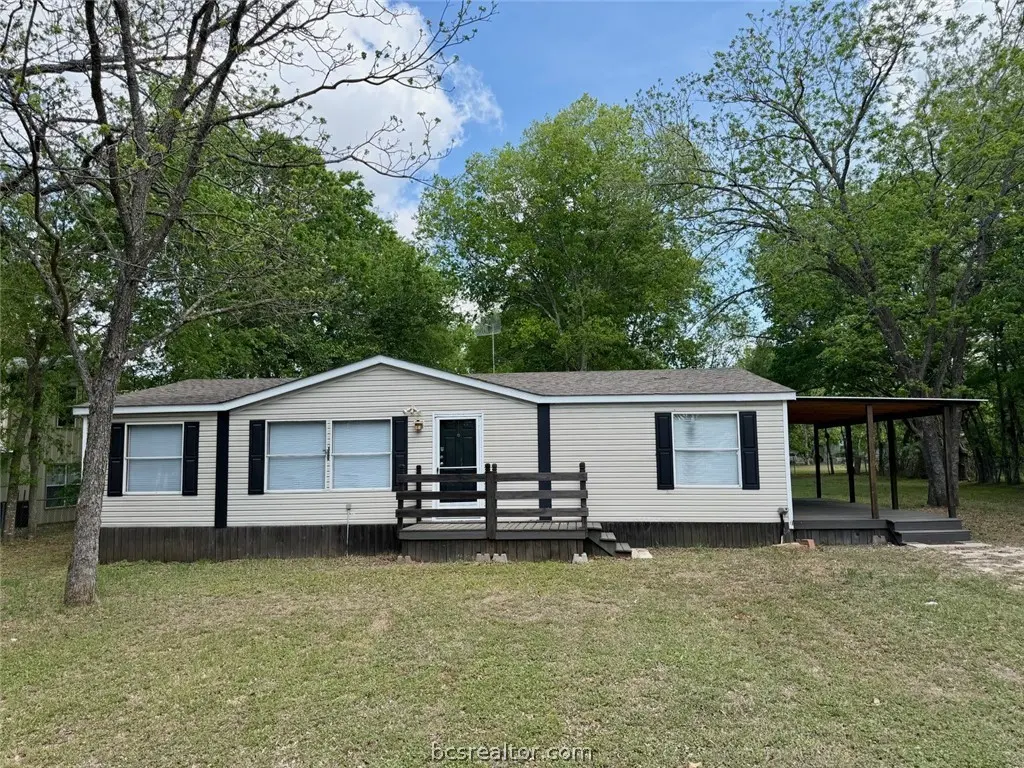
7125 St Hwy 21 · Caldwell, TX
Flood risk 1/10 · Minimal
- FEMA flood zone
- X (unshaded)
- Chance of flooding over 30 yrs
- 0.0%
- Est. flood insurance / yr
- $507 – $1,088
Fire risk 4/10 · Minor
- Est. fire insurance / yr
- $1,222 – $2,270
Heat risk 8/10 · Major
- Hot days now (above 110°F)
- 7 days/yr
- Hot days in 30 yrs
- 24 days/yr
Wind risk 8/10 · Major
- Chance of severe wind over 30 yrs
- 80.0%
Air-quality risk 1/10 · Minimal
- Unhealthy air days now
- 0 days/yr
- Unhealthy air days in 30 yrs
- 0 days/yr
Risk factors via First Street. Map © Google.
Why this score? — see what drove the D grade
The composite is a weighted blend of 9 inputs, each scored 0–100. Each bar is that input's sub-score; the figure is the points it added to the 100-point composite (weight × sub-score).
- Cash flow +14.5/30.0
- ARV discount +7.5/15.0
- DSCR +4.4/10.0
- Schools +3.9/10.0
- Livability +3.4/5.0
- 1% rule +3.3/10.0
- Rent growth +2.5/5.0
- Condition / age +2.5/5.0
- Appreciation +0.0/10.0
$199,999
🖨 Deal sheet 📄 Offer letter ✓ Due diligence
Listing remarks
This well-maintained 3-bedroom, 2-bath home features a desirable split floor plan and recent updates, including fresh neutral paint, updated bathrooms and a charming farmhouse feel. Appliances are stainless and just over a year old, and the roof was replaced in 2018. The property sits on a generous 0.60-acre lot with a spacious shaded backyard and a large covered side deck for outdoor gatherings. This property blends comfort, convenience, and country living. Conveniently located on Hwy 21, the home offers a short, easy commute to Caldwell or Bryan/College Station for shopping, dining, or entertainment. The home is in Caldwell ISD and is approximately 7–8 miles from Caldwell, 20 minute
Key facts
- Generous lot
- Split floor plan
- Stainless appliances
Tags
Property features AI
Exterior
- Parking: No designated parking
- Utilities: Water available; Electric service
- Home design: Manufactured home (residential); One story; Single-level entry
- Construction: Vinyl siding; Composition roof; Pillar/post/pier foundation; Built as a manufactured home
- Exterior features: Partial fencing; Level lot
Interior
- Kitchen: Dishwasher; Electric range; Microwave
- Flooring: Carpet; Laminate
- Bathrooms: 2 full bathrooms
- Heating & cooling: Central heating (electric); Central air; Ceiling fan(s)
- Interior features: Laminate countertops; Ceiling fans; Window treatments
- Laundry & utility: Washer hookup; Electric water heater
Neighborhood map
What this means for you Summary
Snapshot
- This is a 3-bed/2.0-bath manufactured listed at $200k.
Deal economics
- At list price, monthly cash flow is $45 ($543/yr) — positive.
- The deal already cash-flows at list — no discount required.
- To meet the 1% rule (rent ≥ 1% of price), the offer needs to be $165k (17.4% below list).
- Recommended offer: $165k (17.4% below list) — sets the bar for 1% rule.
- Cap rate 6.6% vs local median 4.0% in Caldwell — top-decile yield for the area; either an underpriced asset or a hidden risk that comps aren't pricing in. Stress-test before assuming the spread holds.
Location & tenants
- Location reads 68/100 on livability (#497 in TX) — a middle-class / working-renter tenant base. Strengths: crime A+, cost of living A+, housing A+; Watch: schools D, amenities F, commute F.
- Caldwell ISD (rural): math 44% / reading 45% proficiency, ranked #264 of 826 in TX (top 32%) — families likely to look elsewhere, expect single-tenant / working-renter base with shorter leases.
- Market conditions: 315 active listings in the ZIP; 44 units permitted in Burleson County in 2024 (0 in 5+ unit buildings).
Forward outlook
- Local home prices are declining (-3.0%/yr); year-one equity from $1k of loan paydown is wiped out by about $6k of value loss. Plan a longer hold.
Negotiation context
- It's been on market 48 days — a 3% lower offer ($194k) is reasonable based on typical stale-listing flexibility.
- 2 sale attempts since 4y ago with the ask held roughly flat each time — persistent listings suggest the price (not the market) is what's stuck; bring a comps-based counter.
Risks & watch-outs
- Climate carrying-cost: severe wind risk, 80% chance of damaging wind over 30y; extreme-heat days projected 7→24/yr by 2055 (HVAC capex compounding) — expect insurance premiums to compound above CPI over the hold.
Questions for the listing agent
- It's been on market 48 days. Have you received any prior offers? Is the seller open to a 17% concession, seller financing, or rate buy-down credit?
- Is there a deadline driving the sale (1031 exchange, divorce, estate, relocation)? That informs how much negotiation room exists.
- Schools are D-rated, which usually means shorter tenancies and higher turnover. Who's the typical renter profile here, and what's been the actual vacancy rate?
- The area grade is low — what's the realistic commute time and amenity access for the typical tenant pool here? Any planned neighborhood developments (good or bad) we should know about?
- What's the average days-on-market for RENTAL listings here right now (not sales)? A rising rental-DOM trend means longer vacancies and softer asking-rent achievability than the comps imply.
- What's the recent tenant-quality profile in this submarket — average credit score on applications, eviction rate, late-payment / NSF rate, and stable-employment percentage? A property-management company in the area should have these aggregated.
- How much new for-sale + rental construction is in the pipeline within 1–3 miles? Heavy new supply typically softens prices + rents 12–24 months out; constrained supply supports both.
Investment metrics
- 1% rule
- 0.83% ✗
- Cap rate
- 6.56%
- Cash-on-cash
- 0.97%
- DSCR
- 1.04
- GRM
- 10.1
CMA / ARV
No comps found within radius.
Projected returns pro-forma
-3.0% appreciation · 3.0% rent growth · sell at horizon
- IRR
- -14.8%
- Equity multiple
- 0.47×
- Total profit
- $-29,576
- Equity at exit
- $29,821
- IRR
- -6.2%
- Equity multiple
- 0.60×
- Total profit
- $-22,247
- Equity at exit
- $17,292
Cash invested: $56,000 (down + closing). Projections, not guarantees.
Landlord ↔ Tenant lean methodology
- Overall (STATE)
- 87 Strongly Landlord-Friendly
- State Texas
- 87 Strongly Landlord-Friendly · R+5
- County
- — inherits STATE
- City
- — inherits STATE
ZIP-level market 77836
- Home prices YoY
- -26.0%
- Active inventory
- 315
- Price-to-rent
- 10.1×
Monthly cashflow live
- Estimated rent
- $1,652 medium interval (Pro) →
- Mortgage (P&I)
- −$1,049
- Tax from tax record
- −$127 /mo · $1,528/yr
- Insurance
- −$83
- HOA
- −$0
- Vacancy / Maint / Mgmt
- −$347
- Net cashflow
- $45
Break-even live
UW: 25.0% down · 7.5% · 30yr · 1.5% tax · 5.0% vac · 8.0% maint · 8.0% mgmt
Financing live
Cash to close
- Down payment
- $50,000
- Closing costs
- $6,000
- Reserves months
- —
- Total cash needed
- —
Loan-product check · same deal, 3 products live
Conventional
25% down · 7.5% · 30yr
- Down + closing
- —
- Monthly P&I
- —
- Monthly cashflow
- —
- DSCR
- —
- Eligible?
- —
Personal DTI + credit; lowest rate.
DSCR
20% down · 8.5% · 30yr
- Down + closing
- —
- Monthly P&I
- —
- Monthly cashflow
- —
- DSCR
- —
- Eligible?
- —
No personal income docs; deal must DSCR.
Hard money
10% down · 12.0% · 12mo
- Down + closing
- —
- Monthly P&I
- —
- Monthly cashflow
- —
- DSCR
- —
- Eligible?
- —
Short-term bridge; refi at stabilization.
Listing history 18 events
-
2026-06-18days on market $199,999 Active 48 DOM
-
2026-06-17days on market $199,999 Active 47 DOM
-
2026-06-16days on market $199,999 Active 46 DOM
-
2026-06-15days on market $199,999 Active 45 DOM
-
2026-06-14days on market $199,999 Active 43 DOM
-
2026-06-13days on market $199,999 Active 42 DOM
-
2026-06-10days on market $199,999 Active 40 DOM
-
2026-06-09days on market $199,999 Active 39 DOM
-
2026-06-08days on market $199,999 Active 38 DOM
-
2026-06-07days on market $199,999 Active 37 DOM
-
2026-06-05days on market $199,999 Active 34 DOM
-
2026-06-02days on market $199,999 Active 32 DOM
-
2026-06-01days on market $199,999 Active 31 DOM
-
2026-05-31days on market $199,999 Active 30 DOM
-
2026-05-30days on market $199,999 Active 29 DOM
-
2026-05-01$199,999 Active 780-char remark
-
2022-09-27$214,900
-
2007-07-02soldstatus
ⓘ Source: listings_history table (triggers on properties + properties_extension) + one-shot
backfill from property_details.listing_events for pre-trigger history.
Tax reassessment forecast TX · Resets to sale price
- Current annual tax
- $1,528 · $127/mo
- Projected year-2 tax
- $3,660 · $305/mo
- Expected delta
- +$2,132/yr (+$178/mo · 139.5%)
ⓘ Screening estimate from a state-policy table — verify with the county assessor before closing.
Climate risk First Street
- Flood 1/10 Low FEMA zone X (unshaded) · 0% chance over 30 yrs
- Wildfire 4/10 Moderate
- Heat 8/10 Severe 7 d/yr ≥110°F today · 24 d/yr by 30 yrs out
- Wind 8/10 Severe 80% chance of damaging wind over 30 yrs
- Air quality 1/10 Low 0 unhealthy d/yr today · 0 by 30 yrs out
Nearby sold comps map
Loading sold comps map…
Walkable amenities ~0.75 mi
Loading nearby amenities…
Taxation est. · year 1
- Rental income
- $19,819
- − Mortgage interest
- −$11,203
- − Property taxes
- −$1,528
- − Insurance
- −$1,000
- − Repairs & maintenance
- −$1,586
- − Management
- −$1,586
- − Depreciation
- −$5,818
- Taxable loss
- −$2,901
- Est. tax savings @ 24.0%
- +$696
- After-tax cash flow
- $1,240/yr
For passive investors: Depreciation is non-cash, so a rental often shows a tax loss while cash-flowing — sheltering income. Rental losses are passive: they offset passive income freely, and up to $25,000/yr can offset ordinary (W-2) income if you actively participate and your MAGI is under $100k (phasing out to $0 by $150k); unused losses carry forward. On sale, claimed depreciation is recaptured at up to 25%, and gains may owe capital-gains tax (a 1031 exchange can defer both). Figures are a year-1 estimate at your 24.0% rate — not tax advice; consult a CPA.
Schools (NCES district)
- District
- Caldwell ISD
- NCES district ID
- 4812460
- Math proficiency
- 44% ▲ 3.00%
- Reading proficiency
- 45% ▬ 0.00%
- Median HH income
- $52,820
- Composite
- 38.5/100
- National rank
- #4181
- State rank
- #264 of 826 in TX
Livability — Caldwell
- Score
- 68/100
- State rank
- #497
- US rank
- #9927
Category grades
Schools grade is shown separately in the Schools card above.
Census & demographics
- Population (ZIP)
- 12,469
Population outlook (Burleson County) Hauer SSP2
- Today (2025)
- 18,066 people
- By 2030
- 18,174 · +0.6%
- By 2040
- 18,198 · +0.7%
- By 2050
- 18,110 · +0.2%
- By 2075
- 18,166 · +0.6%
- By 2100
- 16,949 · -6.2%
Race, ethnicity, and origin ACS 2023
- Neighborhood character
- Predominantly White (66%)
- Race & ethnicity
- White 66% Hispanic / Latino 21% Black 10% Two or more races 9%
- Hispanic origin (detail)
- Mexican 17%
- Common ancestry
- Lithuanian 2% Romanian 1% Slovak 1%
- Foreign-born
- 5% · Canada, Guatemala
- Languages at home
- 86% English-only · Spanish 13%
Political lean MEDSL · Burleson
- 2024 margin
- Solid R (+62.8) · D 18.2% · R 81.0%
- 2008→2024 swing
- -25.4pp toward R · 2008: -37.4pp · 2024: -62.8pp
- All cycles
- 2024: R+62.8 2020: R+57.6 2016: R+55.1 2012: R+46.0 2008: R+37.4
Not yet ingested
- Civics
- —
Market trends
- HPI YoY
- ▼ -65.96%
- Current HPI
- 187.5385
- Rent YoY
- —
- Metro
- —
- State GDP YoY
- ▲ 3.95%
- F500 in state
- 110
Industry mix (Fortune 500 HQ in TX)
| Industry | F500 HQs | Revenue |
|---|---|---|
| Energy | 16 | $1,198B |
|
||
| Technology | 5 | $198B |
|
||
| Engineering / Construction | 4 | $72B |
|
||
| Energy Services | 3 | $60B |
|
||
| Utilities | 3 | $41B |
|
||
| Healthcare | 2 | $330B |
|
||
Price history
-6.9% since first listed3 events — show timeline
- 2026-05-01 Listed $199,999 BCSRMLS
- 2022-09-27 Listed $214,900 BCSRMLS
- 2007-07-02 Sold (Public Records) — Public Records
Property tax history
+21.2%/yrLatest (2025): $1,528 · -23.8% YoY. Source: county tax records.
Cash-flow waterfall
monthlySold comps — $/sqft
last 12 mo · ≤1 miLoading sold comps…