115 Lillian St · Conroe, TX
Flood risk No data
- FEMA flood zone
- —
- Chance of flooding over 30 yrs
- —
- Est. flood insurance / yr
- —
Fire risk No data
- Est. fire insurance / yr
- —
Heat risk No data
- Hot days now (above threshold)
- —
- Hot days in 30 yrs
- —
Wind risk No data
- Chance of severe wind over 30 yrs
- —
Air-quality risk No data
- Unhealthy air days now
- —
- Unhealthy air days in 30 yrs
- —
Risk factors via First Street. Map © Google.
Why this score? — see what drove the B grade
The composite is a weighted blend of 9 inputs, each scored 0–100. Each bar is that input's sub-score; the figure is the points it added to the 100-point composite (weight × sub-score).
- Cash flow +30.0/30.0
- 1% rule +10.0/10.0
- DSCR +10.0/10.0
- ARV discount +7.5/15.0
- Schools +5.1/10.0
- Livability +3.7/5.0
- Rent growth +2.9/5.0
- Condition / age +2.5/5.0
- Appreciation +0.0/10.0
$80,900
🖨 Deal sheet (PDF) 📄 Offer letter ✓ Due diligence
Key facts
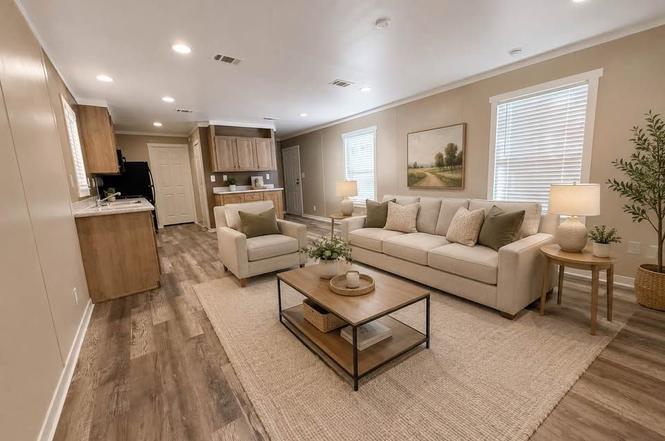
- Large windows
- Easy access
- Open floorplan
Tags
Property features AI
Finance
- Financial info: List price $80,900
Exterior
- Home design: Single-section manufactured home (3 Bed 2 Bath Single Section)
- Construction: Living area about 1,120; Spec new construction
Interior
- Bedrooms: 3 bedrooms
- Bathrooms: 2 bathrooms
- Interior features: Dishwasher; Disposal; Refrigerator
Neighborhood map
What this means for you Summary
Snapshot
- This is a 3-bed/2.0-bath manufactured listed at $81k.
Deal economics
- At list price, monthly cash flow is $627 ($8k/yr) — positive.
- The deal already cash-flows at list — no discount required.
- Meets the 1% rule at list price ($2k rent vs $81k).
- Recommended offer: $74k (9.0% below list) — sets the bar for market timing.
- Cap rate 15.6% vs local median 3.1% in Conroe — top-decile yield for the area; either an underpriced asset or a hidden risk that comps aren't pricing in. Stress-test before assuming the spread holds.
Location & tenants
- Location reads 74/100 on livability (#169 in TX, #4,447 nationally) — a middle-class / working-renter tenant base. Strengths: cost of living A+, housing A+, amenities B; Watch: schools D+, commute F, health & safety F.
- Conroe ISD (other): math 57% / reading 57% proficiency, ranked #69 of 826 in TX (top 8%) — acceptable for families but not a draw, mixed tenant base, ~2y average lease.
- Market conditions: Rents rising (+1.4%/yr); 486 active listings in the ZIP; 40 comparable units currently listed for rent nearby; rentals leasing fast (median 11d on market — plan ~1-2 weeks tenant-placement turnaround); 13,259 units permitted in Montgomery County in 2024 (1,402 in 5+ unit buildings).
Forward outlook
- Local home prices are declining (-3.0%/yr); year-one equity from $559 of loan paydown is wiped out by about $2k of value loss. Plan a longer hold.
- Montgomery County population projected at +65% by 2050 — long-run rental-demand tailwind backs the buy-and-hold thesis.
- At projected returns (-3.0% appreciation + 1.4% rent growth), your $23k cash investment doubles in ~4 years — after that, you're playing with house money.
Negotiation context
- It's been on market 94 days — a 9% lower offer ($74k) is reasonable based on typical stale-listing flexibility.
Questions for the listing agent
- It's been on market 94 days. Have you received any prior offers? Is the seller open to a 9% concession, seller financing, or rate buy-down credit?
- Why hasn't it sold? Are there any deal-killer items the seller is aware of (foundation, flood, title, zoning, code violations)?
- Is there a deadline driving the sale (1031 exchange, divorce, estate, relocation)? That informs how much negotiation room exists.
- Schools are D-rated, which usually means shorter tenancies and higher turnover. Who's the typical renter profile here, and what's been the actual vacancy rate?
- What's the average days-on-market for RENTAL listings here right now (not sales)? A rising rental-DOM trend means longer vacancies and softer asking-rent achievability than the comps imply.
- What's the recent tenant-quality profile in this submarket — average credit score on applications, eviction rate, late-payment / NSF rate, and stable-employment percentage? A property-management company in the area should have these aggregated.
- How much new for-sale + rental construction is in the pipeline within 1–3 miles? Heavy new supply typically softens prices + rents 12–24 months out; constrained supply supports both.
Investment metrics
- 1% rule
- 1.86% ✓
- Cap rate
- 15.59%
- Cash-on-cash
- 33.19%
- DSCR
- 2.48
- GRM
- 4.5
CMA / ARV
No comps found within radius.
Projected returns pro-forma
-3.0% appreciation · 1.43% rent growth · sell at horizon
- IRR
- 26.6%
- Equity multiple
- 2.08×
- Total profit
- $24,485
- Equity at exit
- $12,062
- IRR
- 33.3%
- Equity multiple
- 3.80×
- Total profit
- $63,517
- Equity at exit
- $6,995
Cash invested: $22,652 (down + closing). Projections, not guarantees.
Landlord ↔ Tenant lean methodology
- Overall (STATE)
- 87 Strongly Landlord-Friendly
- State Texas
- 87 Strongly Landlord-Friendly · R+5
- County
- — inherits STATE
- City
- — inherits STATE
ZIP-level market 77301
- Home prices YoY
- -8.4%
- Rents YoY
- 1.4%
- Active inventory
- 486
- Price-to-rent
- 4.5×
Monthly cashflow live
- Estimated rent
- $1,501 high interval (Pro) →
- Mortgage (P&I)
- −$424
- Tax est. 1.5%
- −$101 /mo · $1,214/yr
- Insurance
- −$34
- HOA
- −$0
- Vacancy / Maint / Mgmt
- −$315
- Net cashflow
- $627
Break-even live
Sensitivity live
| Price | -10% $682 | -5% $655 | +0% $627 | +5% $599 | +10% $571 |
|---|---|---|---|---|---|
| Rent | -10% $508 | -5% $567 | +0% $627 | +5% $686 | +10% $745 |
| Rate | -1.0pp $667 | -0.5pp $647 | base $627 | +0.5pp $606 | +1.0pp $584 |
UW: 25.0% down · 7.5% · 30yr · 1.5% tax · 5.0% vac · 8.0% maint · 8.0% mgmt
Financing live
Cash to close
- Down payment
- $20,225
- Closing costs
- $2,427
- Reserves months
- —
- Total cash needed
- —
Loan-product check · same deal, 3 products live
Conventional
25% down · 7.5% · 30yr
- Down + closing
- —
- Monthly P&I
- —
- Monthly cashflow
- —
- DSCR
- —
- Eligible?
- —
Personal DTI + credit; lowest rate.
DSCR
20% down · 8.5% · 30yr
- Down + closing
- —
- Monthly P&I
- —
- Monthly cashflow
- —
- DSCR
- —
- Eligible?
- —
No personal income docs; deal must DSCR.
Hard money
10% down · 12.0% · 12mo
- Down + closing
- —
- Monthly P&I
- —
- Monthly cashflow
- —
- DSCR
- —
- Eligible?
- —
Short-term bridge; refi at stabilization.
Rent comps 40 comps
| Address | Beds | Baths | Sqft | Rent | $/sqft | DOM | Units | Dist |
|---|---|---|---|---|---|---|---|---|
| 115 Lillian St Unit LL115 Conroe, TX | 3.0 | 2.0 | 1120 | $1,399 | $1.25 | 6d | 1 | 0.04mi |
| 113 Betty St Unit BE113 Conroe, TX | 3.0 | 2.0 | 1216 | $1,399 | $1.15 | 21d | 1 | 0.47mi |
| 204 Peggy St Unit PG204 Conroe, TX | 3.0 | 2.0 | 1216 | $1,399 | $1.15 | 21d | 1 | 0.60mi |
| 1619 N Frazier St Conroe, TX | 2.0 | 2.0 | 980 | $1,309 | $1.34 | 44d | 1 | 0.64mi |
| 1619 N Frazier St Conroe, TX | 1.0–2.0 | 1.0–2.0 | 824 | $1,895 | $2.30 | 8d | 10 | 0.64mi |
| 511 N 3rd St Conroe, TX | 3.0 | 1.0 | 1100 | $1,695 | $1.54 | 4d | 1 | 0.67mi |
| 901 Wilson Rd Unit 3047 Conroe, TX | 3.0 | 2.0 | 1295 | $1,524 | $1.18 | 11d | 1 | 0.70mi |
| 901 Wilson Rd Unit 2047 Conroe, TX | 2.0 | 2.0 | 917 | $1,103 | $1.20 | 12d | 1 | 0.70mi |
| 605 Kathy St Unit KA605 Conroe, TX | 3.0 | 2.0 | 1216 | $1,399 | $1.15 | 14d | 1 | 0.71mi |
| 901 Wilson Rd Unit 958 Conroe, TX | 2.0 | 2.0 | 917 | $1,143 | $1.25 | 11d | 1 | 0.72mi |
| 901 Wilson Rd Unit 2162 Conroe, TX | 2.0 | 2.0 | 917 | $1,119 | $1.22 | 8d | 1 | 0.72mi |
| 901 Wilson Rd Unit 3228 Conroe, TX | 3.0 | 2.0 | 1295 | $1,481 | $1.14 | 3d | 1 | 0.72mi |
| 901 Wilson Rd Unit 2228 Conroe, TX | 2.0 | 2.0 | 917 | $1,111 | $1.21 | 3d | 1 | 0.72mi |
| 901 Wilson Rd Unit 934 Conroe, TX | 3.0 | 2.0 | 1295 | $1,513 | $1.17 | 11d | 1 | 0.72mi |
| 907 Wilson Rd Conroe, TX | 3.0 | 2.0 | 1295 | $1,760 | $1.36 | 44d | 1 | 0.75mi |
| 707 N Frazier St Conroe, TX | 2.0 | 2.0 | 1159 | $1,245 | $1.07 | 44d | 1 | 0.77mi |
| 1101 Wilson Rd Conroe, TX | 1.0–2.0 | 1.0 | 720 | $1,190 | $1.65 | 16d | 13 | 0.87mi |
| 900 Holly Dr Conroe, TX | 2.0 | 1.0 | 850 | $1,095 | $1.29 | 14d | 3 | 1.07mi |
| 900 Holly Dr Unit 16 Conroe, TX | 2.0 | 1.0 | 850 | $1,095 | $1.29 | 44d | 1 | 1.07mi |
| 241 Interstate 45 S Conroe, TX | 2.0 | 2.0 | 979 | $1,250 | $1.28 | 44d | 1 | 1.21mi |
| 2020 Plantation Dr Conroe, TX | 1.0–2.0 | 1.0–2.0 | 779 | $1,180 | $1.51 | 2d | 18 | 1.24mi |
| 601 Booker T Washington St Conroe, TX | 2.0 | 1.0 | 864 | $1,100 | $1.27 | 44d | 1 | 1.26mi |
| 601 Booker T Washington St Conroe, TX | 2.0 | 1.0 | 864 | $1,089 | $1.26 | 6d | 1 | 1.26mi |
| 2219 N Frazier St Conroe, TX | 2.0 | 2.0 | 1023 | $1,100 | $1.08 | 44d | 1 | 1.28mi |
| 2301 N Frazier St Conroe, TX | 2.0 | 2.0 | 1042 | $1,250 | $1.20 | 44d | 1 | 1.29mi |
| 1900 Westview Blvd Conroe, TX | 2.0 | 2.0 | 1016 | $1,320 | $1.30 | 8d | 1 | 1.37mi |
| 1900 Westview Blvd Unit 1957 Conroe, TX | 2.0 | 2.0 | 1016 | $1,247 | $1.23 | 14d | 1 | 1.40mi |
| 1900 Westview Blvd Unit 1933 Conroe, TX | 3.0 | 2.0 | 1182 | $1,814 | $1.53 | 11d | 1 | 1.40mi |
| 1900 Westview Blvd Unit 420 Conroe, TX | 2.0 | 2.0 | 1016 | $1,065 | $1.05 | 11d | 1 | 1.40mi |
| 1900 Westview Blvd Unit 3047 Conroe, TX | 3.0 | 2.0 | 1182 | $1,825 | $1.54 | 11d | 1 | 1.40mi |
| 1900 Westview Blvd Unit 2047 Conroe, TX | 2.0 | 2.0 | 1016 | $1,076 | $1.06 | 11d | 1 | 1.40mi |
| 1900 Westview Blvd Unit 3228 Conroe, TX | 3.0 | 2.0 | 1182 | $1,782 | $1.51 | 3d | 1 | 1.41mi |
| 1900 Westview Blvd Unit 2228 Conroe, TX | 2.0 | 2.0 | 1016 | $1,033 | $1.02 | 3d | 1 | 1.41mi |
| 1900 Westview Blvd Unit 2162 Conroe, TX | 2.0 | 2.0 | 1016 | $1,041 | $1.02 | 8d | 1 | 1.41mi |
| 1206 North Loop 336 W Conroe, TX | 2.0 | 1.0 | 788 | $1,188 | $1.51 | 44d | 1 | 1.43mi |
| 231 Interstate 45 N Unit 288 Conroe, TX | 2.0 | 2.0 | 880 | $1,127 | $1.28 | 3d | 1 | 1.44mi |
| 1200 North Loop 336 W Unit 2162 Conroe, TX | 2.0 | 2.0 | 788 | $1,039 | $1.32 | 8d | 1 | 1.46mi |
| 1200 North Loop 336 W Unit 426 Conroe, TX | 2.0 | 2.0 | 788 | $1,063 | $1.35 | 11d | 1 | 1.46mi |
| 1200 North Loop 336 W Unit 1233 Conroe, TX | 3.0 | 2.0 | 1100 | $1,353 | $1.23 | 11d | 1 | 1.46mi |
| 1200 North Loop 336 W Unit 3228 Conroe, TX | 3.0 | 2.0 | 1100 | $1,321 | $1.20 | 3d | 1 | 1.46mi |
Listing history 4 events
-
2026-06-18days on market $80,900 Active 94 DOM
-
2026-06-17days on market $80,900 Active 93 DOM
-
2026-06-16days on market $80,900 Active 92 DOM
-
2026-06-15$80,900 Active 91 DOM
ⓘ Source: listings_history table (triggers on properties + properties_extension) + one-shot
backfill from property_details.listing_events for pre-trigger history.
Nearby sold comps map
Loading sold comps map…
Walkable amenities ~0.75 mi
Loading nearby amenities…
Taxation est. · year 1
- Rental income
- $18,010
- − Mortgage interest
- −$4,532
- − Property taxes
- −$1,214
- − Insurance
- −$404
- − Repairs & maintenance
- −$1,441
- − Management
- −$1,441
- − Depreciation
- −$2,353
- Taxable income
- $6,625
- Est. tax owed @ 24.0%
- −$1,590
- After-tax cash flow
- $5,929/yr
For passive investors: Depreciation is non-cash, so a rental often shows a tax loss while cash-flowing — sheltering income. Rental losses are passive: they offset passive income freely, and up to $25,000/yr can offset ordinary (W-2) income if you actively participate and your MAGI is under $100k (phasing out to $0 by $150k); unused losses carry forward. On sale, claimed depreciation is recaptured at up to 25%, and gains may owe capital-gains tax (a 1031 exchange can defer both). Figures are a year-1 estimate at your 24.0% rate — not tax advice; consult a CPA.
Schools (NCES district)
- District
- Conroe ISD
- NCES district ID
- 4815000
- Math proficiency
- 57% ▼ -6.00%
- Reading proficiency
- 57% ▼ -1.00%
- Median HH income
- $71,541
- Composite
- 50.65/100
- National rank
- #1833
- State rank
- #69 of 826 in TX
Livability — Conroe
- Score
- 74/100
- State rank
- #169
- US rank
- #4447
Category grades
Schools grade is shown separately in the Schools card above.
Census & demographics
- Census place
- Conroe, TX
- County
- Montgomery County · 663,713 people
- City population
- 205,417
- Metro
- Houston-The Woodlands-Sugar Land, TX
- Population (ZIP)
- 37,769
- Household income
- $66,475
- Rent vs Own
- Severe rent burden
- 1256.0
Population outlook (Montgomery County) Hauer SSP2
- Today (2025)
- 713,896 people
- By 2030
- 805,263 · +12.8%
- By 2040
- 992,708 · +39.1%
- By 2050
- 1,179,590 · +65.2%
- By 2075
- 1,628,084 · +128.1%
- By 2100
- 1,937,880 · +171.5%
Race, ethnicity, and origin ACS 2023
- Neighborhood character
- Diverse neighborhood (Simpson 0.62)
- Race & ethnicity
- Hispanic / Latino 52% White 31% Two or more races 19% Black 13% Asian 2% Native American 2%
- Hispanic origin (detail)
- Mexican 37%
- Common ancestry
- Lithuanian 2% Slovak 1% Romanian 1%
- Foreign-born
- 27% · Canada, Jamaica
- Languages at home
- 51% English-only · Spanish 45% Other Asian/Pacific 2%
Political lean MEDSL · Montgomery
- 2024 margin
- Solid R (+45.5) · D 26.8% · R 72.3%
- 2008→2024 swing
- +7.2pp toward D · 2008: -52.7pp · 2024: -45.5pp
- All cycles
- 2024: R+45.5 2020: R+43.8 2016: R+51.4 2012: R+60.7 2008: R+52.7
Not yet ingested
- Civics
- —
Market trends
- HPI YoY
- ▼ -25.51%
- Current HPI
- 278.6662
- Rent YoY
- ▲ 1.43%
- Metro
- Houston-The Woodlands-Sugar Land, TX
- State GDP YoY
- ▲ 3.95%
- F500 in state
- 110
Industry mix (Fortune 500 HQ in TX)
| Industry | F500 HQs | Revenue |
|---|---|---|
| Energy | 16 | $1,198B |
|
||
| Technology | 5 | $198B |
|
||
| Engineering / Construction | 4 | $72B |
|
||
| Energy Services | 3 | $60B |
|
||
| Utilities | 3 | $41B |
|
||
| Healthcare | 2 | $330B |
|
||
Cash-flow waterfall
monthlySold comps — $/sqft
last 12 mo · ≤1 miLoading sold comps…