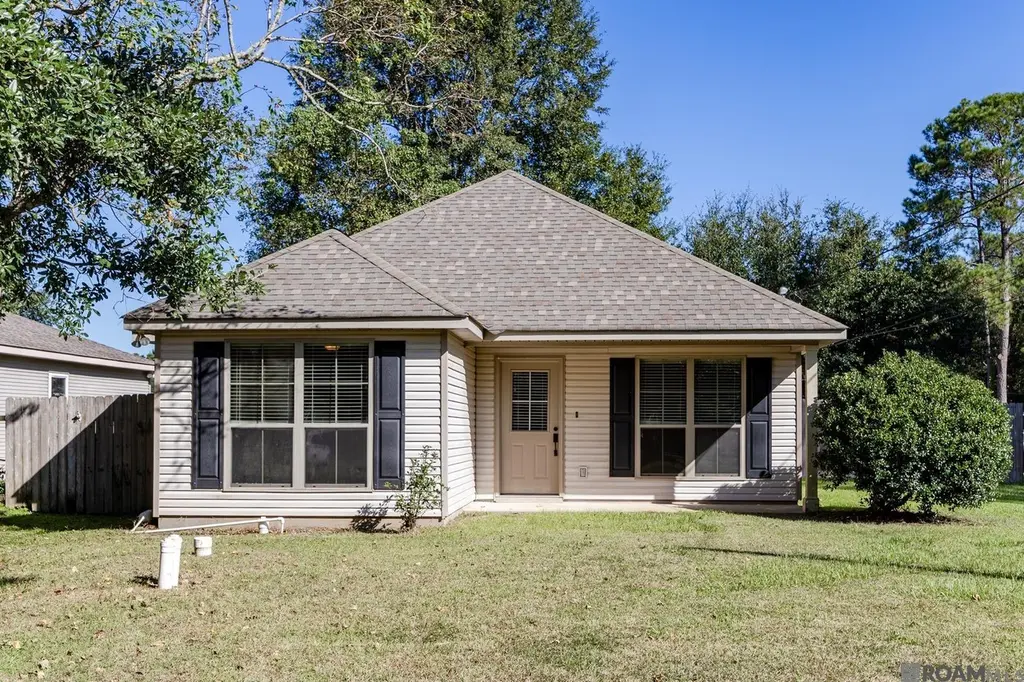
133 Scott St · Madisonville, LA
Flood risk 1/10 · Minimal
- FEMA flood zone
- X
- Chance of flooding over 30 yrs
- 0.0%
- Est. flood insurance / yr
- $507 – $1,088
Fire risk 4/10 · Minor
- Est. fire insurance / yr
- $1,269 – $2,357
Heat risk 9/10 · Severe
- Hot days now (above 109°F)
- 7 days/yr
- Hot days in 30 yrs
- 21 days/yr
Wind risk 9/10 · Severe
- Chance of severe wind over 30 yrs
- 99.0%
Air-quality risk 2/10 · Minimal
- Unhealthy air days now
- 0 days/yr
- Unhealthy air days in 30 yrs
- 1 days/yr
Risk factors via First Street. Map © Google.
Why this score? — see what drove the C- grade
The composite is a weighted blend of 9 inputs, each scored 0–100. Each bar is that input's sub-score; the figure is the points it added to the 100-point composite (weight × sub-score).
- Cash flow +19.8/30.0
- ARV discount +9.0/15.0
- DSCR +6.3/10.0
- Schools +4.3/10.0
- 1% rule +4.2/10.0
- Livability +4.0/5.0
- Rent growth +2.5/5.0
- Condition / age +2.5/5.0
- Appreciation +0.0/10.0
$225,000
🖨 Deal sheet (PDF) 📄 Offer letter ✓ Due diligence
Listing remarks MLS
Welcome Home to 133 Scott St, Madisonville, LA! This charming 3-bedroom, 2-bathroom home sits on an oversized corner lot in the heart of Madisonville, offering plenty of space both inside and out. With no carpet throughout, the home features easy-to-maintain tile flooring in every room, keeping things cool and clean year-round. The kitchen is a true standout, boasting rich cherry wood cabinetry, granite countertops, a peninsula breakfast bar, pendant lighting, and stainless appliances. The generous bedrooms offer comfortable retreats, each with ceiling fans and ample closet space, while the bathrooms are well-appointed with granite vanities and classic finishes. Step outside and enjoy the massive corner lot with a large covered back patio -- complete with a ceiling fan -- ideal for relaxing Louisiana evenings. The fully fenced backyard provides privacy and plenty of room to roam, while a storage shed and covered carport add even more functionality. The sprawling front yard is framed by mature trees, and the home's charming curb appeal makes a wonderful first impression from every angle. Don't miss your chance to own this move-in ready gem in one of Louisiana's most charming small towns and just minutes from the I-12 corridor!
Key facts
- Oversized corner lot
- Tile flooring
- Covered back patio
Tags
Property features AI
Exterior
- Parking: Attached covered carport
- Utilities: Well water; Septic sewer
- Home design: Single-story; Vinyl siding; Slab foundation; Very good condition; Corner lot; City lot; Oversized lot; Lot dimensions approximately 50 x 120
- Construction: Shingle roof; Vinyl siding construction; Built on slab foundation
- Exterior features: Fenced yard; Covered patio/porch; Shed(s); Workshop
Interior
- Kitchen: Dishwasher; Oven; Range
- Bathrooms: 2 full bathrooms
- Heating & cooling: Central heating; Central air conditioning
- Interior features: Tray ceilings; Ceiling fans; Granite counters
- Laundry & utility: Washer hookup; Dryer hookup
Neighborhood map
What this means for you Summary
Snapshot
- This is a 3-bed/2.0-bath single-family listed at $225k.
Deal economics
- At list price, monthly cash flow is $268 ($3k/yr) — positive.
- The deal already cash-flows at list — no discount required.
- To meet the 1% rule (rent ≥ 1% of price), the offer needs to be $207k (7.9% below list).
- Recommended offer: $207k (7.9% below list) — sets the bar for 1% rule.
- Cap rate 7.7% vs local median 4.6% in Madisonville — top-decile yield for the area; either an underpriced asset or a hidden risk that comps aren't pricing in. Stress-test before assuming the spread holds.
Location & tenants
- Location reads 79/100 on livability (#5 in LA, #2,302 nationally) — a middle-class / working-renter tenant base. Strengths: schools A+, crime A+, employment A+; Watch: amenities F, commute F.
- St. Tammany Parish (suburban): math 43% / reading 55% proficiency, ranked #11 of 98 in LA (top 11%) — families likely to look elsewhere, expect single-tenant / working-renter base with shorter leases.
- Market conditions: 252 active listings in the ZIP; 5 comparable units currently listed for rent nearby; rentals at typical pace (median 25d on market — plan ~3-4 weeks tenant-placement turnaround); high-income renter base; 1,064 units permitted in St. Tammany Parish in 2024 (0 in 5+ unit buildings).
Forward outlook
- Local home prices are declining (-3.0%/yr); year-one equity from $2k of loan paydown is wiped out by about $7k of value loss. Plan a longer hold.
- St. Tammany County population projected at +27% by 2050 — long-run rental-demand tailwind backs the buy-and-hold thesis.
Negotiation context
- It's been on market 15 days — a 2% lower offer ($222k) is reasonable based on typical stale-listing flexibility.
- 18 sale attempts since 14y ago with the ask held roughly flat each time — persistent listings suggest the price (not the market) is what's stuck; bring a comps-based counter.
- Current owner paid $168k; 34% above their basis — modest negotiation headroom, anchor on the comps not their cost.
Risks & watch-outs
- Climate carrying-cost: severe wind risk, 99% chance of damaging wind over 30y; extreme-heat days projected 7→21/yr by 2055 (HVAC capex compounding) — expect insurance premiums to compound above CPI over the hold.
Questions for the listing agent
- Is there a deadline driving the sale (1031 exchange, divorce, estate, relocation)? That informs how much negotiation room exists.
- Schools are A-rated — typically a magnet for longer-tenancy family renters. What's the average tenant stay here, and is there a school-zone premium baked into asking?
- What's the average days-on-market for RENTAL listings here right now (not sales)? A rising rental-DOM trend means longer vacancies and softer asking-rent achievability than the comps imply.
- What's the recent tenant-quality profile in this submarket — average credit score on applications, eviction rate, late-payment / NSF rate, and stable-employment percentage? A property-management company in the area should have these aggregated.
- How much new for-sale + rental construction is in the pipeline within 1–3 miles? Heavy new supply typically softens prices + rents 12–24 months out; constrained supply supports both.
Investment metrics
- 1% rule
- 0.92% ✗
- Cap rate
- 7.72%
- Cash-on-cash
- 5.11%
- DSCR
- 1.23
- GRM
- 9.0
CMA / ARV
- ARV (median comp)
- $232,908
- List price
- $225,000
- Delta
- -3.40%
- Verdict
- FAIR
- Comps
- 20 within 1.0 mi
Show comp detail 12 sales within ~0.75 mi
| Address | Dist | Beds/Ba | Sqft | Sold | Price | $/sf | Match |
|---|---|---|---|---|---|---|---|
| 132 Scott St | 0.03mi | 3/2.0 | 1,224 (0%) | 13mo | $227,000 | $185 | 88 |
| 103 Bryant St | 0.17mi | 3/2.0 | 1,305 (+7%) | 3mo | $249,900 | $191 | 78 |
| 113 Bryant St | 0.17mi | 3/2.0 | 1,320 (+8%) | 1mo | $249,900 | $189 | 78 |
| 140 Poe St | 0.15mi | 3/2.0 | 1,237 (+1%) | 23mo | $244,000 | $197 | 72 |
| 101 Madison Ave | 0.26mi | 3/2.0 | 1,256 (+3%) | 14mo | $205,300 | $163 | 71 |
| 111 Bryant St | 0.17mi | 3/2.0 | 1,325 (+8%) | 10mo | $239,000 | $180 | 70 |
| 108 Mardi St | 0.35mi | 3/2.0 | 1,184 (-3%) | 11mo | $175,000 | $148 | 69 |
| 115 Bryant St | 0.17mi | 3/2.0 | 1,320 (+8%) | 15mo | $234,500 | $178 | 66 |
| 117 Bryant St | 0.16mi | 3/2.0 | 1,320 (+8%) | 16mo | $234,900 | $178 | 66 |
| 124 Davis St | 0.30mi | 3/2.0 | 1,336 (+9%) | 8mo | $225,000 | $168 | 64 |
| 122 Madison Ave | 0.25mi | 3/2.0 | 1,339 (+9%) | 11mo | $236,000 | $176 | 64 |
| 344 Brewster Rd | 0.46mi | 3/2.0 | 1,323 (+8%) | 21mo | $232,000 | $175 | 48 |
Match score weights: distance 35% · size 25% · config 20% · recency 20%. Top-matched comps best support the ARV.
Projected returns pro-forma
-3.0% appreciation · 3.0% rent growth · sell at horizon
- IRR
- -8.4%
- Equity multiple
- 0.69×
- Total profit
- $-19,454
- Equity at exit
- $33,548
- IRR
- 1.1%
- Equity multiple
- 1.08×
- Total profit
- $4,728
- Equity at exit
- $19,454
Cash invested: $63,000 (down + closing). Projections, not guarantees.
Landlord ↔ Tenant lean methodology
- Overall (STATE)
- 90 Strongly Landlord-Friendly
- State Louisiana
- 90 Strongly Landlord-Friendly · R+12
- County
- — inherits STATE
- City
- — inherits STATE
ZIP-level market 70447
- Home prices YoY
- -28.1%
- Active inventory
- 252
- Price-to-rent
- 9.0×
Monthly cashflow live
- Estimated rent
- $2,073 high interval (Pro) →
- Mortgage (P&I)
- −$1,180
- Tax from tax record
- −$96 /mo · $1,148/yr
- Insurance
- −$94
- HOA
- −$0
- Vacancy / Maint / Mgmt
- −$435
- Net cashflow
- $268
Break-even live
Sensitivity live
| Price | -10% $396 | -5% $332 | +0% $268 | +5% $205 | +10% $141 |
|---|---|---|---|---|---|
| Rent | -10% $105 | -5% $186 | +0% $268 | +5% $350 | +10% $432 |
| Rate | -1.0pp $382 | -0.5pp $326 | base $268 | +0.5pp $210 | +1.0pp $151 |
UW: 25.0% down · 7.5% · 30yr · 1.5% tax · 5.0% vac · 8.0% maint · 8.0% mgmt
Financing live
Cash to close
- Down payment
- $56,250
- Closing costs
- $6,750
- Reserves months
- —
- Total cash needed
- —
Loan-product check · same deal, 3 products live
Conventional
25% down · 7.5% · 30yr
- Down + closing
- —
- Monthly P&I
- —
- Monthly cashflow
- —
- DSCR
- —
- Eligible?
- —
Personal DTI + credit; lowest rate.
DSCR
20% down · 8.5% · 30yr
- Down + closing
- —
- Monthly P&I
- —
- Monthly cashflow
- —
- DSCR
- —
- Eligible?
- —
No personal income docs; deal must DSCR.
Hard money
10% down · 12.0% · 12mo
- Down + closing
- —
- Monthly P&I
- —
- Monthly cashflow
- —
- DSCR
- —
- Eligible?
- —
Short-term bridge; refi at stabilization.
Rent comps 5 comps
| Address | Beds | Baths | Sqft | Rent | $/sqft | DOM | Units | Dist |
|---|---|---|---|---|---|---|---|---|
| 126 Scott St Madisonville, LA | 3.0 | 2.0 | 1264 | $1,750 | $1.38 | 21d | 1 | 0.06mi |
| 138 Poe St Madisonville, LA | 3.0 | 2.0 | 1109 | $1,700 | $1.53 | 24d | 1 | 0.16mi |
| 118 Poe St Madisonville, LA | 3.0 | 2.0 | 1287 | $1,650 | $1.28 | 24d | 1 | 0.19mi |
| 71736 Spike Dr Madisonville, LA | 3.0 | 2.0 | 1067 | $1,550 | $1.45 | 24d | 1 | 1.40mi |
| 71772 Spike Dr Madisonville, LA | 3.0 | 2.0 | 1001 | $1,800 | $1.80 | 4d | 1 | 1.45mi |
Listing history 42 events
-
2026-06-18days on market $225,000 Active 15 DOM
-
2026-06-17days on market $225,000 Active 14 DOM
-
2026-06-16days on market $225,000 Active 13 DOM
-
2026-06-15days on market $225,000 Active 12 DOM
-
2026-06-13days on market $225,000 Active 10 DOM
-
2026-06-10days on market $225,000 Active 7 DOM
-
2026-06-09days on market $225,000 Active 6 DOM
-
2026-06-08days on market $225,000 Active 5 DOM
-
2026-06-07remarks 699-char remark
-
2026-06-07days on market $225,000 Active 4 DOM
-
2026-05-31days on market $225,000 Active 60 DOM
-
2026-04-01status Active
-
2026-04-01$225,000 Active 378-char remark
-
2026-04-01$225,000 Active
-
2026-03-31status Active
-
2026-03-31status Active
-
2026-03-31price $225,000
-
2026-03-30price $225,000
-
2025-10-09$235,000 Active
-
2025-10-09$235,000 Active
-
2024-08-22historical $1,700
-
2024-08-14$1,700
-
2021-01-12soldstatus $167,500
-
2021-01-08soldstatus $167,500 Closed
-
2020-11-24status Pending
-
2020-11-23status Active
-
2020-11-21status Pending
-
2020-11-17$160,000
-
2020-11-17$160,000 Active
-
2018-07-20soldstatus $150,000 Sold
-
2018-07-20soldstatus $150,000
-
2018-06-27historical Pending Continue to Show
-
2018-06-10price $150,000
-
2018-06-10status Active
-
2018-05-22historical Pending Continue to Show
-
2018-05-12price $154,000
-
2018-04-28$159,000 Active
-
2018-04-28$150,000
-
2013-03-22soldstatus $127,500
-
2012-07-20$130,000
-
2012-07-20$130,000
-
2006-09-28soldstatus $20,500
ⓘ Source: listings_history table (triggers on properties + properties_extension) + one-shot
backfill from property_details.listing_events for pre-trigger history.
Tax reassessment forecast LA · Resets to sale price
- Current annual tax
- $1,148 · $96/mo
- Projected year-2 tax
- $1,238 · $103/mo
- Expected delta
- +$90/yr (+$7/mo · 7.8%)
ⓘ Screening estimate from a state-policy table — verify with the county assessor before closing.
Climate risk First Street
- Flood 1/10 Low FEMA zone X · 0% chance over 30 yrs
- Wildfire 4/10 Moderate
- Heat 9/10 Extreme 7 d/yr ≥109°F today · 21 d/yr by 30 yrs out
- Wind 9/10 Extreme 99% chance of damaging wind over 30 yrs
- Air quality 2/10 Low 0 unhealthy d/yr today · 1 by 30 yrs out
Nearby sold comps map
Loading sold comps map…
Walkable amenities ~0.75 mi
Loading nearby amenities…
Taxation est. · year 1
- Rental income
- $24,875
- − Mortgage interest
- −$12,603
- − Property taxes
- −$1,148
- − Insurance
- −$1,125
- − Repairs & maintenance
- −$1,990
- − Management
- −$1,990
- − Depreciation
- −$6,545
- Taxable loss
- −$526
- Est. tax savings @ 24.0%
- +$126
- After-tax cash flow
- $3,346/yr
For passive investors: Depreciation is non-cash, so a rental often shows a tax loss while cash-flowing — sheltering income. Rental losses are passive: they offset passive income freely, and up to $25,000/yr can offset ordinary (W-2) income if you actively participate and your MAGI is under $100k (phasing out to $0 by $150k); unused losses carry forward. On sale, claimed depreciation is recaptured at up to 25%, and gains may owe capital-gains tax (a 1031 exchange can defer both). Figures are a year-1 estimate at your 24.0% rate — not tax advice; consult a CPA.
Schools (NCES district)
- District
- St. Tammany Parish
- NCES district ID
- 2201650
- Math proficiency
- 43% ▼ -32.00%
- Reading proficiency
- 55% ▼ -26.00%
- Median HH income
- $61,752
- Composite
- 43.04/100
- National rank
- #3098
- State rank
- #11 of 98 in LA
Livability — Madisonville
- Score
- 79/100
- State rank
- #5
- US rank
- #2302
Category grades
Schools grade is shown separately in the Schools card above.
Census & demographics
- County
- Saint Tammany Parish · 228,296 people
- City population
- 17,897
- Metro
- New Orleans-Metairie, LA
- Population (ZIP)
- 17,897
- Household income
- $122,574
- Rent vs Own
- Severe rent burden
- 47.0
Population outlook (St. Tammany County) Hauer SSP2
- Today (2025)
- 286,725 people
- By 2030
- 304,175 · +6.1%
- By 2040
- 336,203 · +17.3%
- By 2050
- 364,590 · +27.2%
- By 2075
- 433,362 · +51.1%
- By 2100
- 470,333 · +64.0%
Race, ethnicity, and origin ACS 2023
- Neighborhood character
- Predominantly White (84%)
- Race & ethnicity
- White 84% Two or more races 7% Hispanic / Latino 6% Black 2%
- Hispanic origin (detail)
- Mexican 1%
- Common ancestry
- Lithuanian 19% Slovak 3% Romanian 2%
- Foreign-born
- 5% · Canada
- Languages at home
- 97% English-only · Spanish 1% Other Asian/Pacific 1% Russian/Polish/Slavic 1%
Political lean MEDSL · St. Tammany
- 2024 margin
- Solid R (+43.8) · D 27.3% · R 71.1% · Other 1.6%
- 2008→2024 swing
- +9.6pp toward D · 2008: -53.4pp · 2024: -43.8pp
- All cycles
- 2024: R+43.8 2020: R+44.2 2016: R+50.8 2012: R+52.2 2008: R+53.4
Not yet ingested
- Civics
- —
Market trends
- HPI YoY
- ▼ -68.07%
- Current HPI
- 174.0804
- Rent YoY
- —
- Metro
- New Orleans-Metairie, LA
- State GDP YoY
- ▲ 3.29%
- F500 in state
- 10
Industry mix (Fortune 500 HQ in LA)
| Industry | F500 HQs | Revenue |
|---|---|---|
| Telecommunications | 2 | $23B |
|
||
| Utilities | 1 | $12B |
|
||
| Wholesale / Distribution | 1 | $5B |
|
||
| Advertising | 1 | $2B |
|
||
Price history
+997.6% since first listed33 events — show timeline
- 2026-06-03 Listed $225,000 GSREIN
- 2026-06-03 Listed $225,000 AcadianaMLS
- 2026-04-01 Relisted — GBRMLS
- 2026-04-01 Listed $225,000 AcadianaMLS
- 2026-04-01 Listed $225,000 GBRMLS
- 2026-03-31 Relisted — AcadianaMLS
- 2026-03-31 Relisted — GBRMLS
- 2026-03-31 Price Changed $225,000 GBRMLS
- 2026-03-30 Price Changed $225,000 AcadianaMLS
- 2025-10-09 Listed $235,000 GBRMLS
- 2025-10-09 Listed $235,000 AcadianaMLS
- 2024-08-22 Rental Removed $1,700 GSREIN
- 2024-08-14 Listed for Rent $1,700 GSREIN
- 2021-01-12 Sold (Public Records) $167,500 Public Records
- 2021-01-08 Sold (MLS) $167,500 GSREIN
- 2020-11-24 Pending — GSREIN
- 2020-11-23 Relisted — GSREIN
- 2020-11-21 Pending — GSREIN
- 2020-11-17 Listed $160,000 AcadianaMLS
- 2020-11-17 Listed $160,000 GSREIN
- 2018-07-20 Sold (Public Records) $150,000 Public Records
- 2018-07-20 Sold (MLS) $150,000 GSREIN
- 2018-06-27 Contingent — GSREIN
- 2018-06-10 Price Changed $150,000 GSREIN
- 2018-06-10 Relisted — GSREIN
- 2018-05-22 Contingent — GSREIN
- 2018-05-12 Price Changed $154,000 GSREIN
- 2018-04-28 Listed $150,000 AcadianaMLS
- 2018-04-28 Listed $159,000 GSREIN
- 2013-03-22 Sold (MLS) $127,500 GSREIN
- 2012-07-20 Listed $130,000 AcadianaMLS
- 2012-07-20 Listed $130,000 GSREIN
- 2006-09-28 Sold (Public Records) $20,500 Public Records
Property tax history
-3.1%/yrLatest (2025): $1,148 · -2.4% YoY. Source: county tax records.
Cash-flow waterfall
monthlySold comps — $/sqft
last 12 mo · ≤1 miLoading sold comps…