 🏷️ Likely Rental
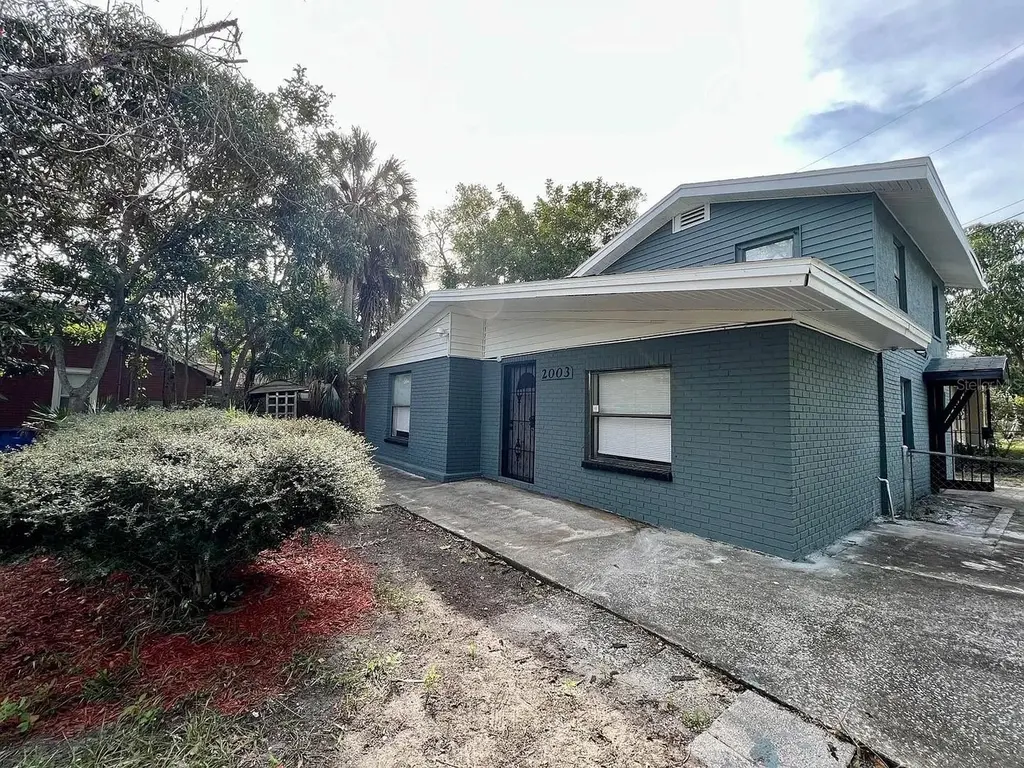
2003 10th St S · St. Petersburg, FL
Flood risk 1/10 · Minimal
- FEMA flood zone
- X (unshaded)
- Chance of flooding over 30 yrs
- 0.0%
- Est. flood insurance / yr
- $507 – $1,088
Fire risk 1/10 · Minimal
- Est. fire insurance / yr
- $947 – $1,759
Heat risk 10/10 · Severe
- Hot days now (above 106°F)
- 7 days/yr
- Hot days in 30 yrs
- 26 days/yr
Wind risk 10/10 · Severe
- Chance of severe wind over 30 yrs
- 99.0%
Air-quality risk 3/10 · Minor
- Unhealthy air days now
- 2 days/yr
- Unhealthy air days in 30 yrs
- 3 days/yr
Risk factors via First Street. Map © Google.
Why this score? — see what drove the C- grade
The composite is a weighted blend of 9 inputs, each scored 0–100. Each bar is that input's sub-score; the figure is the points it added to the 100-point composite (weight × sub-score).
- Cash flow +15.2/30.0
- ARV discount +15.0/15.0
- 1% rule +4.7/10.0
- DSCR +4.7/10.0
- Schools +4.3/10.0
- Rent growth +2.5/5.0
- Livability +2.5/5.0
- Condition / age +2.5/5.0
- Appreciation +0.0/10.0
$267,000
🖨 Deal sheet (PDF) 📄 Offer letter ✓ Due diligence
Listing remarks
Spacious 4 bed / 2 bath home in St. Pete's 33705 corridor — 1,620 sqft of family-sized living space, sitting adjacent to Old Southeast and Bartlett Park. St. Pete's no-state-income-tax appeal and year-round Gulf Coast climate continue to attract retirees and remote-work transplants from the Northeast. Vacant on close, with estimated market rent of $2,449/month based on local comps. List $275,000 / estimated ARV $365,000. Seller is willing to offer closing costs to buyer. Property status & photo disclosure: The property is currently vacant. The owner has been on-site completing minor paint and touch-up work. Seller can also work with buyer to ensure FHA loan compliance. Listin
Key facts
- 5,188 sq ft lot
- Built 1925
- Listed 37 days
Property features AI
Finance
- Other: Property classified as residential; Total living area approximately 1,620 sq ft
- HOA & community: No homeowners association
Exterior
- Utilities: Public water; Public utilities; Other sewer
- Home design: Single-family residence; One story; North-facing
- Construction: Block and frame construction; Shingle roof; Block foundation; Built on 0.12-acre lot
- Exterior features: Asphalt road access
Interior
- Bedrooms: 4 bedrooms
- Flooring: Laminate flooring
- Bathrooms: 2 full bathrooms
- Heating & cooling: Electric heating; Central air conditioning
- Interior features: Other interior features
- Laundry & utility: Washer hookup; Electric dryer hookup
Neighborhood map
What this means for you Summary
Snapshot
- This is a 4-bed/2.0-bath single-family listed at $267k.
Deal economics
- At list price, monthly cash flow is $94 ($1k/yr) — positive.
- The deal already cash-flows at list — no discount required.
- To meet the 1% rule (rent ≥ 1% of price), the offer needs to be $259k (3.1% below list).
- Recommended offer: $259k (3.1% below list) — sets the bar for 1% rule.
- Cap rate 6.7% vs local median 2.6% in St. Petersburg — top-decile yield for the area; either an underpriced asset or a hidden risk that comps aren't pricing in. Stress-test before assuming the spread holds.
Location & tenants
- Location reads: area grade C — affects rentability + tenant quality, not the cash-flow math above.
- Pinellas (suburban): math 51% / reading 51% proficiency, ranked #31 of 73 in FL (top 42%) — acceptable for families but not a draw, mixed tenant base, ~2y average lease.
- Zoned schools: Campbell Park Elementary School (math 19% / reading 19%, grade F, #2,111 of 2,144 statewide, top 99%, 462 students, 87% FRL); John Hopkins Middle School (math 25% / reading 27%, grade F, #506 of 571 statewide, top 89%, 723 students, 66% FRL); Gibbs High School (math 26% / reading 41%, grade F, #400 of 667 statewide, top 61%, 1,160 students, 64% FRL) — zoned schools average 73% FRL vs 48% district-wide (25 pts higher); higher-poverty schools than district average — tighter screening recommended.
- Zoned-school proficiency averages 26% at this address vs 51% district-wide (-25 pts) — the specific schools serving this property underperform the Pinellas average; the district grade overstates school quality for this exact location.
- Market conditions: Rents soft (-0.1%/yr); 308 active listings in the ZIP; 40 comparable units currently listed for rent nearby; rentals leasing fast (median 7d on market — plan ~1-2 weeks tenant-placement turnaround); 2,676 units permitted in Pinellas County in 2024 (1,422 in 5+ unit buildings).
Forward outlook
- Local home prices are declining (-3.0%/yr); year-one equity from $2k of loan paydown is wiped out by about $8k of value loss. Plan a longer hold.
- Pinellas County population projected at +14% by 2050 — modest demand growth; plan on rents tracking national, not racing it.
Negotiation context
- It's been on market 38 days — a 3% lower offer ($259k) is reasonable based on typical stale-listing flexibility.
- 3 sale attempts; this cycle's ask has dropped $33k (11%) from the opening price — seller is motivated, your offer sets the floor, not the list.
- Current owner paid $140k; list at $267k implies a 91% gain — meaningful room to come down on a strong offer.
Risks & watch-outs
- Watch-outs: built in 1925 — expect roof / HVAC / electrical / plumbing capex.
- Climate carrying-cost: severe wind risk, 99% chance of damaging wind over 30y; extreme-heat days projected 7→26/yr by 2055 (HVAC capex compounding) — expect insurance premiums to compound above CPI over the hold.
Questions for the listing agent
- It's been on market 38 days. Have you received any prior offers? Is the seller open to a 3% concession, seller financing, or rate buy-down credit?
- Built in 1925 — when were the roof, HVAC, electrical panel, plumbing, and water heater last replaced?
- Is there a deadline driving the sale (1031 exchange, divorce, estate, relocation)? That informs how much negotiation room exists.
- What's the average days-on-market for RENTAL listings here right now (not sales)? A rising rental-DOM trend means longer vacancies and softer asking-rent achievability than the comps imply.
- What's the recent tenant-quality profile in this submarket — average credit score on applications, eviction rate, late-payment / NSF rate, and stable-employment percentage? A property-management company in the area should have these aggregated.
- How much new for-sale + rental construction is in the pipeline within 1–3 miles? Heavy new supply typically softens prices + rents 12–24 months out; constrained supply supports both.
Investment metrics
- 1% rule
- 0.97% ✗
- Cap rate
- 6.71%
- Cash-on-cash
- 1.50%
- DSCR
- 1.07
- GRM
- 8.6
CMA / ARV
- ARV (on-the-fly)
- $424,440
- Comps found
- 12
Show comp detail 12 sales within ~0.75 mi
| Address | Dist | Beds/Ba | Sqft | Sold | Price | $/sf | Match |
|---|---|---|---|---|---|---|---|
| 1900 17th St S | 0.45mi | 3/1.0 (-1) | 1,649 (+2%) | 1mo | $308,000 | $187 | 66 |
| 1511 22nd Ave S | 0.30mi | 3/2.0 (-1) | 1,518 (-6%) | 13mo | $398,000 | $262 | 59 |
| 1600 27th Ave S | 0.56mi | 3/2.0 (-1) | 1,524 (-6%) | 2mo | $212,000 | $139 | 57 |
| 2324 13th St S | 0.26mi | 3/2.0 (-1) | 1,415 (-13%) | 8mo | $429,000 | $303 | 55 |
| 625 25th Ave S | 0.57mi | 3/2.0 (-1) | 1,520 (-6%) | 14mo | $160,000 | $105 | 47 |
| 1618 20th Ave S | 0.37mi | 3/1.0 (-1) | 1,378 (-15%) | 3mo | $120,000 | $87 | 46 |
| 851 16th Ave S | 0.42mi | 3/2.0 (-1) | 1,455 (-10%) | 17mo | $385,000 | $265 | 44 |
| 1324 13th Ave S | 0.57mi | 3/2.0 (-1) | 1,726 (+6%) | 16mo | $425,000 | $246 | 44 |
| 1717 Preston St S | 0.48mi | 3/2.0 (-1) | 1,421 (-12%) | 11mo | $345,000 | $243 | 43 |
| 661 14th Ave S | 0.67mi | 3/2.5 (-1) | 1,752 (+8%) | 11mo | $514,900 | $294 | 39 |
| 1119 Highland St S | 0.65mi | 3/2.0 (-1) | 1,856 (+15%) | 11mo | $725,000 | $391 | 32 |
| 2032 22nd Ave S | 0.72mi | 4/2.0 | 1,391 (-14%) | 14mo | $369,900 | $266 | 31 |
Match score weights: distance 35% · size 25% · config 20% · recency 20%. Top-matched comps best support the ARV.
Projected returns pro-forma
-3.0% appreciation · 0.0% rent growth · sell at horizon
- IRR
- -17.5%
- Equity multiple
- 0.40×
- Total profit
- $-44,782
- Equity at exit
- $39,811
- IRR
- -17.0%
- Equity multiple
- 0.19×
- Total profit
- $-60,208
- Equity at exit
- $23,085
Cash invested: $74,760 (down + closing). Projections, not guarantees.
Landlord ↔ Tenant lean methodology
- Overall (STATE)
- 87 Strongly Landlord-Friendly
- State Florida
- 87 Strongly Landlord-Friendly · R+3
- County
- — inherits STATE
- City
- — inherits STATE
ZIP-level market 33705
- Rents YoY
- -0.1%
- Active inventory
- 308
- Price-to-rent
- 8.6×
Monthly cashflow live
- Estimated rent
- $2,589 high interval (Pro) →
- Mortgage (P&I)
- −$1,400
- Tax from tax record
- −$440 /mo · $5,278/yr
- Insurance
- −$111
- HOA
- −$0
- Lot rent
- −$0
- Vacancy / Maint / Mgmt
- −$544
- Net cashflow
- $94
Break-even live
Sensitivity live
| Price | -10% $245 | -5% $169 | +0% $94 | +5% $18 | +10% $-57 |
|---|---|---|---|---|---|
| Rent | -10% $-111 | -5% $-9 | +0% $94 | +5% $196 | +10% $298 |
| Rate | -1.0pp $228 | -0.5pp $162 | base $94 | +0.5pp $24 | +1.0pp $-46 |
UW: 25.0% down · 7.5% · 30yr · 1.5% tax · 5.0% vac · 8.0% maint · 8.0% mgmt
Financing live
Cash to close
- Down payment
- $66,750
- Closing costs
- $8,010
- Reserves months
- —
- Total cash needed
- —
Loan-product check · same deal, 3 products live
Conventional
25% down · 7.5% · 30yr
- Down + closing
- —
- Monthly P&I
- —
- Monthly cashflow
- —
- DSCR
- —
- Eligible?
- —
Personal DTI + credit; lowest rate.
DSCR
20% down · 8.5% · 30yr
- Down + closing
- —
- Monthly P&I
- —
- Monthly cashflow
- —
- DSCR
- —
- Eligible?
- —
No personal income docs; deal must DSCR.
Hard money
10% down · 12.0% · 12mo
- Down + closing
- —
- Monthly P&I
- —
- Monthly cashflow
- —
- DSCR
- —
- Eligible?
- —
Short-term bridge; refi at stabilization.
Rent comps 40 comps
| Address | Beds | Baths | Sqft | Rent | $/sqft | DOM | Units | Dist |
|---|---|---|---|---|---|---|---|---|
| 2003 10th St S Saint Petersburg, FL | 4.0 | 2.0 | 1620 | $2,349 | $1.45 | 10d | 1 | 0.02mi |
| 1013 20th Ave S Saint Petersburg, FL | 4.0 | 2.0 | 1124 | $1,775 | $1.58 | 0d | 1 | 0.05mi |
| 930 20th Ave S St. Petersburg, FL | 3.0 | 1.0 | 1190 | $1,950 | $1.64 | 0d | 1 | 0.10mi |
| 1535 13th St S Saint Petersburg, FL | 4.0 | 2.0 | 1716 | $2,850 | $1.66 | 26d | 1 | 0.38mi |
| 2329 7th St S Saint Petersburg, FL | 3.0 | 3.0 | 1894 | $2,150 | $1.14 | 20d | 1 | 0.43mi |
| 773 W Harbor Dr S Saint Petersburg, FL | 4.0 | 2.0 | 1495 | $2,800 | $1.87 | 26d | 1 | 0.43mi |
| 1763 Preston St S Saint Petersburg, FL | 3.0 | 1.0 | 1158 | $2,350 | $2.03 | 26d | 1 | 0.48mi |
| 1465 15th St S Saint Petersburg, FL | 3.0 | 1.5 | 1405 | $2,400 | $1.71 | 6d | 1 | 0.50mi |
| 1218 13th Ave S Saint Petersburg, FL | 3.0 | 2.0 | 1356 | $2,594 | $1.91 | 6d | 1 | 0.55mi |
| 720 Newton Ave S Saint Petersburg, FL | 4.0 | 2.0 | 1320 | $2,500 | $1.89 | 10d | 1 | 0.56mi |
| 675 16th Ave S Unit 1 St. Petersburg, FL | 4.0 | 2.0 | 1518 | $2,750 | $1.81 | 13d | 1 | 0.56mi |
| 1349 15th St S Saint Petersburg, FL | 3.0 | 2.0 | 1702 | $2,700 | $1.59 | 26d | 1 | 0.57mi |
| 1317 14th St S St Petersburg, FL | 4.0 | 2.0 | 1236 | $2,150 | $1.74 | 26d | 1 | 0.58mi |
| 771 14th Ave S Saint Petersburg, FL | 3.0 | 2.0 | 1184 | $2,850 | $2.41 | 6d | 1 | 0.58mi |
| 2950 Pallanza Dr S Saint Petersburg, FL | 3.0 | 3.0 | 2015 | $3,250 | $1.61 | 6d | 1 | 0.60mi |
| 1900 19th St S Saint Petersburg, FL | 4.0 | 1.0 | 1572 | $2,500 | $1.59 | 6d | 1 | 0.60mi |
| 1900 19th St S Saint Petersburg, FL | 4.0 | 1.0 | 2148 | $2,500 | $1.16 | 26d | 1 | 0.60mi |
| 1121 Dr Martin Luther King Jr St S Saint Petersburg, FL | 3.0 | 2.0 | 1200 | $2,275 | $1.90 | 6d | 1 | 0.63mi |
| 1847 19th St S Saint Petersburg, FL | 3.0 | 2.0 | 1203 | $2,295 | $1.91 | 6d | 1 | 0.63mi |
| 1137 Highland St S Saint Petersburg, FL | 3.0 | 2.0 | 1400 | $2,600 | $1.86 | 4d | 1 | 0.63mi |
| 1911 22nd Ave S St Petersburg, FL | 4.0 | 2.0 | 1424 | $3,000 | $2.11 | 5d | 1 | 0.64mi |
| 2505 18th St S Saint Petersburg, FL | 3.0 | 2.0 | 1198 | $2,350 | $1.96 | 6d | 1 | 0.65mi |
| 2524 19th St S Saint Petersburg, FL | 4.0 | 2.0 | 1230 | $2,495 | $2.03 | 26d | 1 | 0.69mi |
| 2033 20th St S Saint Petersburg, FL | 3.0 | 1.0 | 1752 | $1,775 | $1.01 | 6d | 1 | 0.69mi |
| 2825 6th St S Saint Petersburg, FL | 4.0 | 2.0 | 1235 | $2,590 | $2.10 | 6d | 1 | 0.70mi |
| 2621 18th St S Saint Petersburg, FL | 3.0 | 1.0 | 1114 | $2,200 | $1.97 | 26d | 1 | 0.71mi |
| 2609 4th St S Saint Petersburg, FL | 3.0 | 1.5 | 1095 | $1,595 | $1.46 | 6d | 1 | 0.73mi |
| 2310 21st St S Saint Petersburg, FL | 5.0 | 3.0 | 1500 | $3,460 | $2.31 | 6d | 1 | 0.75mi |
| 2435 20th St S Unit 1 St. Petersburg, FL | 4.0 | 2.0 | 1230 | $2,650 | $2.15 | 26d | 1 | 0.75mi |
| 825 32nd Ave S Saint Petersburg, FL | 1.0–3.0 | 1.0–2.5 | 1518 | $3,840 | $2.53 | 5d | 17 | 0.76mi |
| 1920 14th Ave S Saint Petersburg, FL | 3.0 | 2.0 | 1073 | $1,865 | $1.74 | 26d | 1 | 0.76mi |
| 2720 Edwards Ave S Saint Petersburg, FL | 4.0 | 2.0 | 1298 | $2,300 | $1.77 | 6d | 1 | 0.79mi |
| 1400 21st St S Saint Petersburg, FL | 4.0 | 2.0 | 1487 | $2,970 | $2.00 | 10d | 1 | 0.83mi |
| 985 8th Ave S Unit S St. Petersburg, FL | 3.0 | 1.0 | 1061 | $2,575 | $2.43 | 0d | 1 | 0.87mi |
| 2244 21st Ave S Saint Petersburg, FL | 3.0 | 1.0 | 1229 | $2,250 | $1.83 | 6d | 1 | 0.92mi |
| 2245 17th Ave S Saint Petersburg, FL | 4.0 | 2.0 | 1058 | $2,400 | $2.27 | 6d | 1 | 0.97mi |
| 116 16th Ave SE Saint Petersburg, FL | 3.0 | 2.0 | 1468 | $3,200 | $2.18 | 26d | 1 | 1.00mi |
| 1735 25th St S Saint Petersburg, FL | 5.0 | 2.0 | 1453 | $3,250 | $2.24 | 26d | 1 | 1.14mi |
| 1735 25th St S Unit 1 St. Petersburg, FL | 5.0 | 2.0 | 1543 | $3,250 | $2.11 | 0d | 1 | 1.14mi |
| 750 38th Ave S Saint Petersburg, FL | 3.0 | 1.0 | 1475 | $1,900 | $1.29 | 6d | 1 | 1.17mi |
Listing history 14 events
-
2026-06-09days on market $267,000 Active 38 DOM
-
2026-06-08days on market $267,000 Active 37 DOM
-
2026-06-07days on market $267,000 Active 36 DOM
-
2026-06-04days on market $267,000 Active 33 DOM
-
2026-06-03days on market $267,000 Active 32 DOM
-
2026-06-01days on market $267,000 Active 30 DOM
-
2026-05-31days on market $267,000 Active 29 DOM
-
2026-05-17price $270,000
-
2026-05-11price $275,000
-
2026-05-02$299,900 Active
-
2026-03-16$2,349
-
2026-03-16historical $2,349
-
2026-02-03$2,349
-
2022-12-02soldstatus $140,000
ⓘ Source: listings_history table (triggers on properties + properties_extension) + one-shot
backfill from property_details.listing_events for pre-trigger history.
Tax reassessment forecast FL · Resets to sale price
- Current annual tax
- $5,278 · $440/mo
- Projected year-2 tax
- $5,278 · $440/mo
- Expected delta
- $0/yr ($0/mo · 0.0%)
ⓘ Screening estimate from a state-policy table — verify with the county assessor before closing.
Climate risk First Street
- Flood 1/10 Low FEMA zone X (unshaded) · 0% chance over 30 yrs
- Wildfire 1/10 Low
- Heat 10/10 Extreme 7 d/yr ≥106°F today · 26 d/yr by 30 yrs out
- Wind 10/10 Extreme 99% chance of damaging wind over 30 yrs
- Air quality 3/10 Moderate 2 unhealthy d/yr today · 3 by 30 yrs out
Nearby sold comps map
Loading sold comps map…
Walkable amenities ~0.75 mi
Loading nearby amenities…
Taxation est. · year 1
- Rental income
- $31,062
- − Mortgage interest
- −$14,956
- − Property taxes
- −$5,278
- − Insurance
- −$1,335
- − Repairs & maintenance
- −$2,485
- − Management
- −$2,485
- − Depreciation
- −$7,767
- Taxable loss
- −$3,244
- Est. tax savings @ 24.0%
- +$779
- After-tax cash flow
- $1,902/yr
For passive investors: Depreciation is non-cash, so a rental often shows a tax loss while cash-flowing — sheltering income. Rental losses are passive: they offset passive income freely, and up to $25,000/yr can offset ordinary (W-2) income if you actively participate and your MAGI is under $100k (phasing out to $0 by $150k); unused losses carry forward. On sale, claimed depreciation is recaptured at up to 25%, and gains may owe capital-gains tax (a 1031 exchange can defer both). Figures are a year-1 estimate at your 24.0% rate — not tax advice; consult a CPA.
Schools (NCES district)
- District
- Pinellas
- NCES district ID
- 1201560
- Math proficiency
- 51% ▼ -5.00%
- Reading proficiency
- 51% ▼ -3.00%
- Median HH income
- $46,270
- Composite
- 43.27/100
- National rank
- #3046
- State rank
- #31 of 73 in FL
Livability — St. Petersburg
No livability data for this city. (Only ~50 U.S. cities are tracked.)
Census & demographics
- Census place
- St. Petersburg, FL
- County
- Pinellas County · 939,478 people
- City population
- 249,151
- Metro
- Tampa-St. Petersburg-Clearwater, FL
- Population (ZIP)
- 27,939
- Household income
- $73,027
- Rent vs Own
- Severe rent burden
- 1386.0
Population outlook (Pinellas County) Hauer SSP2
- Today (2025)
- 1,027,532 people
- By 2030
- 1,063,586 · +3.5%
- By 2040
- 1,125,020 · +9.5%
- By 2050
- 1,168,637 · +13.7%
- By 2075
- 1,265,188 · +23.1%
- By 2100
- 1,260,357 · +22.7%
Race, ethnicity, and origin ACS 2023
- Neighborhood character
- Diverse neighborhood (Simpson 0.64)
- Race & ethnicity
- Black 44% White 41% Two or more races 10% Hispanic / Latino 5%
- Hispanic origin (detail)
- Puerto Rican 1%
- Common ancestry
- Lithuanian 2% Italian 1% Slovak 1%
- Foreign-born
- 9% · Canada, Dominican Republic
- Languages at home
- 92% English-only · Spanish 4% Other Indo-European 1% Russian/Polish/Slavic 1%
Political lean MEDSL · Pinellas
- 2024 margin
- Lean R (+5.2) · D 46.9% · R 52.1%
- 2008→2024 swing
- -13.5pp toward R · 2008: 8.3pp · 2024: -5.2pp
- All cycles
- 2024: R+5.2 2020: D+0.2 2016: R+1.1 2012: D+5.6 2008: D+8.3
Not yet ingested
- Civics
- —
Market trends
- HPI YoY
- ▼ -540.28%
- Current HPI
- 388.3086
- Rent YoY
- ▼ -0.13%
- Metro
- Tampa-St. Petersburg-Clearwater, FL
- State GDP YoY
- ▲ 3.28%
- F500 in state
- 36
Industry mix (Fortune 500 HQ in FL)
| Industry | F500 HQs | Revenue |
|---|---|---|
| Industrial Technology | 2 | $29B |
|
||
| Insurance | 2 | $17B |
|
||
| Retail | 1 | $60B |
|
||
| Technology Distribution | 1 | $58B |
|
||
| Homebuilding | 1 | $35B |
|
||
| Technology Manufacturing | 1 | $35B |
|
||
Price history
+92.9% since first listed7 events — show timeline
- 2026-05-17 Price Changed $270,000 Stellar MLS as Distributed by MLS Grid
- 2026-05-11 Price Changed $275,000 Stellar MLS as Distributed by MLS Grid
- 2026-05-02 Listed $299,900 Stellar MLS as Distributed by MLS Grid
- 2026-03-16 Listed for Rent $2,349 STELLARMLS
- 2026-03-16 Rental Removed $2,349 SHOWMOJO
- 2026-02-03 Listed for Rent $2,349 SHOWMOJO
- 2022-12-02 Sold (Public Records) $140,000 Public Records
Property tax history
+16.5%/yrLatest (2025): $5,278 · +13.5% YoY. Source: county tax records.
Cash-flow waterfall
monthlySold comps — $/sqft
last 12 mo · ≤1 miLoading sold comps…