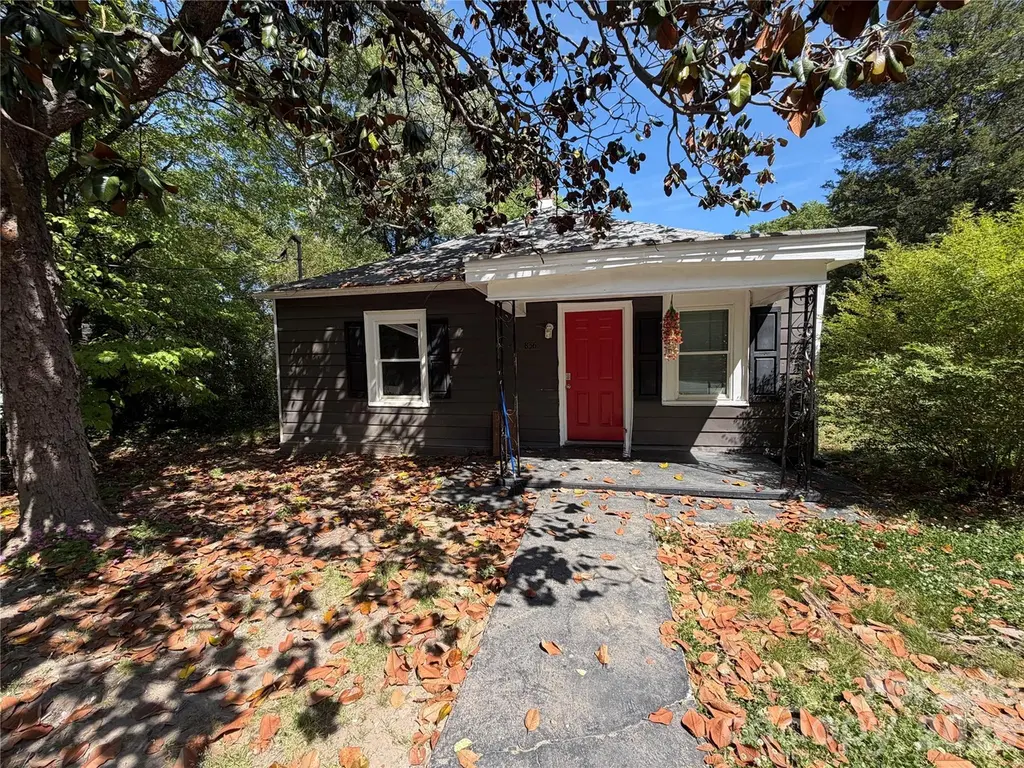
836 S Dalton St · Gastonia, NC
Flood risk 1/10 · Minimal
- FEMA flood zone
- X (unshaded)
- Chance of flooding over 30 yrs
- 0.0%
- Est. flood insurance / yr
- $507 – $1,088
Fire risk 1/10 · Minimal
- Est. fire insurance / yr
- $906 – $1,684
Heat risk 6/10 · Moderate
- Hot days now (above 104°F)
- 7 days/yr
- Hot days in 30 yrs
- 17 days/yr
Wind risk 5/10 · Moderate
- Chance of severe wind over 30 yrs
- 22.0%
Air-quality risk 3/10 · Minor
- Unhealthy air days now
- 3 days/yr
- Unhealthy air days in 30 yrs
- 3 days/yr
Risk factors via First Street. Map © Google.
Why this score? — see what drove the C- grade
The composite is a weighted blend of 9 inputs, each scored 0–100. Each bar is that input's sub-score; the figure is the points it added to the 100-point composite (weight × sub-score).
- Cash flow +15.5/30.0
- ARV discount +14.4/15.0
- DSCR +4.8/10.0
- Rent growth +3.9/5.0
- 1% rule +3.6/10.0
- Schools +3.6/10.0
- Livability +3.0/5.0
- Condition / age +2.5/5.0
- Appreciation +0.0/10.0
$159,500
🖨 Deal sheet (PDF) 📄 Offer letter ✓ Due diligence
Listing remarks
Charming & Versatile Home Near Downtown Gastonia 3 Bedrooms | 2 Bathrooms | Prime Location Welcome to a property that offers the best of both worlds: a proven investment or a perfect place to call home. Whether you are looking to expand your rental portfolio or find a primary residence with great accessibility, this Gastonia gem is ready for its next chapter.
Key facts
- Great accessibility
- Prime location
- 9,147 sq ft lot
Tags
Property features AI
Finance
- HOA & community: No HOA
Exterior
- Parking: Driveway
- Utilities: Public water; Public sewer
- Home design: Single-family residential; One story; Site-built construction
- Construction: Site-built construction materials (Other - see remarks); Crawl space foundation
- Exterior features: Lot is approximately 0.21 acres; Road surface includes dirt and paved; Publicly maintained road
Interior
- Kitchen: Electric oven; Electric range
- Bedrooms: 3 bedrooms — all on the main level
- Bathrooms: 2 full bathrooms — on the main level
- Heating & cooling: Central heating; Central air
- Interior features: 8 total rooms; Electric oven; Electric range; Central heating; Central air
- Laundry & utility: Washer hookup; Electric dryer hookup
Neighborhood map
What this means for you Summary
Snapshot
- This is a 2-bed/1.0-bath single-family listed at $160k.
Deal economics
- At list price, monthly cash flow is $65 ($783/yr) — positive.
- The deal already cash-flows at list — no discount required.
- To meet the 1% rule (rent ≥ 1% of price), the offer needs to be $137k (14.1% below list).
- Recommended offer: $137k (14.1% below list) — sets the bar for 1% rule.
- Cap rate 6.8% vs local median 3.7% in Gastonia — top-decile yield for the area; either an underpriced asset or a hidden risk that comps aren't pricing in. Stress-test before assuming the spread holds.
Location & tenants
- Location reads 59/100 on livability (#528 in NC) — a working-class tenant base; expect higher turnover. Strengths: cost of living A+, housing A+; Watch: employment D, crime F, amenities F.
- Gaston County Schools (suburban): math 44% / reading 42% proficiency, ranked #93 of 178 in NC (top 52%) — families likely to look elsewhere, expect single-tenant / working-renter base with shorter leases.
- Zoned schools: Pleasant Ridge Elementary (math 37% / reading 33%, grade F, #825 of 1,410 statewide, top 59%, 866 students, 100% FRL); York Chester Middle (math 27% / reading 24%, grade F, #388 of 475 statewide, top 83%, 431 students, 98% FRL); Hunter Huss High (math 37% / reading 38%, grade F, #411 of 535 statewide, top 77%, 1,120 students, 80% FRL) — zoned schools average 93% FRL vs 37% district-wide (56 pts higher); higher-poverty schools than district average — tighter screening recommended.
- Market conditions: Rents rising fast (+5.6%/yr); 352 active listings in the ZIP; 40 comparable units currently listed for rent nearby; rentals at typical pace (median 24d on market — plan ~3-4 weeks tenant-placement turnaround); 2,069 units permitted in Gaston County in 2024 (142 in 5+ unit buildings).
- This rent runs 33% of the median local income ($50k/yr) — at the standard rent-burdened threshold; future hikes will face affordability resistance.
Forward outlook
- Local home prices are declining (-3.0%/yr); year-one equity from $1k of loan paydown is wiped out by about $5k of value loss. Plan a longer hold.
- Gaston County population projected at +12% by 2050 — modest demand growth; plan on rents tracking national, not racing it.
Negotiation context
- It's been on market 65 days — a 6% lower offer ($150k) is reasonable based on typical stale-listing flexibility.
- 2 sale attempts with the ask held roughly flat each time — persistent listings suggest the price (not the market) is what's stuck; bring a comps-based counter.
- Current owner paid $116k; 38% above their basis — modest negotiation headroom, anchor on the comps not their cost.
Risks & watch-outs
- Watch-outs: built in 1940 — expect roof / HVAC / electrical / plumbing capex.
- Climate carrying-cost: moderate wind risk, 22% chance of damaging wind over 30y; extreme-heat days projected 7→17/yr by 2055 (HVAC capex compounding) — expect insurance premiums to compound above CPI over the hold.
Questions for the listing agent
- It's been on market 65 days. Have you received any prior offers? Is the seller open to a 14% concession, seller financing, or rate buy-down credit?
- Built in 1940 — when were the roof, HVAC, electrical panel, plumbing, and water heater last replaced?
- Why hasn't it sold? Are there any deal-killer items the seller is aware of (foundation, flood, title, zoning, code violations)?
- Is there a deadline driving the sale (1031 exchange, divorce, estate, relocation)? That informs how much negotiation room exists.
- Schools are D-rated, which usually means shorter tenancies and higher turnover. Who's the typical renter profile here, and what's been the actual vacancy rate?
- Crime grade is F in this area — have there been break-ins, vandalism, or insurance claims at this property in the last 3 years? What carrier currently insures it and at what premium?
- What's the average days-on-market for RENTAL listings here right now (not sales)? A rising rental-DOM trend means longer vacancies and softer asking-rent achievability than the comps imply.
- What's the recent tenant-quality profile in this submarket — average credit score on applications, eviction rate, late-payment / NSF rate, and stable-employment percentage? A property-management company in the area should have these aggregated.
- How much new for-sale + rental construction is in the pipeline within 1–3 miles? Heavy new supply typically softens prices + rents 12–24 months out; constrained supply supports both.
Investment metrics
- 1% rule
- 0.86% ✗
- Cap rate
- 6.78%
- Cash-on-cash
- 1.75%
- DSCR
- 1.08
- GRM
- 9.7
CMA / ARV
- ARV (on-the-fly)
- $188,552
- Comps found
- 12
Show comp detail 12 sales within ~0.75 mi
| Address | Dist | Beds/Ba | Sqft | Sold | Price | $/sf | Match |
|---|---|---|---|---|---|---|---|
| 815 S Weldon St | 0.14mi | 2/2.0 | 1,040 (+0%) | 4mo | $145,000 | $139 | 86 |
| 318 S Liberty St | 0.49mi | 2/1.0 | 1,033 (-0%) | 0mo | $197,700 | $191 | 76 |
| 828 Williams St | 0.07mi | 3/1.0 (+1) | 936 (-10%) | 5mo | $169,900 | $182 | 72 |
| 829 S Dalton St | 0.06mi | 2/2.0 | 894 (-14%) | 4mo | $98,000 | $110 | 67 |
| 1040 East Dr | 0.51mi | 2/1.0 | 1,100 (+6%) | 1mo | $115,000 | $105 | 65 |
| 829 Jackson St | 0.45mi | 2/1.0 | 1,107 (+7%) | 4mo | $137,000 | $124 | 64 |
| 321 S Weldon St | 0.48mi | 3/1.0 (+1) | 1,092 (+5%) | 2mo | $205,000 | $188 | 62 |
| 525 S Trenton St | 0.49mi | 2/1.0 | 929 (-10%) | 2mo | $120,000 | $129 | 58 |
| 609 W Harvie Ave | 0.54mi | 2/1.0 | 900 (-13%) | 2mo | $103,000 | $114 | 52 |
| 409 W Sixth Ave | 0.57mi | 2/2.5 | 1,104 (+7%) | 6mo | $265,000 | $240 | 51 |
| 322 S Hill St | 0.53mi | 3/2.0 (+1) | 1,101 (+6%) | 7mo | $269,999 | $245 | 50 |
| 1210 Cloninger Ave | 0.55mi | 3/2.0 (+1) | 936 (-10%) | 5mo | $220,000 | $235 | 45 |
Match score weights: distance 35% · size 25% · config 20% · recency 20%. Top-matched comps best support the ARV.
Projected returns pro-forma
-3.0% appreciation · 5.63% rent growth · sell at horizon
- IRR
- -10.8%
- Equity multiple
- 0.60×
- Total profit
- $-18,001
- Equity at exit
- $23,782
- IRR
- 1.6%
- Equity multiple
- 1.13×
- Total profit
- $5,661
- Equity at exit
- $13,791
Cash invested: $44,660 (down + closing). Projections, not guarantees.
Landlord ↔ Tenant lean methodology
- Overall (STATE)
- 85 Strongly Landlord-Friendly
- State North Carolina
- 85 Strongly Landlord-Friendly · R+3
- County
- — inherits STATE
- City
- — inherits STATE
ZIP-level market 28052
- Rents YoY
- 5.6%
- Active inventory
- 352
- Price-to-rent
- 9.7×
Monthly cashflow live
- Estimated rent
- $1,370 high interval (Pro) →
- Mortgage (P&I)
- −$836
- Tax from tax record
- −$114 /mo · $1,370/yr
- Insurance
- −$66
- HOA
- −$0
- Vacancy / Maint / Mgmt
- −$288
- Net cashflow
- $65
Break-even live
Sensitivity live
| Price | -10% $156 | -5% $110 | +0% $65 | +5% $20 | +10% $-25 |
|---|---|---|---|---|---|
| Rent | -10% $-43 | -5% $11 | +0% $65 | +5% $119 | +10% $173 |
| Rate | -1.0pp $146 | -0.5pp $106 | base $65 | +0.5pp $24 | +1.0pp $-18 |
UW: 25.0% down · 7.5% · 30yr · 1.5% tax · 5.0% vac · 8.0% maint · 8.0% mgmt
Financing live
Cash to close
- Down payment
- $39,875
- Closing costs
- $4,785
- Reserves months
- —
- Total cash needed
- —
Loan-product check · same deal, 3 products live
Conventional
25% down · 7.5% · 30yr
- Down + closing
- —
- Monthly P&I
- —
- Monthly cashflow
- —
- DSCR
- —
- Eligible?
- —
Personal DTI + credit; lowest rate.
DSCR
20% down · 8.5% · 30yr
- Down + closing
- —
- Monthly P&I
- —
- Monthly cashflow
- —
- DSCR
- —
- Eligible?
- —
No personal income docs; deal must DSCR.
Hard money
10% down · 12.0% · 12mo
- Down + closing
- —
- Monthly P&I
- —
- Monthly cashflow
- —
- DSCR
- —
- Eligible?
- —
Short-term bridge; refi at stabilization.
Rent comps 40 comps
| Address | Beds | Baths | Sqft | Rent | $/sqft | DOM | Units | Dist |
|---|---|---|---|---|---|---|---|---|
| 112 Miller St Gastonia, NC | 3.0 | 1.0 | 950 | $1,395 | $1.47 | 25d | 1 | 0.04mi |
| 112 Miller St Gastonia, NC | 3.0 | 1.0 | 950 | $1,395 | $1.47 | 0d | 1 | 0.04mi |
| 105 Summit St Gastonia, NC | 2.0 | 1.0 | 894 | $995 | $1.11 | 19d | 1 | 0.07mi |
| 112 Dean St Gastonia, NC | 2.0 | 2.0 | 882 | $1,400 | $1.59 | 25d | 1 | 0.12mi |
| 903 W 6th Avenue B Gastonia, NC | 2.0 | 1.0 | 1111 | $1,450 | $1.31 | 22d | 1 | 0.30mi |
| 315 S Ransom St Gastonia, NC | 3.0 | 1.0 | 1012 | $1,399 | $1.38 | 16d | 1 | 0.49mi |
| 1216 Jackson Rd Gastonia, NC | 3.0 | 2.0 | 1254 | $1,825 | $1.46 | 25d | 1 | 0.51mi |
| 300 S Firestone St Gastonia, NC | 1.0 | 1.0 | 902 | $1,425 | $1.58 | 25d | 1 | 0.56mi |
| 300 S Firestone St Gastonia, NC | 2.0 | 2.0 | 1488 | $1,825 | $1.23 | 12d | 1 | 0.56mi |
| 300 S Firestone St Gastonia, NC | 1.0 | 1.0 | 1279 | $1,630 | $1.27 | 5d | 1 | 0.56mi |
| 210 S Highland St Unit A Gastonia, NC | 1.0 | 1.0 | 800 | $995 | $1.24 | 18d | 1 | 0.74mi |
| 106 S Dalton St Gastonia, NC | 3.0 | 2.0 | 1395 | $1,550 | $1.11 | 23d | 1 | 0.74mi |
| 904 Neil St Gastonia, NC | 3.0 | 1.0 | 1400 | $1,100 | $0.79 | 0d | 1 | 0.78mi |
| 407 S Chester St Gastonia, NC | 2.0 | 1.5 | 1060 | $1,262 | $1.19 | 5d | 2 | 0.79mi |
| 1204 Iva Ave Gastonia, NC | 2.0 | 1.0 | 816 | $1,275 | $1.56 | 25d | 1 | 0.83mi |
| 1731 Parkdale Ave Gastonia, NC | 3.0 | 2.0 | 1159 | $1,475 | $1.27 | 14d | 1 | 0.86mi |
| 807 Memory Ln Gastonia, NC | 3.0 | 1.0 | 864 | $1,200 | $1.39 | 25d | 1 | 0.86mi |
| 612 W Main Ave Gastonia, NC | 1.0 | 1.0 | 777 | $1,551 | $2.00 | 25d | 1 | 0.94mi |
| 612 W Main Ave Gastonia, NC | 1.0 | 1.0 | 810 | $1,500 | $1.85 | 4d | 1 | 0.94mi |
| 511 S South St Gastonia, NC | 2.0 | 1.0 | 950 | $1,195 | $1.26 | 25d | 1 | 0.95mi |
| 1917 Parkdale Ave Gastonia, NC | 2.0 | 1.5 | 800 | $930 | $1.16 | 25d | 1 | 0.95mi |
| 1923 Parkdale Ave Gastonia, NC | 2.0 | 1.5 | 800 | $930 | $1.16 | 25d | 1 | 0.96mi |
| 1502 Cloverdale Ln Gastonia, NC | 3.0 | 1.5 | 1368 | $1,599 | $1.17 | 18d | 1 | 0.98mi |
| 412 N Scruggs St Gastonia, NC | 3.0 | 2.5 | 1338 | $1,695 | $1.27 | 25d | 1 | 0.99mi |
| 182 Dixon Cir Gastonia, NC | 1.0 | 1.0 | 1350 | $750 | $0.56 | 18d | 1 | 1.11mi |
| 182 Dixon Cir Gastonia, NC | 1.0 | 1.0 | 1350 | $685 | $0.51 | 25d | 1 | 1.11mi |
| 2104 W 6th Ave Gastonia, NC | 2.0 | 1.0 | 800 | $1,050 | $1.31 | 25d | 1 | 1.11mi |
| 319 Osceola St Gastonia, NC | 2.0 | 1.0 | 785 | $1,275 | $1.62 | 5d | 1 | 1.24mi |
| 319 Osceola St Apt B Gastonia, NC | 2.0 | 2.0 | 785 | $1,275 | $1.62 | 6d | 1 | 1.24mi |
| 319 Osceola St Unit D Gastonia, NC | 2.0 | 1.0 | 785 | $1,300 | $1.66 | 19d | 1 | 1.24mi |
| 147 W Main Ave Gastonia, NC | 3.0 | 1.0–2.0 | 1080 | $1,950 | $1.81 | 25d | 8 | 1.24mi |
| 604 Westwood Cir Gastonia, NC | 2.0 | 1.0 | 886 | $1,450 | $1.64 | 0d | 1 | 1.25mi |
| 401 N Highland St Gastonia, NC | 2.0 | 2.0 | 944 | $1,471 | $1.56 | 6d | 1 | 1.25mi |
| 141 W Main Ave Gastonia, NC | 2.0 | 1.5 | 1200 | $1,599 | $1.33 | 25d | 1 | 1.26mi |
| 225 Tanner St Gastonia, NC | 3.0 | 2.0 | 1154 | $1,693 | $1.47 | 3d | 1 | 1.28mi |
| 710 Glenn St Gastonia, NC | 2.0 | 1.0 | 800 | $1,125 | $1.41 | 25d | 1 | 1.35mi |
| 208 Graham St Gastonia, NC | 3.0 | 2.0 | 1315 | $1,800 | $1.37 | 25d | 1 | 1.37mi |
| 508 Pryor St Gastonia, NC | 3.0 | 1.0 | 1076 | $1,350 | $1.25 | 25d | 1 | 1.38mi |
| 1219 Anderson St Gastonia, NC | 2.0 | 1.5 | 805 | $1,099 | $1.37 | 23d | 1 | 1.41mi |
| 817 W Davidson Ave Gastonia, NC | 3.0 | 2.0 | 1244 | $1,600 | $1.29 | 25d | 1 | 1.41mi |
Listing history 24 events
-
2026-06-21days on market $159,500 Active 65 DOM
-
2026-06-18days on market $159,500 Active 62 DOM
-
2026-06-17days on market $159,500 Active 61 DOM
-
2026-06-16days on market $159,500 Active 60 DOM
-
2026-06-15days on market $159,500 Active 59 DOM
-
2026-06-13days on market $159,500 Active 57 DOM
-
2026-06-09days on market $159,500 Active 53 DOM
-
2026-06-08days on market $159,500 Active 52 DOM
-
2026-06-07days on market $159,500 Active 51 DOM
-
2026-06-04days on market $159,500 Active 48 DOM
-
2026-06-03days on market $159,500 Active 47 DOM
-
2026-06-02days on market $159,500 Active 46 DOM
-
2026-06-01days on market $159,500 Active 45 DOM
-
2026-05-31days on market $159,500 Active 44 DOM
-
2026-04-17$160,000 Active
-
2025-05-02historical $1,250
-
2025-04-16$1,250
-
2019-03-28soldstatus $116,000
-
2018-06-01soldstatus $48,000
-
2013-05-30price $19,900
-
2013-05-02price $20,500 Active
-
2013-03-20price $21,000
-
2013-02-26price $22,000
-
2013-01-21price $23,000
ⓘ Source: listings_history table (triggers on properties + properties_extension) + one-shot
backfill from property_details.listing_events for pre-trigger history.
Tax reassessment forecast NC · Resets to sale price
- Current annual tax
- $1,370 · $114/mo
- Projected year-2 tax
- $1,370 · $114/mo
- Expected delta
- $0/yr ($0/mo · 0.0%)
ⓘ Screening estimate from a state-policy table — verify with the county assessor before closing.
Climate risk First Street
- Flood 1/10 Low FEMA zone X (unshaded) · 0% chance over 30 yrs
- Wildfire 1/10 Low
- Heat 6/10 Major 7 d/yr ≥104°F today · 17 d/yr by 30 yrs out
- Wind 5/10 Major 22% chance of damaging wind over 30 yrs
- Air quality 3/10 Moderate 3 unhealthy d/yr today · 3 by 30 yrs out
Nearby sold comps map
Loading sold comps map…
Walkable amenities ~0.75 mi
Loading nearby amenities…
Taxation est. · year 1
- Rental income
- $16,440
- − Mortgage interest
- −$8,934
- − Property taxes
- −$1,370
- − Insurance
- −$798
- − Repairs & maintenance
- −$1,315
- − Management
- −$1,315
- − Depreciation
- −$4,640
- Taxable loss
- −$1,932
- Est. tax savings @ 24.0%
- +$464
- After-tax cash flow
- $1,247/yr
For passive investors: Depreciation is non-cash, so a rental often shows a tax loss while cash-flowing — sheltering income. Rental losses are passive: they offset passive income freely, and up to $25,000/yr can offset ordinary (W-2) income if you actively participate and your MAGI is under $100k (phasing out to $0 by $150k); unused losses carry forward. On sale, claimed depreciation is recaptured at up to 25%, and gains may owe capital-gains tax (a 1031 exchange can defer both). Figures are a year-1 estimate at your 24.0% rate — not tax advice; consult a CPA.
Schools (NCES district)
- District
- Gaston County Schools
- NCES district ID
- 3701620
- Math proficiency
- 44% ▲ 4.00%
- Reading proficiency
- 42% ▲ 1.00%
- Median HH income
- $43,644
- Composite
- 36.39/100
- National rank
- #4680
- State rank
- #93 of 178 in NC
Livability — Gastonia
- Score
- 59/100
- State rank
- #528
- US rank
- #19444
Category grades
Schools grade is shown separately in the Schools card above.
Census & demographics
- Census place
- Gastonia, NC
- County
- Gaston County · 201,497 people
- City population
- 114,179
- Metro
- Charlotte-Concord-Gastonia, NC-SC
- Population (ZIP)
- 36,272
- Household income
- $49,643
- Rent vs Own
- Severe rent burden
- 1521.0
Population outlook (Gaston County) Hauer SSP2
- Today (2025)
- 230,027 people
- By 2030
- 237,300 · +3.2%
- By 2040
- 249,659 · +8.5%
- By 2050
- 257,806 · +12.1%
- By 2075
- 272,163 · +18.3%
- By 2100
- 268,652 · +16.8%
Race, ethnicity, and origin ACS 2023
- Neighborhood character
- Diverse neighborhood (Simpson 0.65)
- Race & ethnicity
- White 46% Black 33% Hispanic / Latino 16% Two or more races 9%
- Hispanic origin (detail)
- Mexican 6% Puerto Rican 2%
- Common ancestry
- Serbian 2% Slovak 1% Italian 1%
- Foreign-born
- 7% · Canada, Dominican Republic, Jamaica
- Languages at home
- 86% English-only · Spanish 13%
Political lean MEDSL · Gaston
- 2024 margin
- Strong R (+25.0) · D 37.0% · R 62.1%
- 2008→2024 swing
- 0.0pp no change · 2008: -25.0pp · 2024: -25.0pp
- All cycles
- 2024: R+25.0 2020: R+27.8 2016: R+32.1 2012: R+25.6 2008: R+25.0
Not yet ingested
- Civics
- —
Market trends
- HPI YoY
- ▼ -348.71%
- Current HPI
- 252.912
- Rent YoY
- ▲ 5.63%
- Metro
- Charlotte-Concord-Gastonia, NC-SC
- State GDP YoY
- ▲ 3.28%
- F500 in state
- 26
Industry mix (Fortune 500 HQ in NC)
| Industry | F500 HQs | Revenue |
|---|---|---|
| Financial Services | 2 | $213B |
|
||
| Retail | 2 | $95B |
|
||
| Industrial Conglomerate | 1 | $38B |
|
||
| Metals / Steel | 1 | $35B |
|
||
| Utilities | 1 | $30B |
|
||
| Industrial Machinery | 1 | $19B |
|
||
Price history
+595.7% since first listed10 events — show timeline
- 2026-04-17 Listed $160,000 CANOPYMLS as Distributed by MLS Grid
- 2025-05-02 Rental Removed $1,250 PROPERTYWARE
- 2025-04-16 Listed for Rent $1,250 PROPERTYWARE
- 2019-03-28 Sold (Public Records) $116,000 Public Records
- 2018-06-01 Sold (Public Records) $48,000 Public Records
- 2013-05-30 Price Changed $19,900 CANOPYMLS as Distributed by MLS Grid
- 2013-05-02 Price Changed $20,500 CANOPYMLS as Distributed by MLS Grid
- 2013-03-20 Price Changed $21,000 CANOPYMLS as Distributed by MLS Grid
- 2013-02-26 Price Changed $22,000 CANOPYMLS as Distributed by MLS Grid
- 2013-01-21 Price Changed $23,000 CANOPYMLS as Distributed by MLS Grid
Property tax history
+6.2%/yrLatest (2025): $1,370 · +0.0% YoY. Source: county tax records.
Cash-flow waterfall
monthlySold comps — $/sqft
last 12 mo · ≤1 miLoading sold comps…