 Multi-family
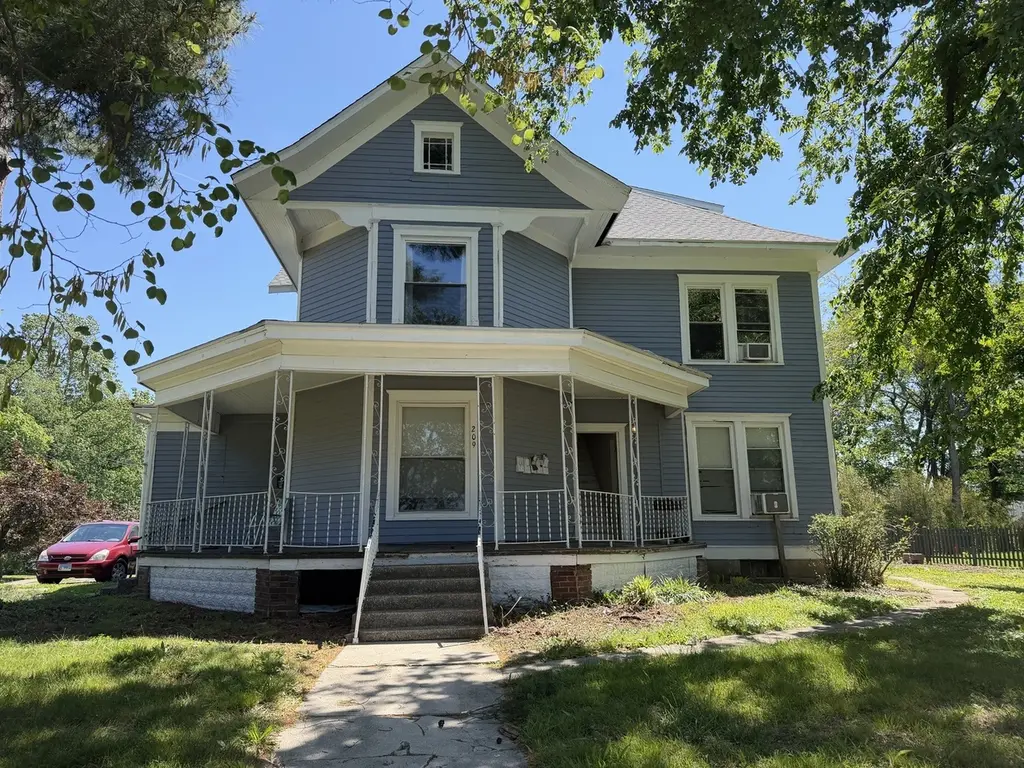
209 N Springer St · Carbondale, IL
Flood risk No data
- FEMA flood zone
- —
- Chance of flooding over 30 yrs
- —
- Est. flood insurance / yr
- —
Fire risk No data
- Est. fire insurance / yr
- —
Heat risk No data
- Hot days now (above threshold)
- —
- Hot days in 30 yrs
- —
Wind risk No data
- Chance of severe wind over 30 yrs
- —
Air-quality risk No data
- Unhealthy air days now
- —
- Unhealthy air days in 30 yrs
- —
Risk factors via First Street. Map © Google.
Why this score? — see what drove the B- grade
The composite is a weighted blend of 9 inputs, each scored 0–100. Each bar is that input's sub-score; the figure is the points it added to the 100-point composite (weight × sub-score).
- Cash flow +30.0/30.0
- 1% rule +10.0/10.0
- DSCR +10.0/10.0
- ARV discount +7.5/15.0
- Rent growth +3.6/5.0
- Livability +3.5/5.0
- Schools +2.4/10.0
- Condition / age +2.2/5.0
- Appreciation +0.0/10.0
$166,900
🖨 Deal sheet (PDF) 📄 Offer letter ✓ Due diligence
Multi-family units
County records classify this as Multi-Family (5+ Unit). Listing-text estimate: 1 unit. estimate disagrees with records
5+ unit building — per-unit beds/baths from public records are typically unavailable; the breakdown below (if shown) is an estimate from the listing text.
Listing remarks
Discover a rare and exceptional investment gem with this beautifully preserved historic property featuring six fully leased apartments, located just minutes from Memorial Hospital of Carbondale. Recognized with awards for its outstanding preservation, this property blends classic architectural elegance with modern practicality, offering both charm and functionality. Perfect for the discerning investor, this income-generating property delivers steady cash flow, timeless appeal, and a prime location in one of Carbondale's most desirable areas. One of the sellers is a REALTOR licensed in Illinois, ensuring a smooth transaction process.
Key facts
- Historic property
- Prime location
- 0.24 acre lot
Tags
Property features AI
Finance
- Other: Property not rebuilt or rehabbed; Built before 1978
- HOA & community: No master association fee required
Exterior
- Parking: Parking for 6 vehicles
- Utilities: Public water; Public sewer
- Home design: Detached single-family home; Two-story; Fee simple ownership; Estimated living area; Built more than 100 years ago; Property located in an unincorporated area
- Construction: Asphalt roof; Other construction materials
- Exterior features: Lot dimensions approximately 101 x 105
Interior
- Kitchen: Kitchen on main level
- Bedrooms: 6 bedrooms (Master, Bedrooms 2–6) — master on main; other bedrooms on main and second floor
- Bathrooms: 6 full bathrooms
- Heating & cooling: Electric baseboard heating; Window air conditioning units
- Interior features: 7 total rooms; Unfinished, partial basement with crawl space
- Laundry & utility: Laundry room
Neighborhood map
What this means for you Summary
Snapshot
- This is a 6-bed/6.0-bath multifamily listed at $167k. Condition is rated fair.
Deal economics
- At list price, monthly cash flow is $2k ($27k/yr) — positive.
- The deal already cash-flows at list — no discount required.
- Meets the 1% rule at list price ($4k rent vs $167k).
- Recommended offer: $162k (3.0% below list) — sets the bar for market timing.
- Cap rate 22.6% vs local median 4.7% in Carbondale — top-decile yield for the area; either an underpriced asset or a hidden risk that comps aren't pricing in. Stress-test before assuming the spread holds.
Location & tenants
- Location reads 70/100 on livability (#375 in IL) — a middle-class / working-renter tenant base. Strengths: amenities A+, commute A+, cost of living A+; Watch: housing C-, crime F, employment F.
- Carbondale Chsd 165 (urban): math 26% / reading 35% proficiency, ranked #279 of 620 in IL (top 45%) — families likely to look elsewhere, expect single-tenant / working-renter base with shorter leases.
- Zoned schools: Parrish Elem School (495 students, 0% FRL); Carbondale Middle School (math 5% / reading 14%, grade F, #597 of 665 statewide, top 91%, 446 students, 0% FRL); Carbondale Comm H S (math 26% / reading 35%, grade F, #175 of 693 statewide, top 26%, 997 students, 0% FRL).
- Market conditions: Rents rising fast (+4.5%/yr); 201 active listings in the ZIP; lower-income renter base — watch delinquency; 5 units permitted in Jackson County in 2024 (0 in 5+ unit buildings).
- At $4,327/mo this rent would consume 148% of the median local household income ($35k/yr) (locally 2038% of renters already pay >50% of income on rent) — very limited rent-growth headroom before tenants either downsize or default.
Forward outlook
- Local home prices are declining (-3.0%/yr); year-one equity from $1k of loan paydown is wiped out by about $5k of value loss. Plan a longer hold.
- At projected returns (-3.0% appreciation + 4.5% rent growth), your $47k cash investment doubles in ~2 years — after that, you're playing with house money.
Negotiation context
- It's been on market 35 days — a 3% lower offer ($162k) is reasonable based on typical stale-listing flexibility.
- 3 sale attempts with the ask held roughly flat each time — persistent listings suggest the price (not the market) is what's stuck; bring a comps-based counter.
Risks & watch-outs
- Watch-outs: built in 1900 — expect roof / HVAC / electrical / plumbing capex.
Questions for the listing agent
- It's been on market 35 days. Have you received any prior offers? Is the seller open to a 3% concession, seller financing, or rate buy-down credit?
- Have any recent inspections been done? Can we get a copy of the seller's disclosures and any deferred-maintenance estimates?
- Built in 1900 — when were the roof, HVAC, electrical panel, plumbing, and water heater last replaced?
- Is there a deadline driving the sale (1031 exchange, divorce, estate, relocation)? That informs how much negotiation room exists.
- Schools are D-rated, which usually means shorter tenancies and higher turnover. Who's the typical renter profile here, and what's been the actual vacancy rate?
- Crime grade is F in this area — have there been break-ins, vandalism, or insurance claims at this property in the last 3 years? What carrier currently insures it and at what premium?
- What's the average days-on-market for RENTAL listings here right now (not sales)? A rising rental-DOM trend means longer vacancies and softer asking-rent achievability than the comps imply.
- What's the recent tenant-quality profile in this submarket — average credit score on applications, eviction rate, late-payment / NSF rate, and stable-employment percentage? A property-management company in the area should have these aggregated.
- How much new apartment / multifamily construction is in the pipeline within 1–3 miles? Heavy new supply (>2% of stock underway) typically softens rents 12–24 months out; light construction supports rent growth.
Investment metrics
- 1% rule
- 2.59% ✓
- Cap rate
- 22.58%
- Cash-on-cash
- 58.16%
- DSCR
- 3.59
- GRM
- 3.2
CMA / ARV
No comps found within radius.
Projected returns pro-forma
-3.0% appreciation · 4.51% rent growth · sell at horizon
- IRR
- 58.4%
- Equity multiple
- 3.65×
- Total profit
- $123,947
- Equity at exit
- $24,885
- IRR
- 63.8%
- Equity multiple
- 7.89×
- Total profit
- $322,184
- Equity at exit
- $14,430
Cash invested: $46,732 (down + closing). Projections, not guarantees.
Landlord ↔ Tenant lean methodology
- Overall (STATE)
- 43 Moderately Tenant-Leaning
- State Illinois
- 43 Moderately Tenant-Leaning · D+7
- County
- — inherits STATE
- City
- — inherits STATE
ZIP-level market 62901
- Rents YoY
- 4.5%
- Active inventory
- 201
- Price-to-rent
- 19.3×
Monthly cashflow live
- Estimated rent
- $4,327 medium interval (Pro) →
- Mortgage (P&I)
- −$875
- Tax est. 1.5%
- −$209 /mo · $2,504/yr
- Insurance
- −$70
- HOA
- −$0
- Vacancy / Maint / Mgmt
- −$909
- Net cashflow
- $2,265
Break-even live
Sensitivity live
| Price | -10% $2,380 | -5% $2,323 | +0% $2,265 | +5% $2,207 | +10% $2,150 |
|---|---|---|---|---|---|
| Rent | -10% $1,923 | -5% $2,094 | +0% $2,265 | +5% $2,436 | +10% $2,607 |
| Rate | -1.0pp $2,349 | -0.5pp $2,307 | base $2,265 | +0.5pp $2,222 | +1.0pp $2,178 |
6-unit breakdown (identical units grouped — click to expand)
| Units | Beds | Baths | Est. rent |
|---|---|---|---|
| 6× units | 2 | 1 | $4,326 |
| #1 | 2 | 1 | $721 |
| #2 | 2 | 1 | $721 |
| #3 | 2 | 1 | $721 |
| #4 | 2 | 1 | $721 |
| #5 | 2 | 1 | $721 |
| #6 | 2 | 1 | $721 |
| Total (6 units) | $4,327 | ||
UW: 25.0% down · 7.5% · 30yr · 1.5% tax · 5.0% vac · 8.0% maint · 8.0% mgmt
Financing live
Cash to close
- Down payment
- $41,725
- Closing costs
- $5,007
- Reserves months
- —
- Total cash needed
- —
Loan-product check · same deal, 3 products live
Conventional
25% down · 7.5% · 30yr
- Down + closing
- —
- Monthly P&I
- —
- Monthly cashflow
- —
- DSCR
- —
- Eligible?
- —
Personal DTI + credit; lowest rate.
DSCR
20% down · 8.5% · 30yr
- Down + closing
- —
- Monthly P&I
- —
- Monthly cashflow
- —
- DSCR
- —
- Eligible?
- —
No personal income docs; deal must DSCR.
Hard money
10% down · 12.0% · 12mo
- Down + closing
- —
- Monthly P&I
- —
- Monthly cashflow
- —
- DSCR
- —
- Eligible?
- —
Short-term bridge; refi at stabilization.
Listing history 24 events
-
2026-06-22days on market $166,900 Active 35 DOM
-
2026-06-19days on market $166,900 Active 32 DOM
-
2026-06-18days on market $166,900 Active 31 DOM
-
2026-06-17days on market $166,900 Active 30 DOM
-
2026-06-16days on market $166,900 Active 29 DOM
-
2026-06-15days on market $166,900 Active 28 DOM
-
2026-06-14days on market $166,900 Active 26 DOM
-
2026-06-13days on market $166,900 Active 25 DOM
-
2026-06-10days on market $166,900 Active 23 DOM
-
2026-06-09days on market $166,900 Active 22 DOM
-
2026-06-08days on market $166,900 Active 21 DOM
-
2026-06-07days on market $166,900 Active 20 DOM
-
2026-06-02days on market $166,900 Active 15 DOM
-
2026-06-01days on market $166,900 Active 14 DOM
-
2026-05-31days on market $166,900 Active 13 DOM
-
2026-05-30days on market $166,900 Active 12 DOM
-
2026-05-18$166,900 Active
-
2026-01-06historical
-
2025-09-20price
-
2025-07-30Active
-
2025-07-26historical
-
2025-07-26historical
-
2025-05-08Active
-
2025-05-08historical
ⓘ Source: listings_history table (triggers on properties + properties_extension) + one-shot
backfill from property_details.listing_events for pre-trigger history.
Nearby sold comps map
Loading sold comps map…
Walkable amenities ~0.75 mi
Loading nearby amenities…
Taxation est. · year 1
- Rental income
- $51,924
- − Mortgage interest
- −$9,349
- − Property taxes
- −$2,504
- − Insurance
- −$834
- − Repairs & maintenance
- −$4,154
- − Management
- −$4,154
- − Depreciation
- −$4,855
- Taxable income
- $26,074
- Est. tax owed @ 24.0%
- −$6,258
- After-tax cash flow
- $20,921/yr
For passive investors: Depreciation is non-cash, so a rental often shows a tax loss while cash-flowing — sheltering income. Rental losses are passive: they offset passive income freely, and up to $25,000/yr can offset ordinary (W-2) income if you actively participate and your MAGI is under $100k (phasing out to $0 by $150k); unused losses carry forward. On sale, claimed depreciation is recaptured at up to 25%, and gains may owe capital-gains tax (a 1031 exchange can defer both). Figures are a year-1 estimate at your 24.0% rate — not tax advice; consult a CPA.
Condition & rehab AI · 12 photos
This multi-family property requires moderate renovations to improve its condition and increase its value. Key areas for improvement include the kitchen, bathrooms, and exterior. Upgrading these areas will attract more tenants and buyers, increasing both rental and resale value.
Repairs flagged
- Major Kitchen appliances — Outdated and in poor condition.
- Major Bathroom fixtures — Worn and in poor condition.
- Minor Exterior siding — Some areas show wear, but overall in fair condition.
- Minor Interior walls/paint — Signs of wear and tear, but not severe.
- Minor Windows — Some may need replacement, but overall in fair condition.
- Minor Landscaping — Overgrown areas and debris need attention.
- Minor HVAC/mechanicals — In fair condition, but may need maintenance or minor repairs
Value-add opportunities
- Both Replace kitchen appliances — Modern appliances will attract more tenants and increase rental value.
- Both Replace bathroom fixtures — Upgraded fixtures will attract more tenants and increase rental value.
- Both Paint interior walls — Fresh paint will improve the home's appearance and attract more buyers.
- Both Landscaping and curb appeal — A well-maintained exterior will attract more buyers and renters.
- Both HVAC maintenance — A well-maintained HVAC system will attract more tenants and increase rental value.
- Both Replace worn-out windows — New windows will improve energy efficiency and attract more buyers and renters
Renovation cost estimate screening
| Repair item | Severity | Est. cost |
|---|---|---|
| Kitchen appliances · Outdated and in poor condition. | Major | $15,000–50,000 |
| Bathroom fixtures · Worn and in poor condition. | Major | $15,000–50,000 |
| Exterior siding · Some areas show wear, but overall in fair condition. | Minor | $500–3,000 |
| Interior walls/paint · Signs of wear and tear, but not severe. | Minor | $500–3,000 |
| Windows · Some may need replacement, but overall in fair condition. | Minor | $500–3,000 |
| Landscaping · Overgrown areas and debris need attention. | Minor | $500–3,000 |
| HVAC/mechanicals · In fair condition, but may need maintenance or minor repairs | Minor | $500–3,000 |
| Total estimated repair cost · 7 items | $32,500–115,000 |
Value-add ROI direction
- Both Replace kitchen appliances — Modern appliances will attract more tenants and increase rental value. ↑
- Both Replace bathroom fixtures — Upgraded fixtures will attract more tenants and increase rental value. ↑
- Both Paint interior walls — Fresh paint will improve the home's appearance and attract more buyers. ↑
- Both Landscaping and curb appeal — A well-maintained exterior will attract more buyers and renters. ↑
- Both HVAC maintenance — A well-maintained HVAC system will attract more tenants and increase rental value. ↑
- Both Replace worn-out windows — New windows will improve energy efficiency and attract more buyers and renters ↑
ⓘ Cost ranges are severity-bucket heuristics (US national rule-of-thumb). Get contractor quotes + a written scope before underwriting a rehab budget.
Schools (NCES district)
- District
- Carbondale Chsd 165
- NCES district ID
- 1708370
- Math proficiency
- 26% ▼ -10.00%
- Reading proficiency
- 35% ▼ -2.00%
- Median HH income
- $22,075
- Composite
- 23.92/100
- National rank
- #7787
- State rank
- #279 of 620 in IL
Livability — Carbondale
- Score
- 70/100
- State rank
- #375
- US rank
- #7806
Category grades
Schools grade is shown separately in the Schools card above.
Census & demographics
- Census place
- Carbondale, IL
- County
- Jackson County · 22,946 people
- City population
- 22,946
- Metro
- Carbondale-Marion, IL
- Population (ZIP)
- 22,946
- Household income
- $35,089
- Rent vs Own
- Severe rent burden
- 2038.0
Population outlook (Jackson County) Hauer SSP2
- Today (2025)
- 59,093 people
- By 2030
- 59,628 · +0.9%
- By 2040
- 59,495 · +0.7%
- By 2050
- 58,811 · -0.5%
- By 2075
- 57,683 · -2.4%
- By 2100
- 55,337 · -6.4%
Race, ethnicity, and origin ACS 2023
- Neighborhood character
- Diverse neighborhood (Simpson 0.58)
- Race & ethnicity
- White 59% Black 26% Asian 6% Hispanic / Latino 5% Two or more races 5%
- Hispanic origin (detail)
- Mexican 4%
- Common ancestry
- Romanian 2% Italian 2% Slovak 2%
- Foreign-born
- 9% · Canada, China, South Korea
- Languages at home
- 87% English-only · Other Indo-European 4% Spanish 4% Arabic 2%
Political lean MEDSL · Jackson
- 2024 margin
- Toss-up / Even · D 51.0% · R 47.5% · Other 1.4%
- 2008→2024 swing
- -18.3pp toward R · 2008: 21.8pp · 2024: 3.5pp
- All cycles
- 2024: D+3.5 2020: D+1.3 2016: D+3.0 2012: D+10.3 2008: D+21.8
Not yet ingested
- Civics
- —
Market trends
- HPI YoY
- ▼ -75.62%
- Current HPI
- 88.7209
- Rent YoY
- ▲ 4.51%
- Metro
- Carbondale-Marion, IL
- State GDP YoY
- ▲ 1.59%
- F500 in state
- 60
Industry mix (Fortune 500 HQ in IL)
| Industry | F500 HQs | Revenue |
|---|---|---|
| Insurance | 4 | $201B |
|
||
| Consumer Goods | 4 | $87B |
|
||
| Industrial Machinery | 3 | $64B |
|
||
| Healthcare | 2 | $55B |
|
||
| Retail / Pharmacy | 1 | $148B |
|
||
| Agriculture / Food | 1 | $86B |
|
||
Price history
8 events — show timeline
- 2026-05-18 Listed $166,900 MRED as Distributed by MLS Grid
- 2026-01-06 Listing Removed — RMLSA as Distributed by MLS Grid
- 2025-09-20 Price Changed — RMLSA as Distributed by MLS Grid
- 2025-07-30 Listed — RMLSA as Distributed by MLS Grid
- 2025-07-26 Listing Removed — RMLSA as Distributed by MLS Grid
- 2025-07-26 Listing Removed — MRED as Distributed by MLS Grid
- 2025-05-08 Listing Removed — MRED as Distributed by MLS Grid
- 2025-05-08 Listed — RMLSA as Distributed by MLS Grid
Cash-flow waterfall
monthlySold comps — $/sqft
last 12 mo · ≤1 miLoading sold comps…