1200 W Winton Ave #81 · Hayward, CA
Flood risk 1/10 · Minimal
- FEMA flood zone
- X (unshaded)
- Chance of flooding over 30 yrs
- 0.0%
- Est. flood insurance / yr
- $507 – $1,088
Fire risk 1/10 · Minimal
- Est. fire insurance / yr
- $659 – $1,223
Heat risk 4/10 · Minor
- Hot days now (above 88°F)
- 7 days/yr
- Hot days in 30 yrs
- 14 days/yr
Wind risk 1/10 · Minimal
- Chance of severe wind over 30 yrs
- —
Air-quality risk 7/10 · Major
- Unhealthy air days now
- 12 days/yr
- Unhealthy air days in 30 yrs
- 12 days/yr
Risk factors via First Street. Map © Google.
Why this score? — see what drove the C grade
The composite is a weighted blend of 9 inputs, each scored 0–100. Each bar is that input's sub-score; the figure is the points it added to the 100-point composite (weight × sub-score).
- Cash flow +28.6/30.0
- DSCR +10.0/10.0
- 1% rule +6.6/10.0
- Livability +3.8/5.0
- Rent growth +3.2/5.0
- Schools +3.1/10.0
- Condition / age +2.5/5.0
- ARV discount +0.0/15.0
- Appreciation +0.0/10.0
$264,900
🖨 Deal sheet (PDF) 📄 Offer letter ✓ Due diligence
Listing remarks MLS
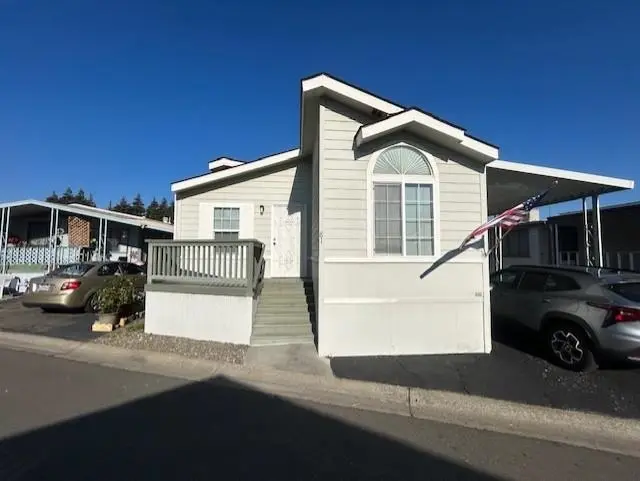
Manufactured home in Hayward Mobile Country Club (adult community 55+) has: 2 bedrooms; 2 full baths; 2 cell clear story skylight in living room; vaulted ceilings throughout; galley style kitchen; primary bedroom with private bath and walk in closet; indoor laundry room with washer and dryer included; relaxing front porch; 1 shed and more, this home is ready for it's new owners to enjoy!
Key facts
- Private bath
- Walk in closet
- Indoor laundry room
Tags
Neighborhood map
What this means for you Summary
Snapshot
- This is a 2-bed/2.0-bath manufactured listed at $265k.
Deal economics
- At list price, monthly cash flow is $871 ($10k/yr) — positive.
- The deal already cash-flows at list — no discount required.
- Meets the 1% rule at list price ($3k rent vs $265k).
- Recommended offer: $249k (6.0% below list) — sets the bar for market timing.
- Cap rate 10.2% vs local median 2.1% in Hayward — top-decile yield for the area; either an underpriced asset or a hidden risk that comps aren't pricing in. Stress-test before assuming the spread holds.
Location & tenants
- Location reads 75/100 on livability (#124 in CA, #4,294 nationally) — a middle-class / working-renter tenant base. Strengths: commute A+, employment A+, health & safety A+; Watch: crime F, cost of living F.
- Hayward Unified (urban): math 25% / reading 37% proficiency, ranked #935 of 1,400 in CA (top 67%) — families likely to look elsewhere, expect single-tenant / working-renter base with shorter leases; 61% free/reduced lunch — lower-income household profile, screen leases tightly.
- Zoned schools: Eden Gardens Elementary (481 students, 59% FRL); Anthony W. Ochoa Middle (407 students, 77% FRL); Mt. Eden High (1,947 students, 69% FRL).
- Market conditions: Rents rising (+2.6%/yr); 72 active listings in the ZIP; 22 comparable units currently listed for rent nearby; rentals leasing fast (median 7d on market — plan ~1-2 weeks tenant-placement turnaround); high-income renter base; 1,742 units permitted in Alameda County in 2024 (856 in 5+ unit buildings).
- This rent runs 32% of the median local income ($114k/yr) — at the standard rent-burdened threshold; future hikes will face affordability resistance.
Forward outlook
- Local home prices are declining (-3.0%/yr); year-one equity from $2k of loan paydown is wiped out by about $8k of value loss. Plan a longer hold.
- Alameda County population projected at +34% by 2050 — long-run rental-demand tailwind backs the buy-and-hold thesis.
- At projected returns (-3.0% appreciation + 2.6% rent growth), your $74k cash investment doubles in ~9 years — after that, you're playing with house money.
Negotiation context
- It's been on market 80 days — a 6% lower offer ($249k) is reasonable based on typical stale-listing flexibility.
- 2 sale attempts with the ask held roughly flat each time — persistent listings suggest the price (not the market) is what's stuck; bring a comps-based counter.
Questions for the listing agent
- It's been on market 80 days. Have you received any prior offers? Is the seller open to a 6% concession, seller financing, or rate buy-down credit?
- Why hasn't it sold? Are there any deal-killer items the seller is aware of (foundation, flood, title, zoning, code violations)?
- Is there a deadline driving the sale (1031 exchange, divorce, estate, relocation)? That informs how much negotiation room exists.
- Schools are D-rated, which usually means shorter tenancies and higher turnover. Who's the typical renter profile here, and what's been the actual vacancy rate?
- Crime grade is F in this area — have there been break-ins, vandalism, or insurance claims at this property in the last 3 years? What carrier currently insures it and at what premium?
- What's the average days-on-market for RENTAL listings here right now (not sales)? A rising rental-DOM trend means longer vacancies and softer asking-rent achievability than the comps imply.
- What's the recent tenant-quality profile in this submarket — average credit score on applications, eviction rate, late-payment / NSF rate, and stable-employment percentage? A property-management company in the area should have these aggregated.
- How much new for-sale + rental construction is in the pipeline within 1–3 miles? Heavy new supply typically softens prices + rents 12–24 months out; constrained supply supports both.
Investment metrics
- 1% rule
- 1.16% ✓
- Cap rate
- 10.24%
- Cash-on-cash
- 14.09%
- DSCR
- 1.63
- GRM
- 7.2
CMA / ARV
- ARV (median comp)
- $200,932
- List price
- $264,900
- Delta
- 31.84%
- Verdict
- OVERPRICED
- Comps
- 12 within 1.0 mi
Show comp detail 9 sales within ~0.75 mi
| Address | Dist | Beds/Ba | Sqft | Sold | Price | $/sf | Match |
|---|---|---|---|---|---|---|---|
| 1200 W Winton Ave #81 | 0.00mi | 2/2.0 | 1,080 (0%) | 0mo | $264,900 | $245 | 100 |
| 1200 W Winton Ave #86 | 0.04mi | 2/2.0 | 1,090 (+1%) | 1mo | $280,000 | $257 | 96 |
| 1200 W Winton #145 | 0.05mi | 2/2.0 | 1,119 (+4%) | 6mo | $300,000 | $268 | 87 |
| 1200 W Winton Ave #90 | 0.06mi | 2/2.0 | 1,010 (-6%) | 2mo | $265,000 | $262 | 84 |
| 1150 W Winton Ave #229 | 0.15mi | 2/2.0 | 1,140 (+6%) | 2mo | $177,000 | $155 | 82 |
| 1200 W Winton Ave #224 | 0.05mi | 2/2.0 | 1,000 (-7%) | 6mo | $205,000 | $205 | 80 |
| 1200 W Winton Ave. #233 #233 | 0.05mi | 2/2.0 | 1,120 (+4%) | 21mo | $138,000 | $123 | 74 |
| 1200 W Winton Ave #176 | 0.11mi | 3/2.0 (+1) | 1,040 (-4%) | 16mo | $165,000 | $159 | 70 |
| 1200 W Winton #49 | 0.10mi | 2/2.0 | 1,152 (+7%) | 21mo | $280,000 | $243 | 67 |
Match score weights: distance 35% · size 25% · config 20% · recency 20%. Top-matched comps best support the ARV.
Projected returns pro-forma
-3.0% appreciation · 2.61% rent growth · sell at horizon
- IRR
- 3.9%
- Equity multiple
- 1.15×
- Total profit
- $11,208
- Equity at exit
- $39,497
- IRR
- 13.1%
- Equity multiple
- 2.02×
- Total profit
- $75,782
- Equity at exit
- $22,904
Cash invested: $74,172 (down + closing). Projections, not guarantees.
Landlord ↔ Tenant lean methodology
- Overall (STATE)
- 18 Strongly Tenant-Friendly
- State California
- 18 Strongly Tenant-Friendly · D+13
- County
- — inherits STATE
- City
- — inherits STATE
ZIP-level market 94545
- Rents YoY
- 2.6%
- Active inventory
- 72
- Price-to-rent
- 7.2×
Monthly cashflow live
- Estimated rent
- $3,072 high interval (Pro) →
- Mortgage (P&I)
- −$1,389
- Tax from tax record
- −$56 /mo · $675/yr
- Insurance
- −$110
- HOA
- −$0
- Vacancy / Maint / Mgmt
- −$645
- Net cashflow
- $871
Break-even live
Sensitivity live
| Price | -10% $1,021 | -5% $946 | +0% $871 | +5% $796 | +10% $721 |
|---|---|---|---|---|---|
| Rent | -10% $628 | -5% $749 | +0% $871 | +5% $992 | +10% $1,113 |
| Rate | -1.0pp $1,004 | -0.5pp $938 | base $871 | +0.5pp $802 | +1.0pp $732 |
UW: 25.0% down · 7.5% · 30yr · 1.5% tax · 5.0% vac · 8.0% maint · 8.0% mgmt
Financing live
Cash to close
- Down payment
- $66,225
- Closing costs
- $7,947
- Reserves months
- —
- Total cash needed
- —
Loan-product check · same deal, 3 products live
Conventional
25% down · 7.5% · 30yr
- Down + closing
- —
- Monthly P&I
- —
- Monthly cashflow
- —
- DSCR
- —
- Eligible?
- —
Personal DTI + credit; lowest rate.
DSCR
20% down · 8.5% · 30yr
- Down + closing
- —
- Monthly P&I
- —
- Monthly cashflow
- —
- DSCR
- —
- Eligible?
- —
No personal income docs; deal must DSCR.
Hard money
10% down · 12.0% · 12mo
- Down + closing
- —
- Monthly P&I
- —
- Monthly cashflow
- —
- DSCR
- —
- Eligible?
- —
Short-term bridge; refi at stabilization.
Rent comps 22 comps
| Address | Beds | Baths | Sqft | Rent | $/sqft | DOM | Units | Dist |
|---|---|---|---|---|---|---|---|---|
| 946 Hohener Ave Hayward, CA | 3.0 | 2.0 | 1434 | $3,600 | $2.51 | 16d | 1 | 0.59mi |
| 936 Lucia Ct Hayward, CA | 3.0 | 1.0 | 1350 | $2,875 | $2.13 | 6d | 1 | 0.72mi |
| 25000 Copa del Oro Dr #201 Hayward, CA | 2.0 | 2.0 | 855 | $3,000 | $3.51 | 45d | 1 | 0.80mi |
| 22846 Nevada Rd Unit 22850 Hayward, CA | 3.0 | 2.0 | 1247 | $4,095 | $3.28 | 0d | 1 | 0.83mi |
| 22846 Nevada Rd Unit 22846 Hayward, CA | 3.0 | 2.0 | 1053 | $3,795 | $3.60 | 0d | 1 | 0.83mi |
| 22846 Nevada Rd Unit 22854 Hayward, CA | 2.0 | 2.0 | 748 | $3,195 | $4.27 | 45d | 1 | 0.83mi |
| 22846 Nevada Rd Unit 22856 Hayward, CA | 2.0 | 2.0 | 744 | $3,995 | $5.37 | 0d | 1 | 0.83mi |
| 694 Tehama Ave Hayward, CA | 3.0 | 1.5 | 1136 | $3,300 | $2.90 | 0d | 1 | 0.87mi |
| 21600 Westpark St Hayward, CA | 1.0 | 1.0 | 700 | $1,795 | $2.56 | 45d | 1 | 0.94mi |
| 22211 S Garden Ave Hayward, CA | 2.0 | 1.0 | 900 | $2,145 | $2.38 | 6d | 2 | 1.00mi |
| 25800 Industrial Blvd Hayward, CA | 1.0–2.0 | 1.0–2.0 | 820 | $2,893 | $3.53 | 0d | 9 | 1.01mi |
| 22230 S Garden Ave Hayward, CA | 2.0 | 1.0 | 700 | $2,500 | $3.57 | 6d | 1 | 1.03mi |
| 1172 Huron Ln Hayward, CA | 3.0 | 2.0 | 1290 | $5,000 | $3.88 | 23d | 1 | 1.14mi |
| 1256 Stanhope Ln Hayward, CA | 1.0 | 1.0 | 748 | $2,650 | $3.54 | 45d | 1 | 1.20mi |
| 22078 Arbor Ave Hayward Acres, CA | 1.0–2.0 | 1.0 | 649 | $2,140 | $3.29 | 22d | 1 | 1.22mi |
| 21944 Arbor Ave Hayward, CA | 2.0 | 1.0 | 800 | $2,895 | $3.62 | 45d | 1 | 1.25mi |
| 466 Mackenzie Pl Hayward, CA | 3.0 | 2.0 | 1173 | $3,900 | $3.32 | 26d | 1 | 1.25mi |
| 280 Flint Ct Hayward Acres, CA | 2.0 | 1.0 | 700 | $2,250 | $3.21 | 4d | 1 | 1.32mi |
| 1098 Azalea Ct Hayward, CA | 3.0 | 2.5 | 1332 | $3,500 | $2.63 | 0d | 1 | 1.33mi |
| 24650 Amador St Hayward, CA | 1.0–3.0 | 1.0–2.0 | 822 | $2,788 | $3.39 | 0d | 15 | 1.35mi |
| 24660 Amador St Hayward, CA | 1.0–2.0 | 1.0 | 625 | $2,600 | $4.16 | 1d | 3 | 1.38mi |
| 894 Blaine Way Unit ADU Hayward, CA | 2.0 | 2.0 | 850 | $2,700 | $3.18 | 45d | 1 | 1.48mi |
Listing history 5 events
-
2026-05-16status Pending 391-char remark
Show marketing remark (391 chars)
Manufactured home in Hayward Mobile Country Club (adult community 55+) has: 2 bedrooms; 2 full baths; 2 cell clear story skylight in living room; vaulted ceilings throughout; galley style kitchen; primary bedroom with private bath and walk in closet; indoor laundry room with washer and dryer included; relaxing front porch; 1 shed and more, this home is ready for it's new owners to enjoy!
-
2026-05-05price $264,900 391-char remark
Show marketing remark (391 chars)
Manufactured home in Hayward Mobile Country Club (adult community 55+) has: 2 bedrooms; 2 full baths; 2 cell clear story skylight in living room; vaulted ceilings throughout; galley style kitchen; primary bedroom with private bath and walk in closet; indoor laundry room with washer and dryer included; relaxing front porch; 1 shed and more, this home is ready for it's new owners to enjoy!
-
2026-03-12status Active 391-char remark
Show marketing remark (391 chars)
Manufactured home in Hayward Mobile Country Club (adult community 55+) has: 2 bedrooms; 2 full baths; 2 cell clear story skylight in living room; vaulted ceilings throughout; galley style kitchen; primary bedroom with private bath and walk in closet; indoor laundry room with washer and dryer included; relaxing front porch; 1 shed and more, this home is ready for it's new owners to enjoy!
-
2026-02-23status Pending 391-char remark
Show marketing remark (391 chars)
Manufactured home in Hayward Mobile Country Club (adult community 55+) has: 2 bedrooms; 2 full baths; 2 cell clear story skylight in living room; vaulted ceilings throughout; galley style kitchen; primary bedroom with private bath and walk in closet; indoor laundry room with washer and dryer included; relaxing front porch; 1 shed and more, this home is ready for it's new owners to enjoy!
-
2026-02-09$269,900 Active 391-char remark
Show marketing remark (391 chars)
Manufactured home in Hayward Mobile Country Club (adult community 55+) has: 2 bedrooms; 2 full baths; 2 cell clear story skylight in living room; vaulted ceilings throughout; galley style kitchen; primary bedroom with private bath and walk in closet; indoor laundry room with washer and dryer included; relaxing front porch; 1 shed and more, this home is ready for it's new owners to enjoy!
ⓘ Source: listings_history table (triggers on properties + properties_extension) + one-shot
backfill from property_details.listing_events for pre-trigger history.
Tax reassessment forecast CA · Resets to sale price
- Current annual tax
- $675 · $56/mo
- Projected year-2 tax
- $2,013 · $168/mo
- Expected delta
- +$1,338/yr (+$111/mo · 198.1%)
ⓘ Screening estimate from a state-policy table — verify with the county assessor before closing.
Climate risk First Street
- Flood 1/10 Low FEMA zone X (unshaded) · 0% chance over 30 yrs
- Wildfire 1/10 Low
- Heat 4/10 Moderate 7 d/yr ≥88°F today · 14 d/yr by 30 yrs out
- Wind 1/10 Low
- Air quality 7/10 Severe 12 unhealthy d/yr today · 12 by 30 yrs out
Nearby sold comps map
Loading sold comps map…
Walkable amenities ~0.75 mi
Loading nearby amenities…
Taxation est. · year 1
- Rental income
- $36,859
- − Mortgage interest
- −$14,839
- − Property taxes
- −$675
- − Insurance
- −$1,324
- − Repairs & maintenance
- −$2,949
- − Management
- −$2,949
- − Depreciation
- −$7,706
- Taxable income
- $6,417
- Est. tax owed @ 24.0%
- −$1,540
- After-tax cash flow
- $8,909/yr
For passive investors: Depreciation is non-cash, so a rental often shows a tax loss while cash-flowing — sheltering income. Rental losses are passive: they offset passive income freely, and up to $25,000/yr can offset ordinary (W-2) income if you actively participate and your MAGI is under $100k (phasing out to $0 by $150k); unused losses carry forward. On sale, claimed depreciation is recaptured at up to 25%, and gains may owe capital-gains tax (a 1031 exchange can defer both). Figures are a year-1 estimate at your 24.0% rate — not tax advice; consult a CPA.
Schools (NCES district)
- District
- Hayward Unified
- NCES district ID
- 0616740
- Math proficiency
- 25% ▼ -1.00%
- Reading proficiency
- 37% ▬ 0.00%
- Median HH income
- $65,326
- Composite
- 31.27/100
- National rank
- #11241
- State rank
- #935 of 1400 in CA
Livability — Hayward
- Score
- 75/100
- State rank
- #124
- US rank
- #4294
Category grades
Schools grade is shown separately in the Schools card above.
Census & demographics
- Census place
- Hayward, CA
- County
- Alameda County · 1,614,355 people
- City population
- 191,800
- Metro
- San Francisco-Oakland-Berkeley, CA
- Population (ZIP)
- 32,843
- Household income
- $114,356
- Rent vs Own
- Severe rent burden
- 702.0
Population outlook (Alameda County) Hauer SSP2
- Today (2025)
- 1,928,884 people
- By 2030
- 2,069,146 · +7.3%
- By 2040
- 2,338,405 · +21.2%
- By 2050
- 2,586,608 · +34.1%
- By 2075
- 3,061,911 · +58.7%
- By 2100
- 3,234,133 · +67.7%
Race, ethnicity, and origin ACS 2023
- Neighborhood character
- Diverse neighborhood (Simpson 0.69)
- Race & ethnicity
- Asian 42% Hispanic / Latino 35% Two or more races 12% White 10% Black 8% Native American 1% Pacific Islander 1%
- Hispanic origin (detail)
- Mexican 25%
- Common ancestry
- Italian 1% Russian 1% Romanian 1%
- Foreign-born
- 43% · Canada, China, Vietnam
- Languages at home
- 39% English-only · Spanish 26% Tagalog/Filipino 14% Chinese 7%
Political lean MEDSL · Alameda
- 2024 margin
- Solid D (+53.6) · D 74.6% · R 21.0% · Other 4.4%
- 2008→2024 swing
- -5.9pp toward R · 2008: 59.5pp · 2024: 53.6pp
- All cycles
- 2024: D+53.6 2020: D+62.5 2016: D+64.4 2012: D+59.8 2008: D+59.5
Not yet ingested
- Civics
- —
Market trends
- HPI YoY
- ▼ -974.17%
- Current HPI
- 304.698
- Rent YoY
- ▲ 2.61%
- Metro
- San Francisco-Oakland-Berkeley, CA
- State GDP YoY
- ▲ 3.21%
- F500 in state
- 116
Industry mix (Fortune 500 HQ in CA)
| Industry | F500 HQs | Revenue |
|---|---|---|
| Technology | 27 | $1,492B |
|
||
| Financial Services | 3 | $174B |
|
||
| Retail | 3 | $44B |
|
||
| Insurance | 3 | $26B |
|
||
| Media / Entertainment | 2 | $115B |
|
||
| Pharmaceuticals / Biotech | 2 | $62B |
|
||
Price history
-1.9% since first listed5 events — show timeline
- 2026-05-16 Pending — bridgeMLS, Bay East AOR, or Contra Costa AOR
- 2026-05-05 Price Changed $264,900 bridgeMLS, Bay East AOR, or Contra Costa AOR
- 2026-03-12 Relisted — bridgeMLS, Bay East AOR, or Contra Costa AOR
- 2026-02-23 Pending — bridgeMLS, Bay East AOR, or Contra Costa AOR
- 2026-02-09 Listed $269,900 bridgeMLS, Bay East AOR, or Contra Costa AOR
Property tax history
+1.3%/yrLatest (2025): $675 · -1.6% YoY. Source: county tax records.
Cash-flow waterfall
monthlySold comps — $/sqft
last 12 mo · ≤1 miLoading sold comps…